| Param | Original file | Final file |
|---|---|---|
| Filename | modeM0/AS1A09_079T03_9000003790_26247cztM0_level2.evt | modeM0/AS1A09_079T03_9000003790_26247cztM0_level2_quad_clean.evt |
| Size (bytes) | 527,034,240 | 91,751,040 |
| Size | 502.6 MB | 87.5 MB |
| Events in quadrant A | 3,328,597 | 576,169 |
| Events in quadrant B | 3,278,046 | 600,026 |
| Events in quadrant C | 4,814,579 | 564,825 |
| Events in quadrant D | 4,077,697 | 562,754 |
| Mode M0 | |||
|---|---|---|---|
| Quadrant | BADHDUFLAG | Total packets | Discarded packets |
| A | 0 | 14381 | 0 |
| B | 0 | 14136 | 0 |
| C | 0 | 18745 | 0 |
| D | 0 | 16729 | 0 |
| Mode M9 | |||
|---|---|---|---|
| Quadrant | BADHDUFLAG | Total packets | Discarded packets |
| A | 0 | 3 | 0 |
| B | 0 | 3 | 0 |
| C | 0 | 3 | 0 |
| D | 0 | 3 | 0 |
| Quadrant | Total seconds | Saturated seconds | Saturation percentage |
|---|---|---|---|
| A | 6814 | 264 | 3.874376% |
| B | 6814 | 241 | 3.536836% |
| C | 6814 | 584 | 8.570590% |
| D | 6814 | 445 | 6.530672% |
Noise dominated data is calculated using 1-second bins in cleaned event files. If a bin has >2000 counts, and if more than 50% of those come from <1% of pixels, then it is considered to be noise-dominated and hence unusable.
| Quadrant | # 1 sec bins | Bins with >0 counts | Bins with >2000 counts | High rate bins dominated by noise | Noise dominated (total time) | Noise dominated (detector-on time) | Marked lightcurve |
|---|---|---|---|---|---|---|---|
| A | 6984 | 6816 | 15 | 15 | 0.21% | 0.22% | 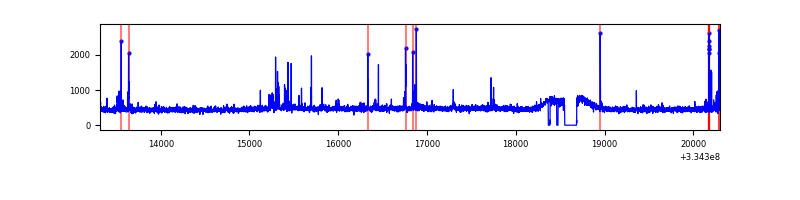 |
| B | 6984 | 6816 | 2 | 2 | 0.03% | 0.03% | 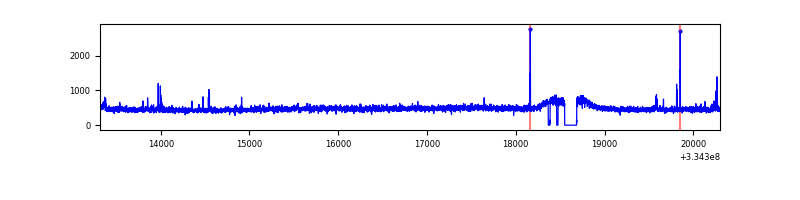 |
| C | 6984 | 6816 | 163 | 163 | 2.33% | 2.39% | 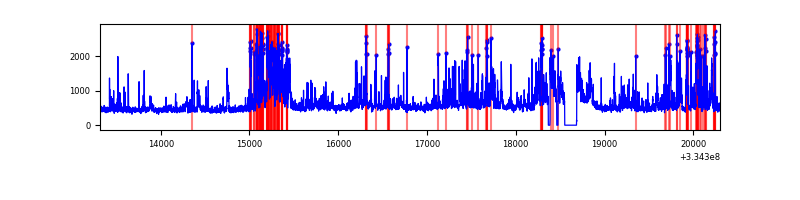 |
| D | 6984 | 6816 | 232 | 232 | 3.32% | 3.40% | 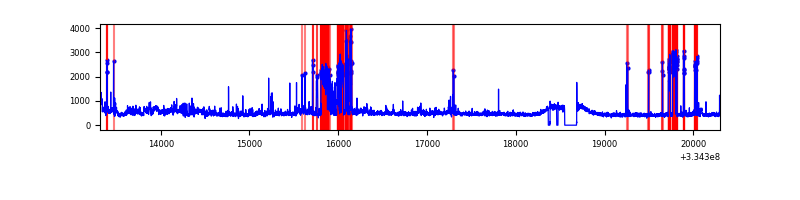 |
Top three noisy pixels from each quadrant. If the there are fewer than three noisy pixels in the level2.evt file, extra rows are filled as -1
| Pixel properties | Quadrant properties | ||||||
|---|---|---|---|---|---|---|---|
| Quadrant | DetID | PixID | Counts | Sigma | Mean | Median | Sigma |
| A | 0 | 13 | 151504 | 909.4 | 823 | 804 | 165.7 |
| A | 13 | 254 | 10986 | 61.44 | 823 | 804 | 165.7 |
| A | 3 | 137 | 7818 | 42.32 | 823 | 804 | 165.7 |
| B | 12 | 111 | 19617 | 119.24 | 820 | 798 | 157.8 |
| B | 0 | 230 | 18239 | 110.51 | 820 | 798 | 157.8 |
| B | 7 | 219 | 17392 | 105.14 | 820 | 798 | 157.8 |
| C | 3 | 233 | 1631400 | 9007.05 | 772 | 777 | 181.0 |
| C | 14 | 238 | 121869 | 668.87 | 772 | 777 | 181.0 |
| C | 2 | 16 | 46643 | 253.35 | 772 | 777 | 181.0 |
| D | 1 | 52 | 1040157 | 5498.26 | 792 | 770 | 189.0 |
| D | 2 | 234 | 28321 | 145.74 | 792 | 770 | 189.0 |
| D | 2 | 120 | 14738 | 73.89 | 792 | 770 | 189.0 |
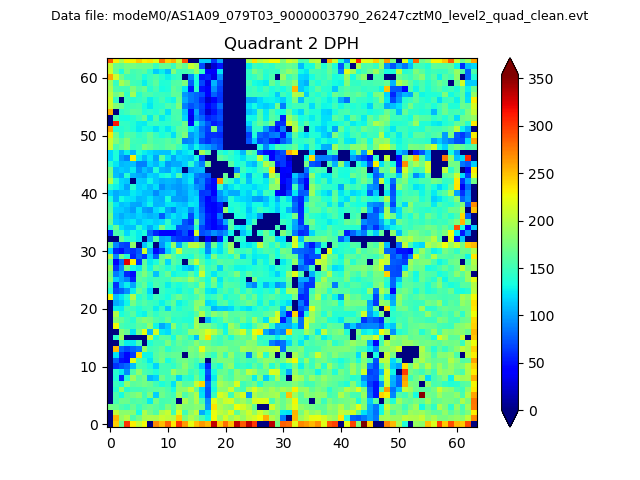
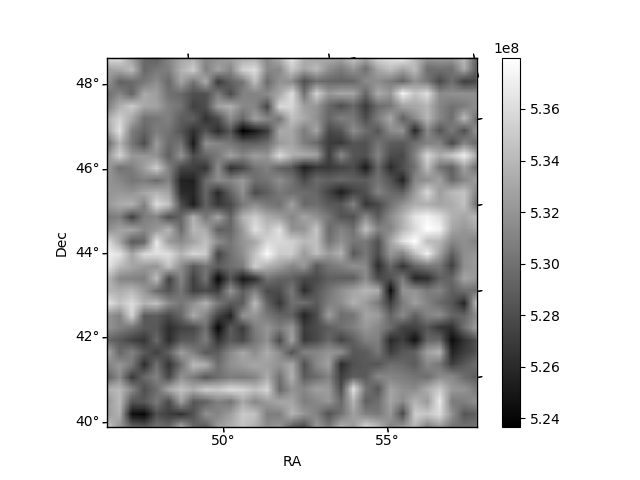
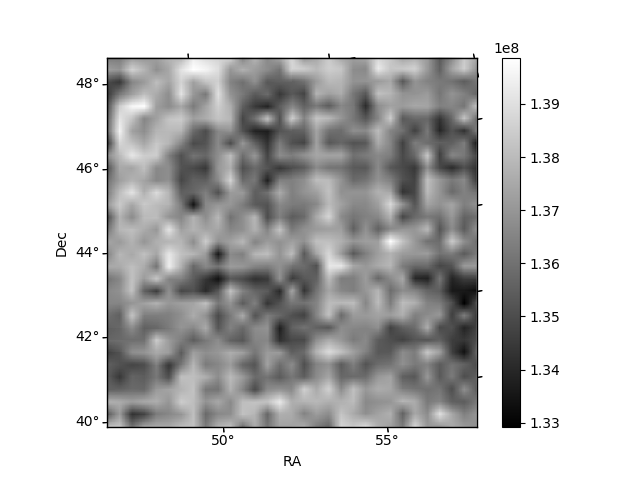
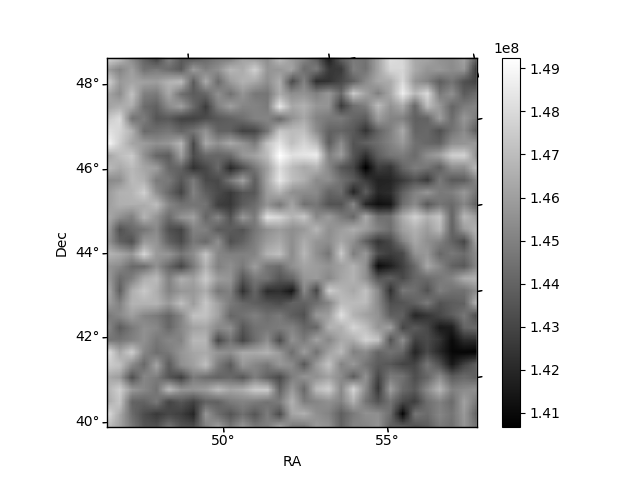
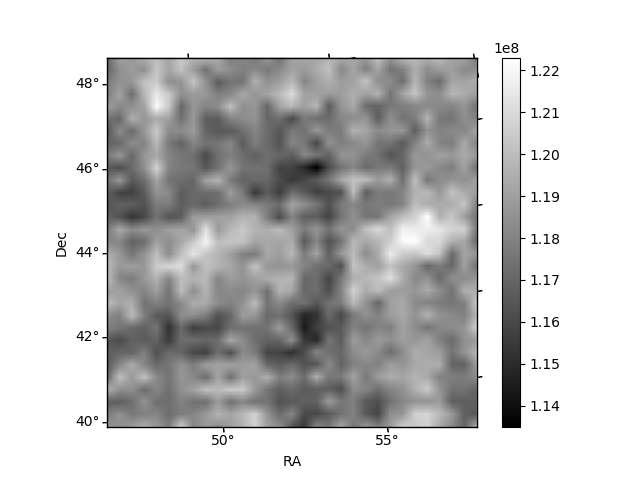
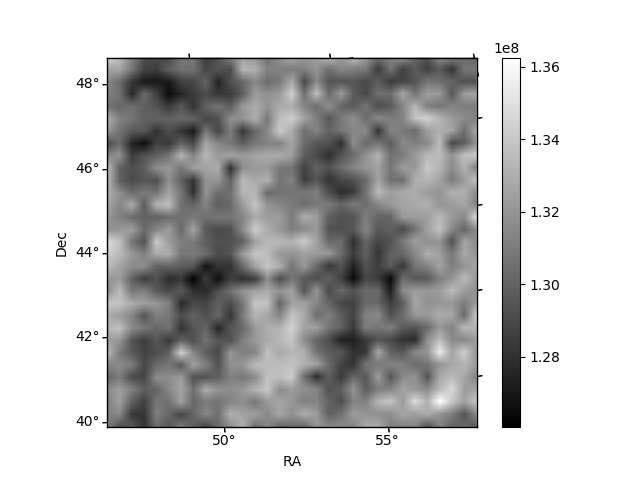
Histogram calculated using DETX and DETY for each event in the final _common_clean file
| Quadrant A | 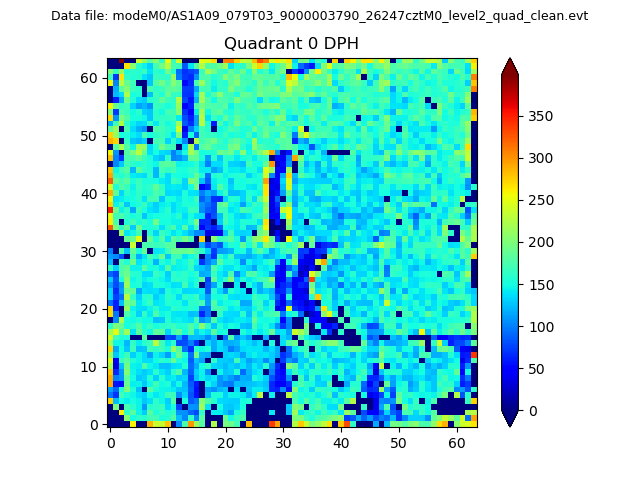 |
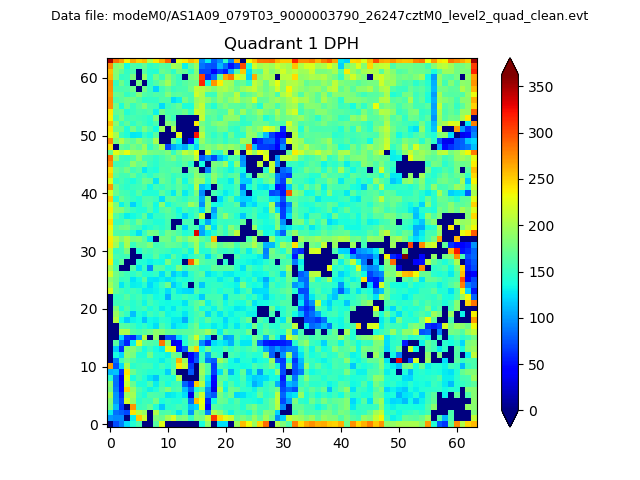 |
Quadrant B |
|---|---|---|---|
| Quadrant D | 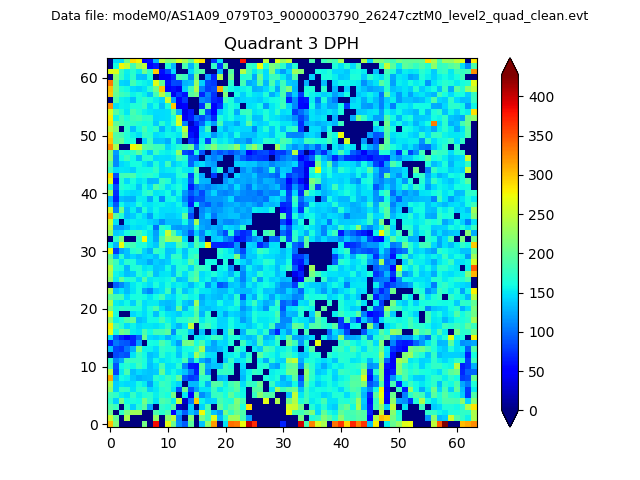 |
 |
Quadrant C |
| Plot type | Count rate plots | Images |
|---|---|---|
| Comparison with Poisson distribution Blue bars denote a histogram of data divided into 1 sec bins. Red curve is a Poisson curve with rate = median count rate of data. |
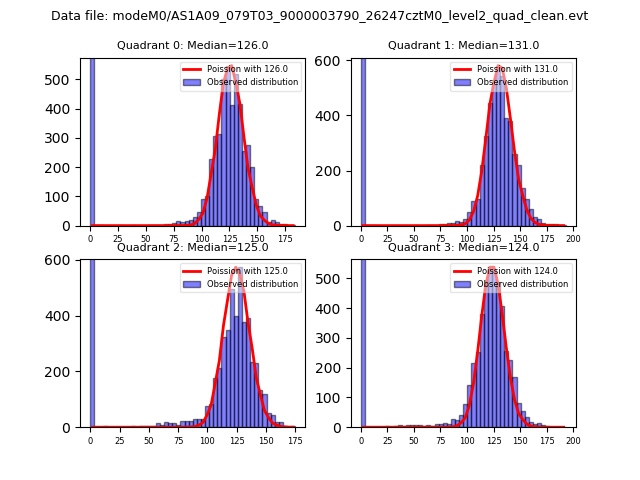 |
 |
| Quadrant-wise count rates Data is divided into 100 sec bins |
 |
|
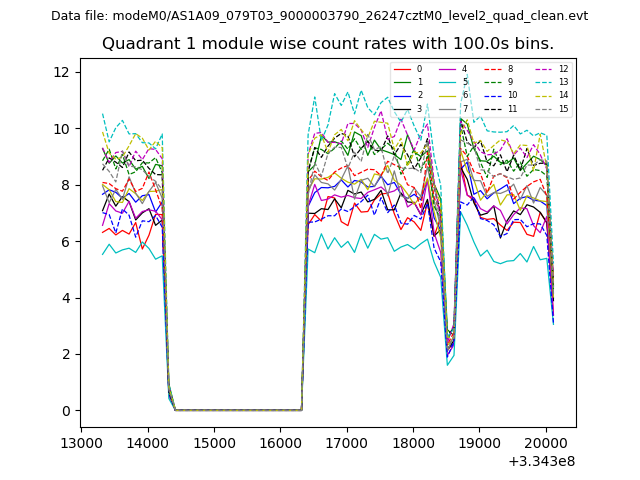
| Module-wise count rates for Quadrant A Data is divided into 100 sec bins |
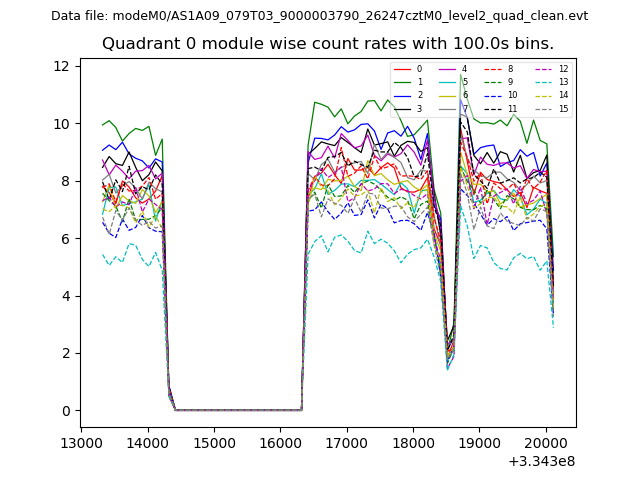 |
 |
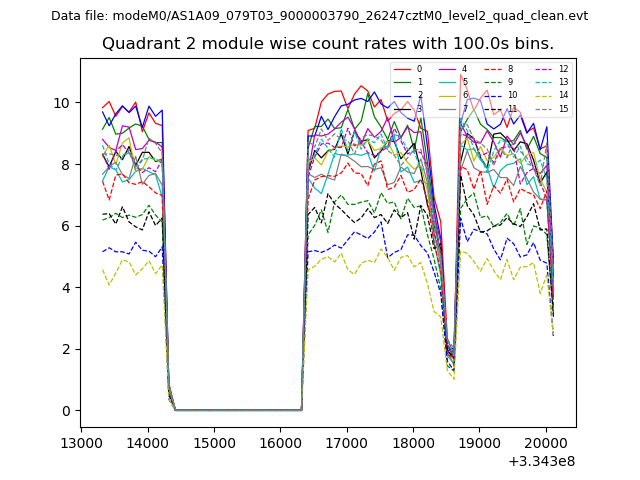
| Module-wise count rates for Quadrant B Data is divided into 100 sec bins |
 |
 |
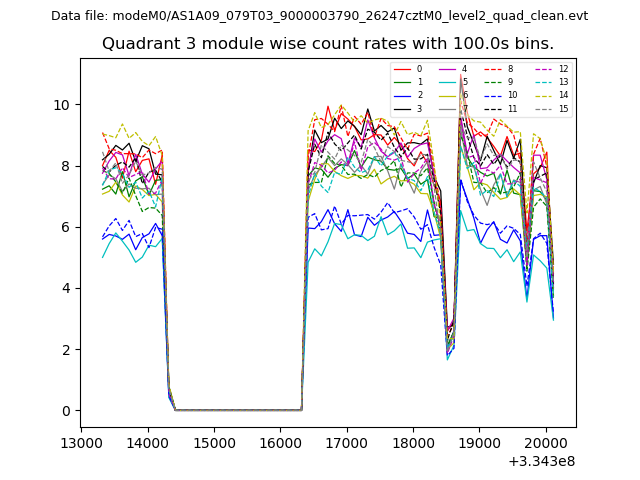
| Module-wise count rates for Quadrant C Data is divided into 100 sec bins |
 |
 |
| Module-wise count rates for Quadrant D Data is divided into 100 sec bins |
 |
 |
| Parameter | Plot |
|---|---|
| CZT HV Monitor | 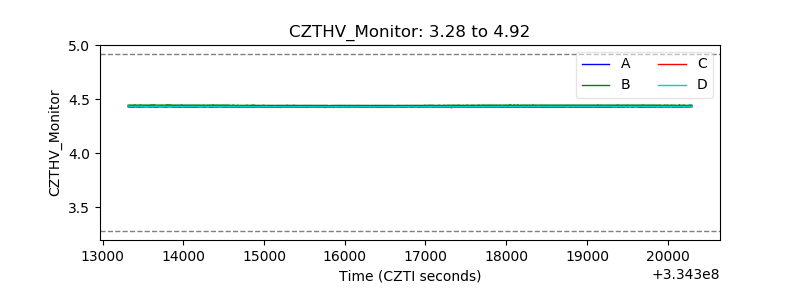 |
| D_VDD | 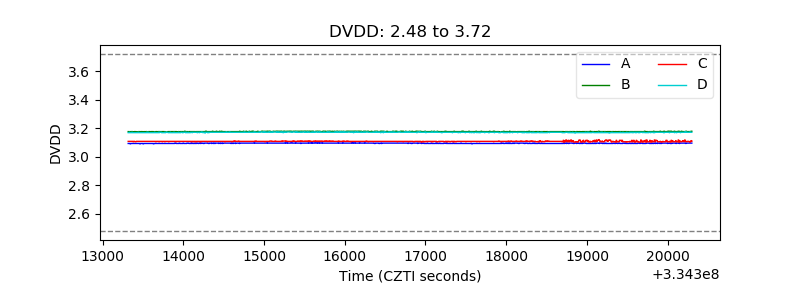 |
| Temperature 1 | 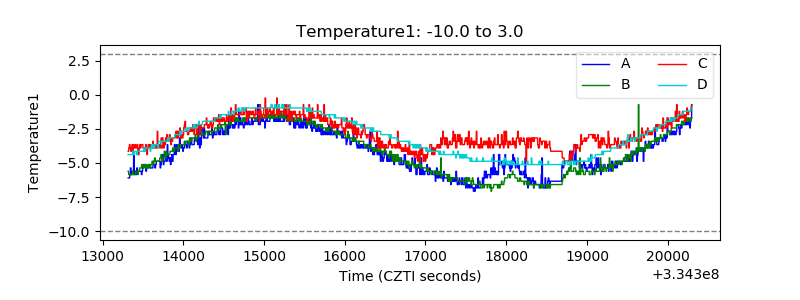 |
| Veto HV Monitor | 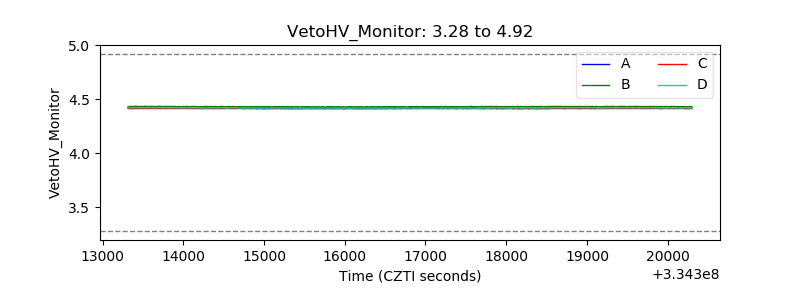 |
| Veto LLD | 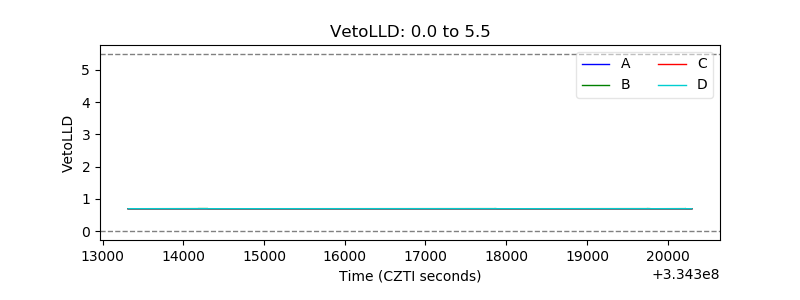 |
| Alpha Counter | 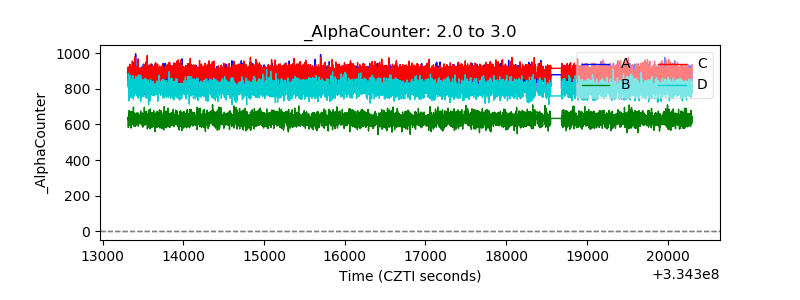 |
| _CPM_Rate | 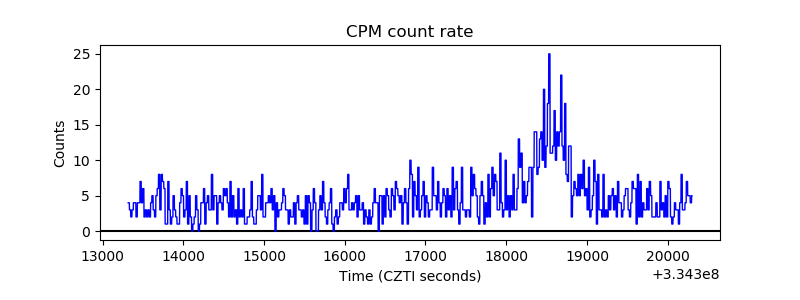 |
| CZT Counter |  |
| +2.5 Volts monitor |  |
| +5 Volts monitor |  |
| _ROLL_ROT | 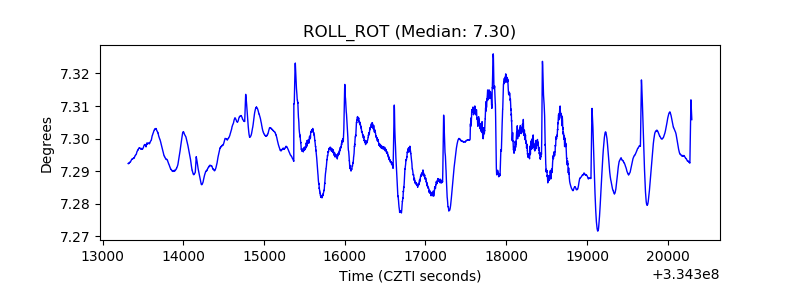 |
| _Roll_DEC | 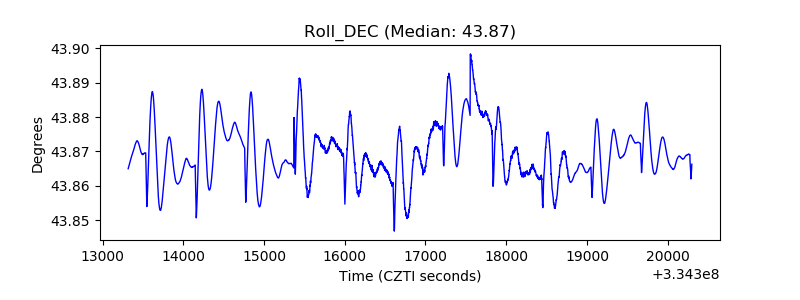 |
| _Roll_RA | 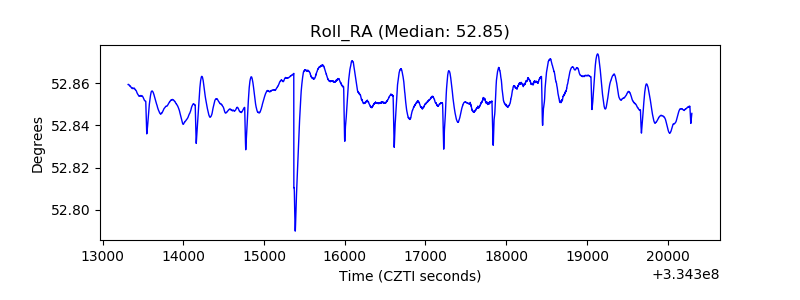 |
| Veto Counter | 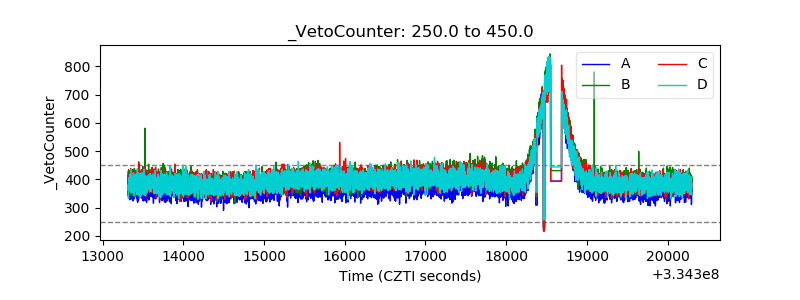 |