| Param | Original file | Final file |
|---|---|---|
| Filename | modeM0/AS1A09_079T03_9000003790_26248cztM0_level2.evt | modeM0/AS1A09_079T03_9000003790_26248cztM0_level2_quad_clean.evt |
| Size (bytes) | 539,830,080 | 93,818,880 |
| Size | 514.8 MB | 89.5 MB |
| Events in quadrant A | 3,648,118 | 582,463 |
| Events in quadrant B | 3,618,900 | 599,711 |
| Events in quadrant C | 4,487,570 | 578,889 |
| Events in quadrant D | 4,089,199 | 562,233 |
| Mode M0 | |||
|---|---|---|---|
| Quadrant | BADHDUFLAG | Total packets | Discarded packets |
| A | 0 | 15715 | 0 |
| B | 0 | 15492 | 0 |
| C | 0 | 18011 | 0 |
| D | 0 | 17244 | 0 |
| Mode M9 | |||
|---|---|---|---|
| Quadrant | BADHDUFLAG | Total packets | Discarded packets |
| A | 0 | 2 | 0 |
| B | 0 | 2 | 0 |
| C | 0 | 2 | 0 |
| D | 0 | 2 | 0 |
| Quadrant | Total seconds | Saturated seconds | Saturation percentage |
|---|---|---|---|
| A | 7430 | 216 | 2.907133% |
| B | 7431 | 225 | 3.027856% |
| C | 7431 | 324 | 4.360113% |
| D | 7431 | 361 | 4.858027% |
Noise dominated data is calculated using 1-second bins in cleaned event files. If a bin has >2000 counts, and if more than 50% of those come from <1% of pixels, then it is considered to be noise-dominated and hence unusable.
| Quadrant | # 1 sec bins | Bins with >0 counts | Bins with >2000 counts | High rate bins dominated by noise | Noise dominated (total time) | Noise dominated (detector-on time) | Marked lightcurve |
|---|---|---|---|---|---|---|---|
| A | 7635 | 7431 | 23 | 23 | 0.30% | 0.31% | 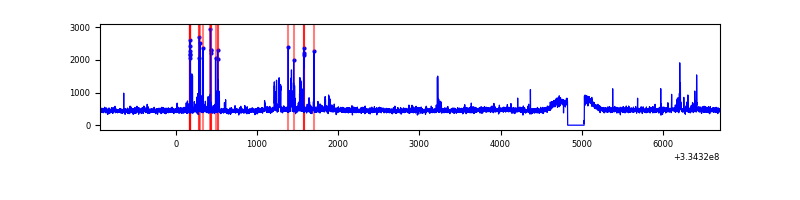 |
| B | 7636 | 7432 | 15 | 15 | 0.20% | 0.20% | 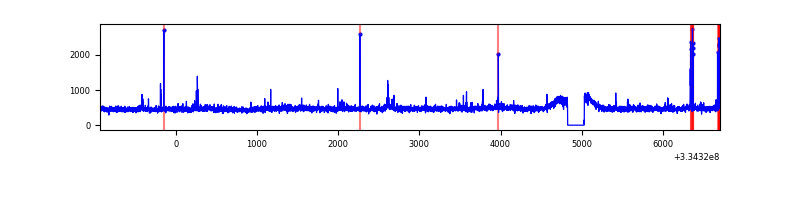 |
| C | 7636 | 7432 | 74 | 74 | 0.97% | 1.00% | 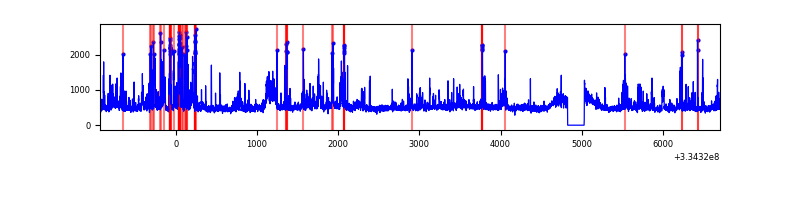 |
| D | 7636 | 7432 | 166 | 166 | 2.17% | 2.23% | 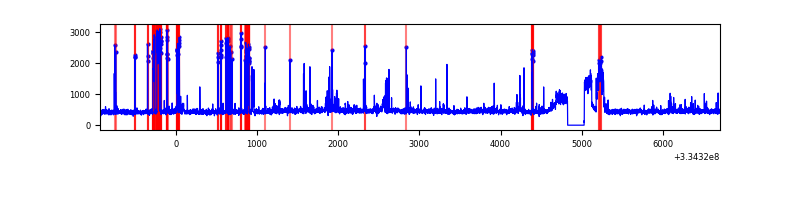 |
Top three noisy pixels from each quadrant. If the there are fewer than three noisy pixels in the level2.evt file, extra rows are filled as -1
| Pixel properties | Quadrant properties | ||||||
|---|---|---|---|---|---|---|---|
| Quadrant | DetID | PixID | Counts | Sigma | Mean | Median | Sigma |
| A | 0 | 13 | 184841 | 1014.52 | 896 | 875 | 181.3 |
| A | 13 | 254 | 13631 | 70.35 | 896 | 875 | 181.3 |
| A | 3 | 137 | 8564 | 42.4 | 896 | 875 | 181.3 |
| B | 5 | 172 | 58911 | 335.34 | 893 | 870 | 173.1 |
| B | 0 | 230 | 36951 | 208.47 | 893 | 870 | 173.1 |
| B | 12 | 111 | 21206 | 117.5 | 893 | 870 | 173.1 |
| C | 3 | 233 | 985047 | 4919.26 | 853 | 856 | 200.1 |
| C | 14 | 238 | 136228 | 676.63 | 853 | 856 | 200.1 |
| C | 2 | 16 | 24446 | 117.91 | 853 | 856 | 200.1 |
| D | 1 | 52 | 765837 | 3718.64 | 860 | 837 | 205.7 |
| D | 2 | 234 | 35855 | 170.22 | 860 | 837 | 205.7 |
| D | 12 | 233 | 24684 | 115.92 | 860 | 837 | 205.7 |
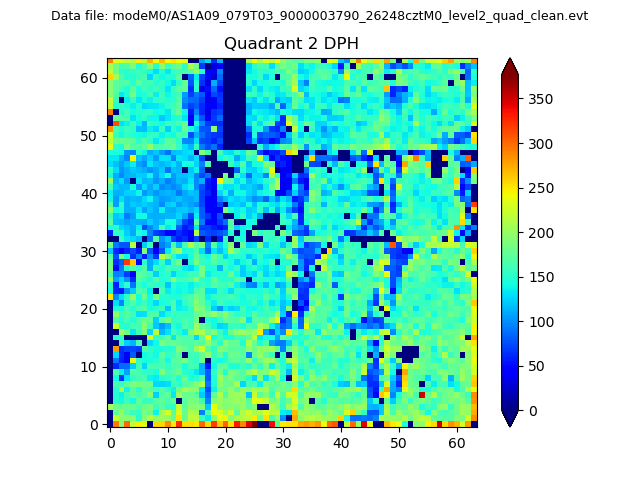
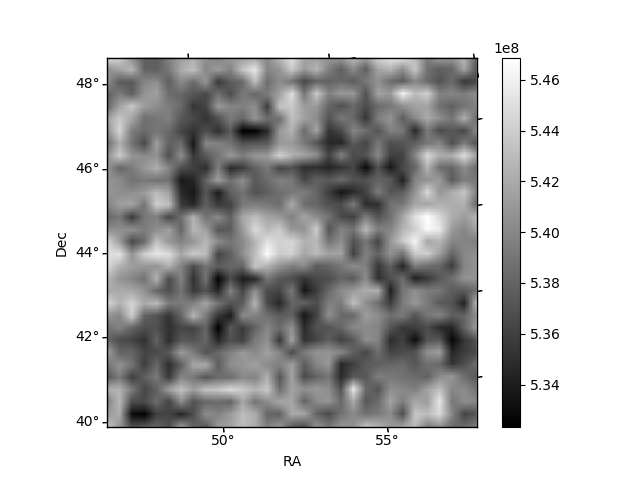
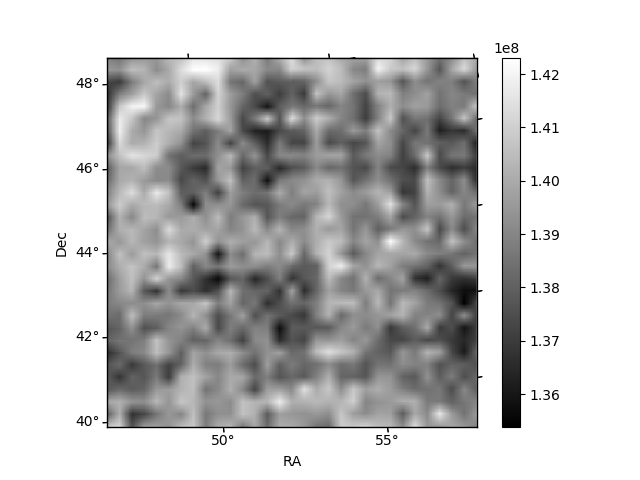
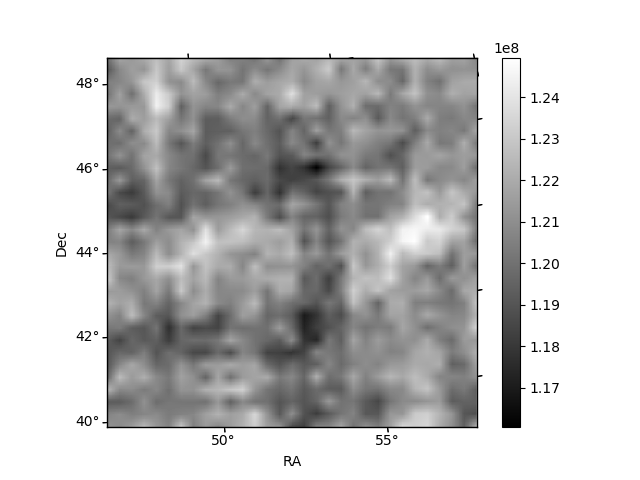
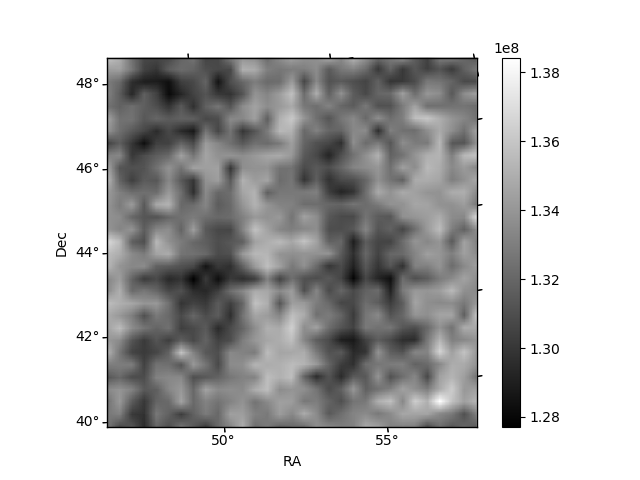
Histogram calculated using DETX and DETY for each event in the final _common_clean file
| Quadrant A | 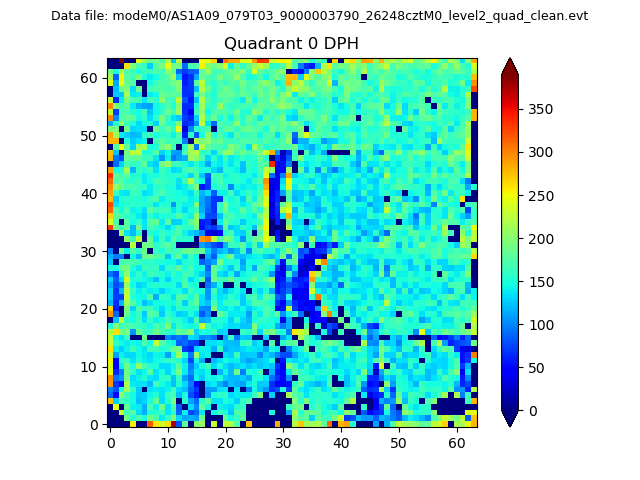 |
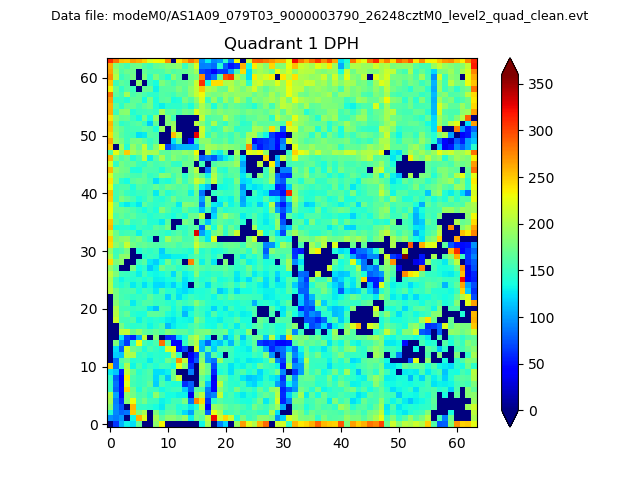 |
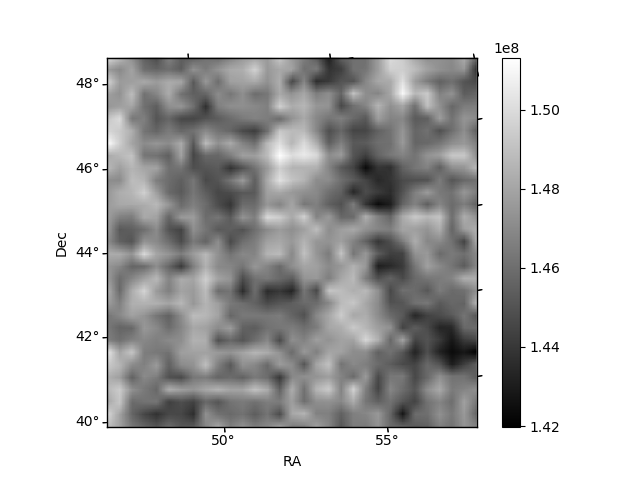
Quadrant B |
|---|---|---|---|
| Quadrant D | 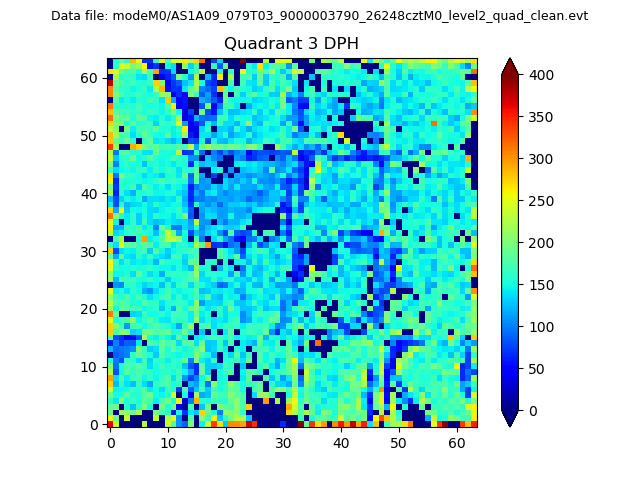 |
 |
Quadrant C |
| Plot type | Count rate plots | Images |
|---|---|---|
| Comparison with Poisson distribution Blue bars denote a histogram of data divided into 1 sec bins. Red curve is a Poisson curve with rate = median count rate of data. |
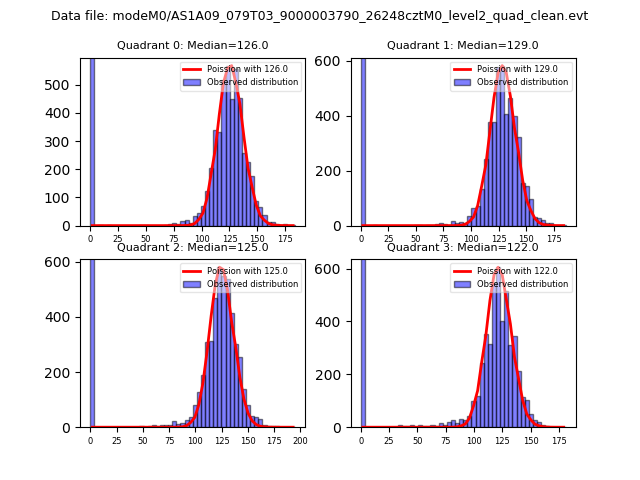 |
 |
| Quadrant-wise count rates Data is divided into 100 sec bins |
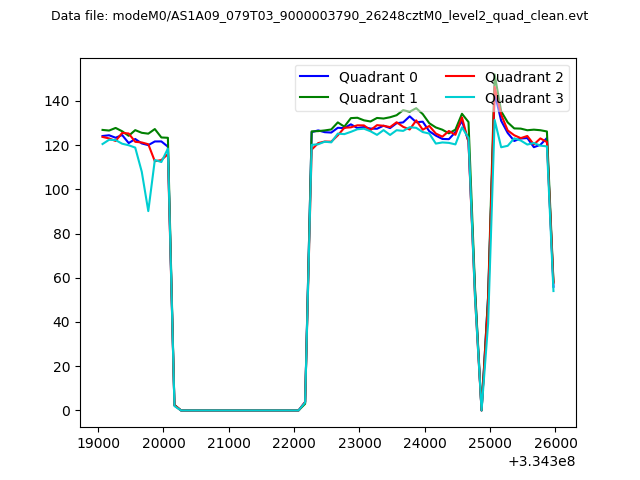 |
|
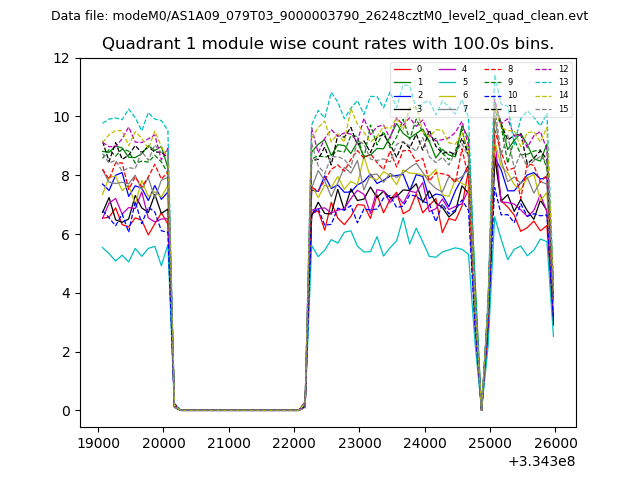
| Module-wise count rates for Quadrant A Data is divided into 100 sec bins |
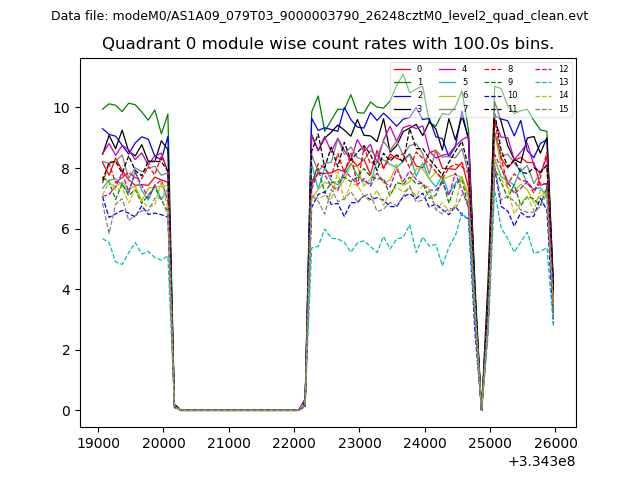 |
 |
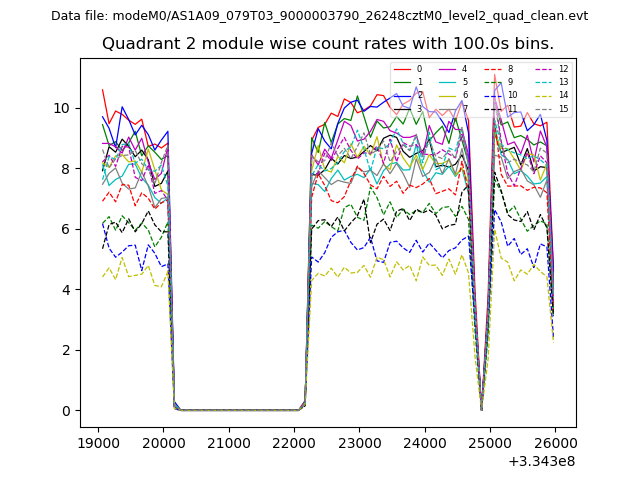
| Module-wise count rates for Quadrant B Data is divided into 100 sec bins |
 |
 |
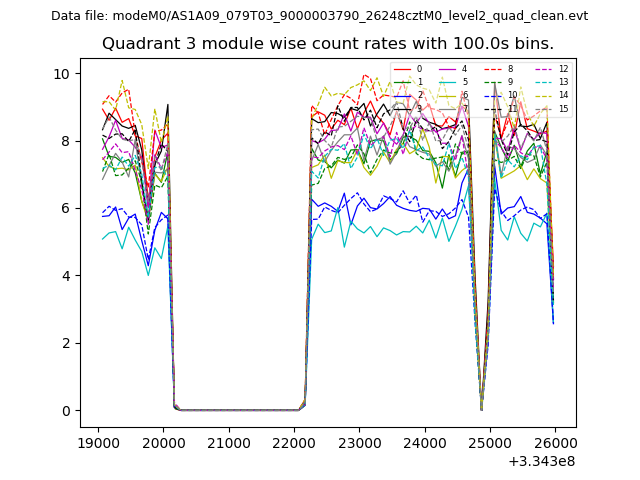
| Module-wise count rates for Quadrant C Data is divided into 100 sec bins |
 |
 |
| Module-wise count rates for Quadrant D Data is divided into 100 sec bins |
 |
 |
| Parameter | Plot |
|---|---|
| CZT HV Monitor | 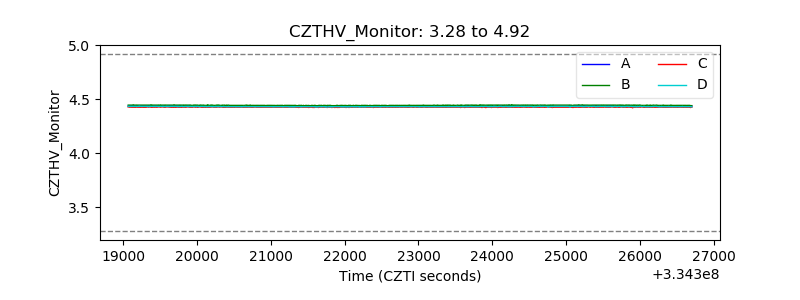 |
| D_VDD | 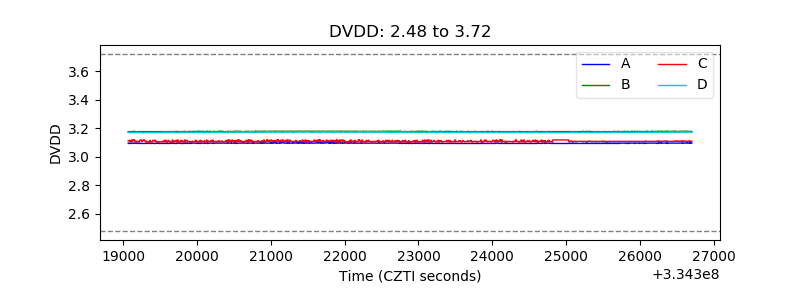 |
| Temperature 1 | 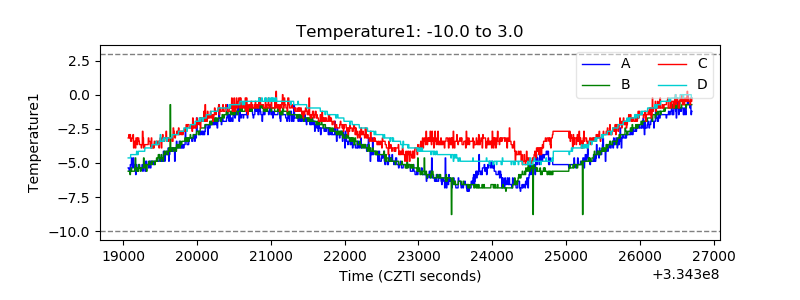 |
| Veto HV Monitor | 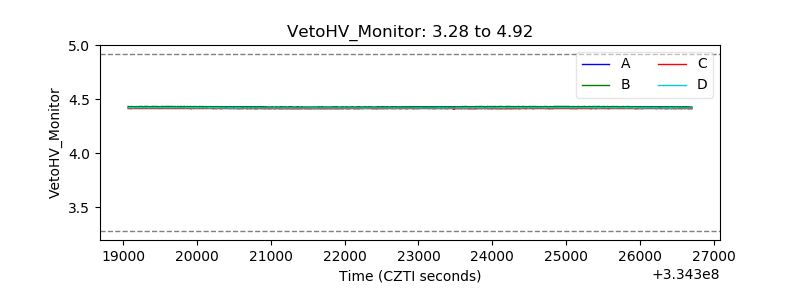 |
| Veto LLD | 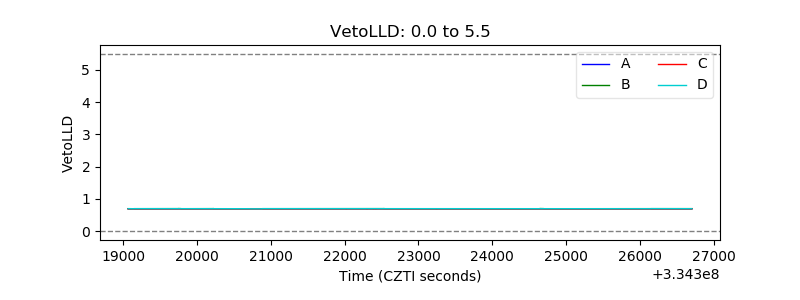 |
| Alpha Counter | 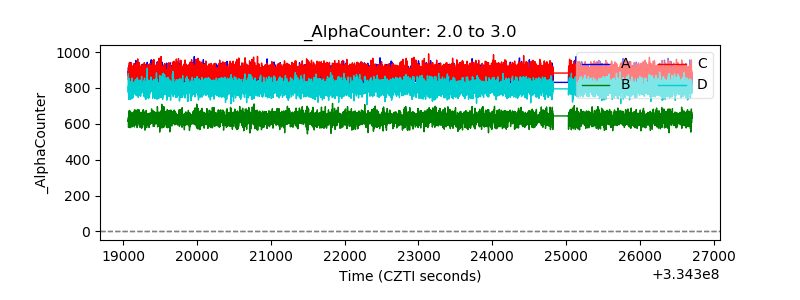 |
| _CPM_Rate | 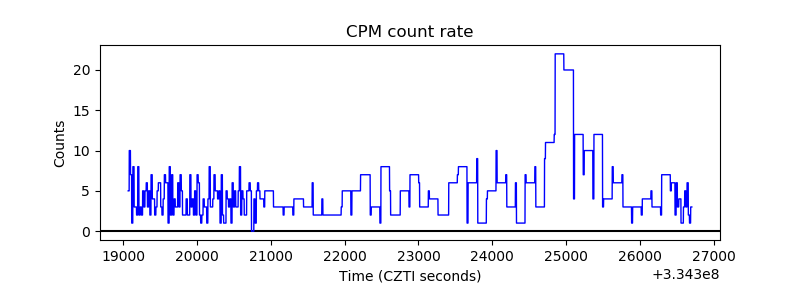 |
| CZT Counter | 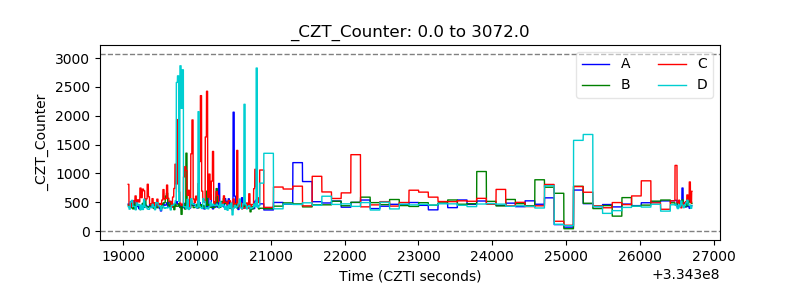 |
| +2.5 Volts monitor |  |
| +5 Volts monitor |  |
| _ROLL_ROT | 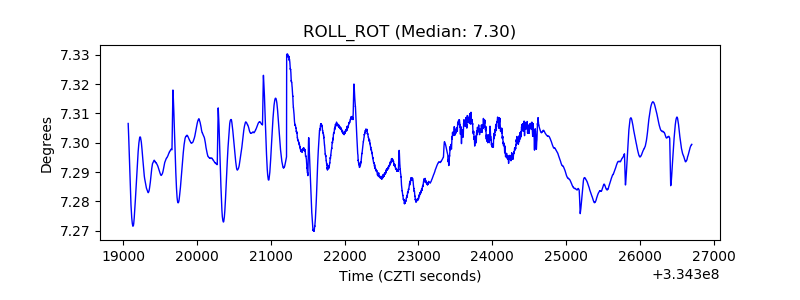 |
| _Roll_DEC | 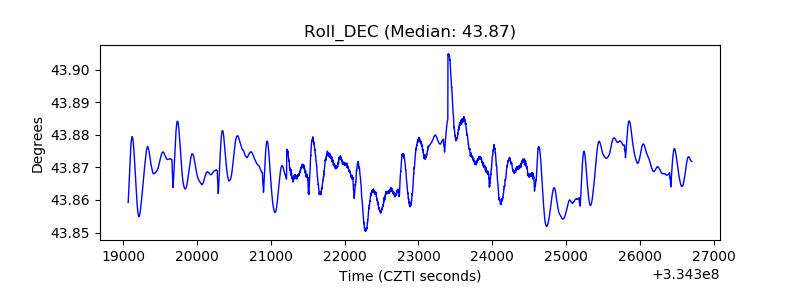 |
| _Roll_RA | 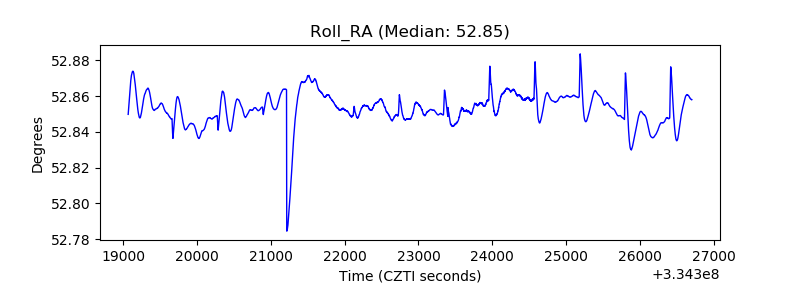 |
| Veto Counter | 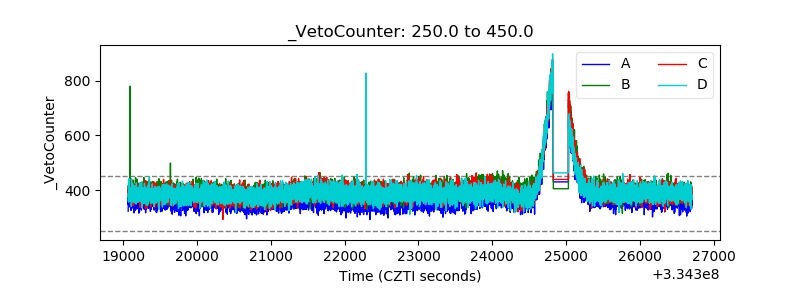 |