| Param | Original file | Final file |
|---|---|---|
| Filename | modeM0/AS1A09_079T03_9000003790_26251cztM0_level2.evt | modeM0/AS1A09_079T03_9000003790_26251cztM0_level2_quad_clean.evt |
| Size (bytes) | 1,308,055,680 | 208,373,760 |
| Size | 1.2 GB | 198.7 MB |
| Events in quadrant A | 8,922,272 | 1,269,762 |
| Events in quadrant B | 8,986,173 | 1,302,977 |
| Events in quadrant C | 9,392,069 | 1,263,885 |
| Events in quadrant D | 11,099,525 | 1,235,415 |
| Mode M0 | |||
|---|---|---|---|
| Quadrant | BADHDUFLAG | Total packets | Discarded packets |
| A | 0 | 37973 | 0 |
| B | 0 | 38112 | 0 |
| C | 0 | 39051 | 0 |
| D | 0 | 45186 | 0 |
| Mode M9 | |||
|---|---|---|---|
| Quadrant | BADHDUFLAG | Total packets | Discarded packets |
| A | 0 | 19 | 0 |
| B | 0 | 19 | 0 |
| C | 0 | 19 | 0 |
| D | 0 | 19 | 0 |
| Quadrant | Total seconds | Saturated seconds | Saturation percentage |
|---|---|---|---|
| A | 17970 | 267 | 1.485810% |
| B | 17970 | 348 | 1.936561% |
| C | 17971 | 380 | 2.114518% |
| D | 17971 | 693 | 3.856213% |
Noise dominated data is calculated using 1-second bins in cleaned event files. If a bin has >2000 counts, and if more than 50% of those come from <1% of pixels, then it is considered to be noise-dominated and hence unusable.
| Quadrant | # 1 sec bins | Bins with >0 counts | Bins with >2000 counts | High rate bins dominated by noise | Noise dominated (total time) | Noise dominated (detector-on time) | Marked lightcurve |
|---|---|---|---|---|---|---|---|
| A | 19805 | 17973 | 49 | 49 | 0.25% | 0.27% |  |
| B | 19805 | 17973 | 75 | 75 | 0.38% | 0.42% | 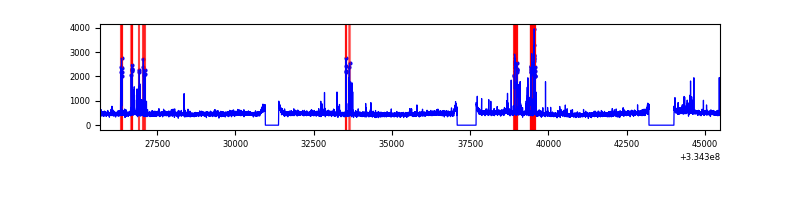 |
| C | 19805 | 17973 | 40 | 40 | 0.20% | 0.22% | 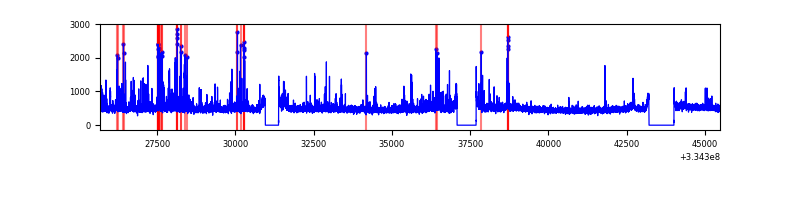 |
| D | 19805 | 17973 | 486 | 486 | 2.45% | 2.70% | 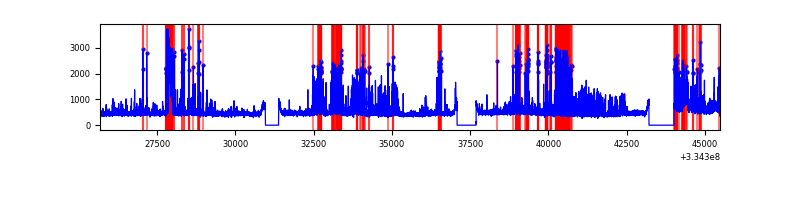 |
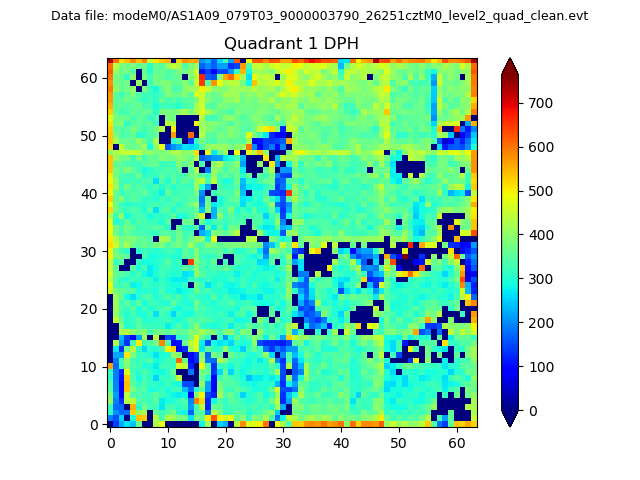
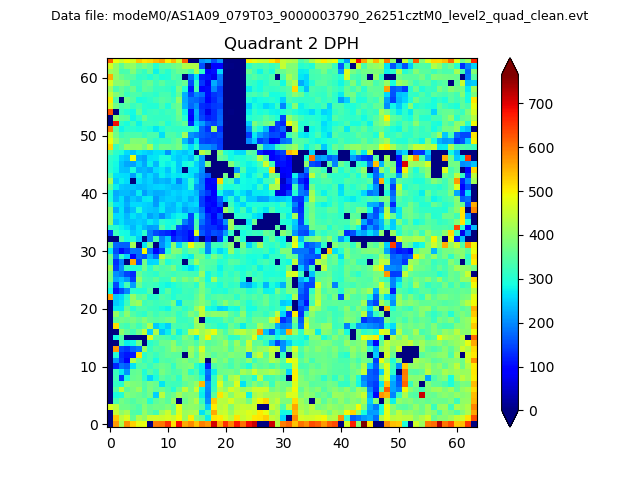
Top three noisy pixels from each quadrant. If the there are fewer than three noisy pixels in the level2.evt file, extra rows are filled as -1
| Pixel properties | Quadrant properties | ||||||
|---|---|---|---|---|---|---|---|
| Quadrant | DetID | PixID | Counts | Sigma | Mean | Median | Sigma |
| A | 0 | 13 | 506083 | 1155.43 | 2173 | 2126 | 436.2 |
| A | 13 | 254 | 31443 | 67.22 | 2173 | 2126 | 436.2 |
| A | 3 | 137 | 20368 | 41.82 | 2173 | 2126 | 436.2 |
| B | 5 | 172 | 458627 | 1099.92 | 2164 | 2103 | 415.1 |
| B | 0 | 230 | 50718 | 117.13 | 2164 | 2103 | 415.1 |
| B | 12 | 111 | 49745 | 114.79 | 2164 | 2103 | 415.1 |
| C | 3 | 233 | 671965 | 1370.9 | 2087 | 2097 | 488.6 |
| C | 14 | 238 | 328785 | 668.58 | 2087 | 2097 | 488.6 |
| C | 2 | 16 | 249404 | 506.12 | 2087 | 2097 | 488.6 |
| D | 1 | 52 | 2980043 | 5954.51 | 2094 | 2040 | 500.1 |
| D | 2 | 234 | 85956 | 167.79 | 2094 | 2040 | 500.1 |
| D | 12 | 233 | 72147 | 140.18 | 2094 | 2040 | 500.1 |
Histogram calculated using DETX and DETY for each event in the final _common_clean file
| Quadrant A |  |
 |
Quadrant B |
|---|---|---|---|
| Quadrant D | 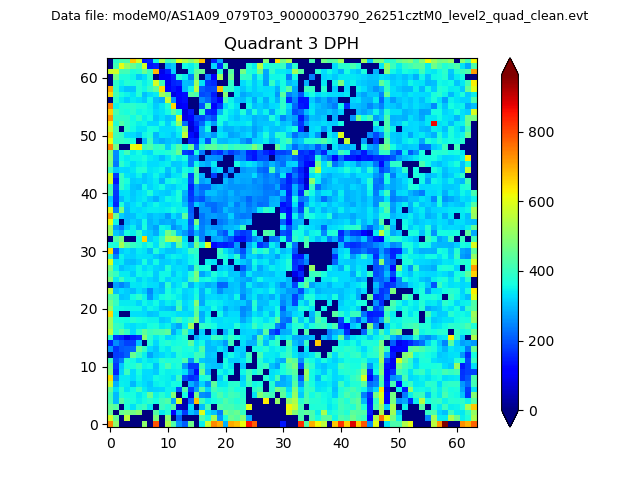 |
 |
Quadrant C |
| Plot type | Count rate plots | Images |
|---|---|---|
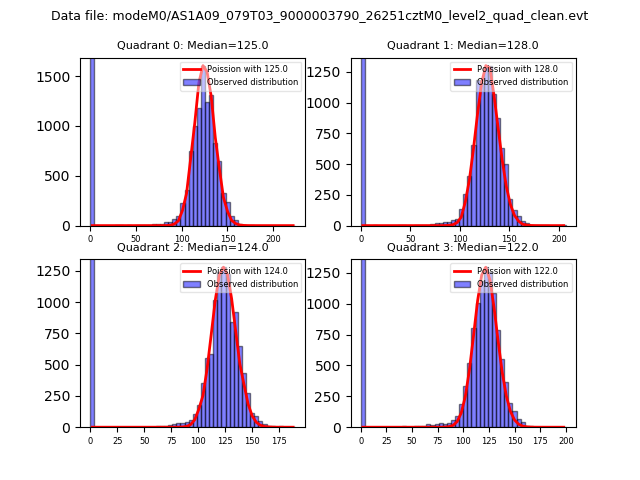
| Comparison with Poisson distribution Blue bars denote a histogram of data divided into 1 sec bins. Red curve is a Poisson curve with rate = median count rate of data. |
 |
 |
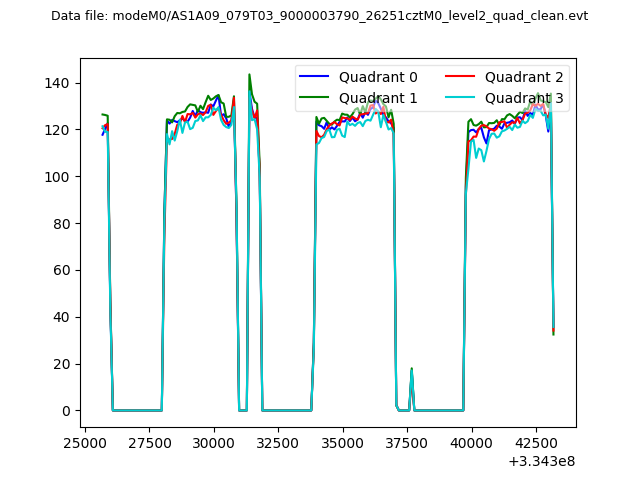
| Quadrant-wise count rates Data is divided into 100 sec bins |
 |
|
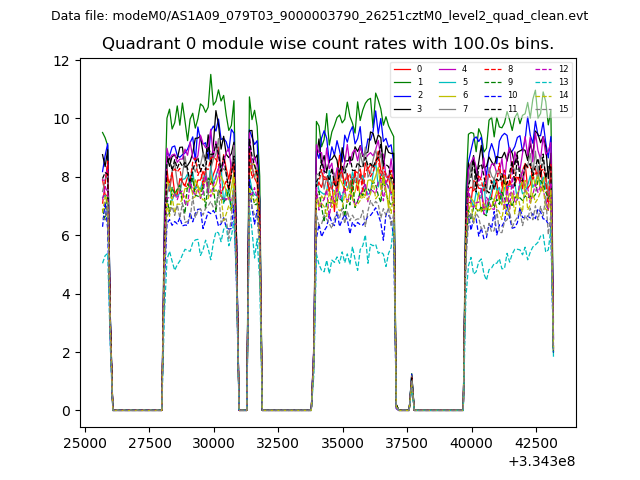
| Module-wise count rates for Quadrant A Data is divided into 100 sec bins |
 |
 |
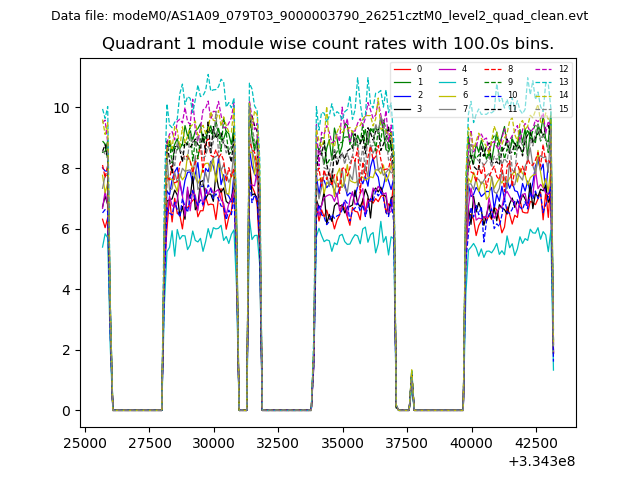
| Module-wise count rates for Quadrant B Data is divided into 100 sec bins |
 |
 |
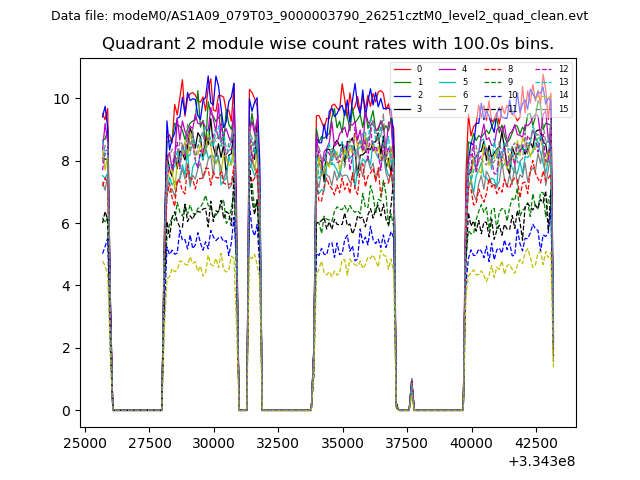
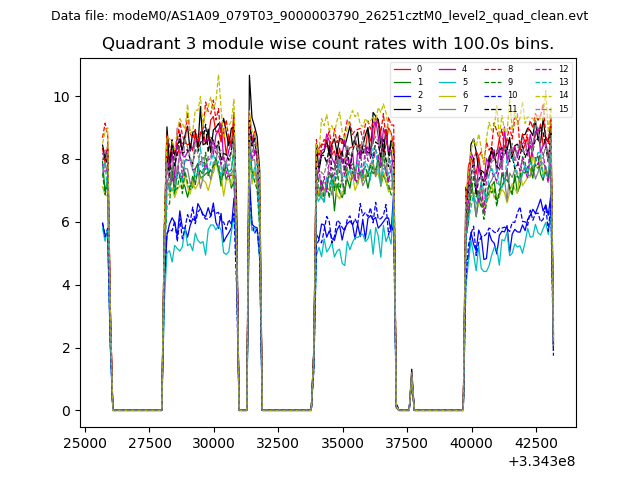
| Module-wise count rates for Quadrant C Data is divided into 100 sec bins |
 |
 |
| Module-wise count rates for Quadrant D Data is divided into 100 sec bins |
 |
 |
| Parameter | Plot |
|---|---|
| CZT HV Monitor | 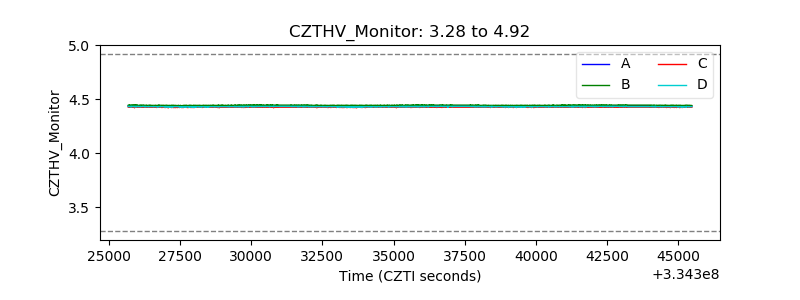 |
| D_VDD | 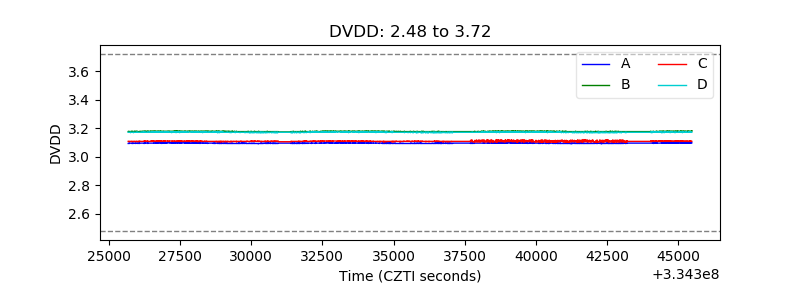 |
| Temperature 1 | 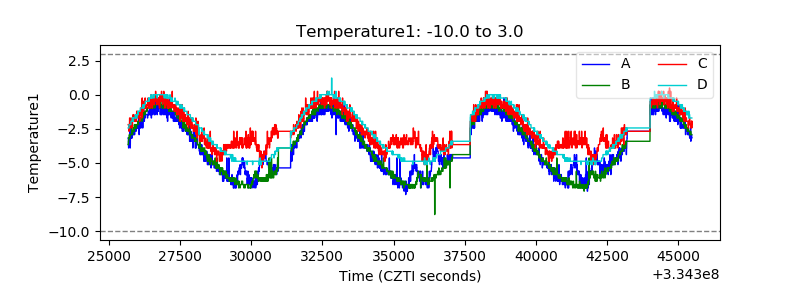 |
| Veto HV Monitor | 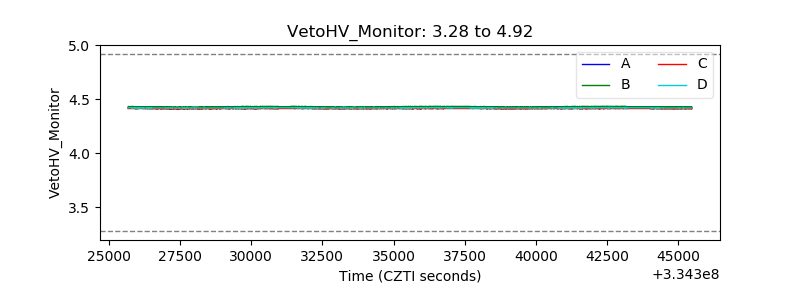 |
| Veto LLD | 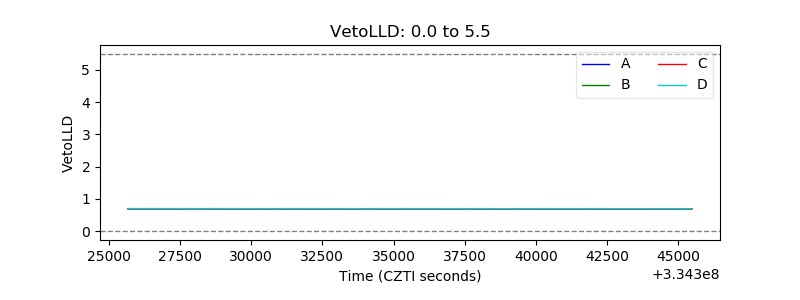 |
| Alpha Counter | 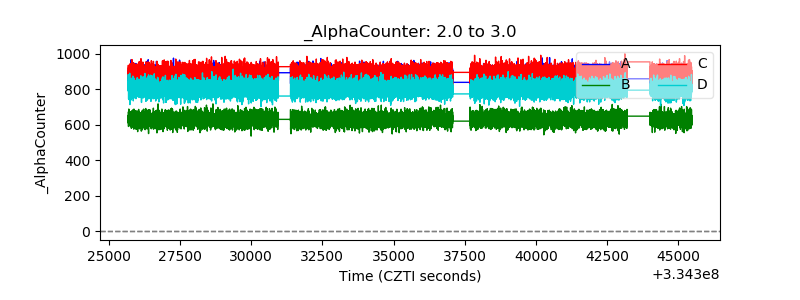 |
| _CPM_Rate | 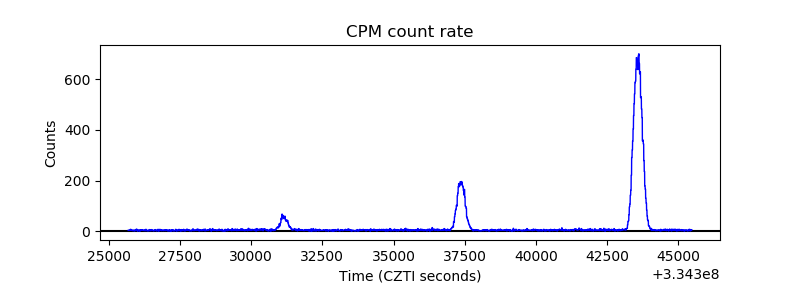 |
| CZT Counter | 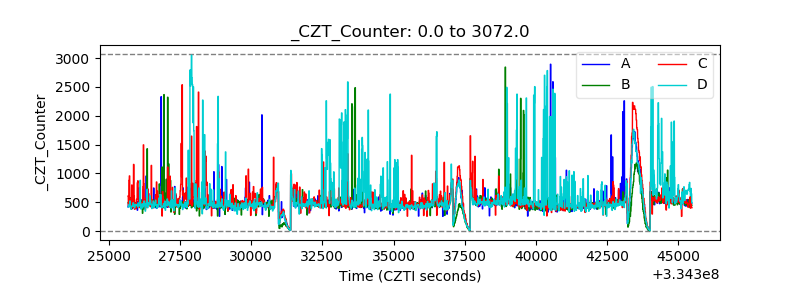 |
| +2.5 Volts monitor |  |
| +5 Volts monitor | 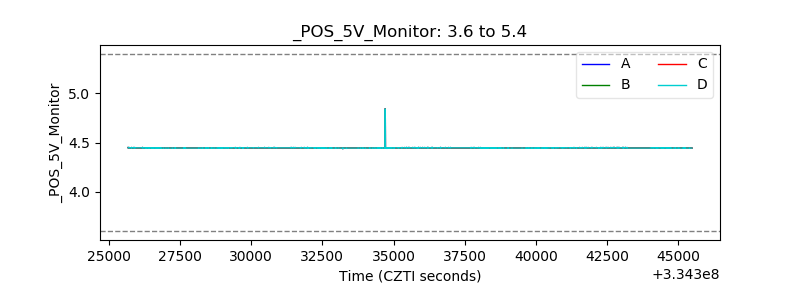 |
| _ROLL_ROT | 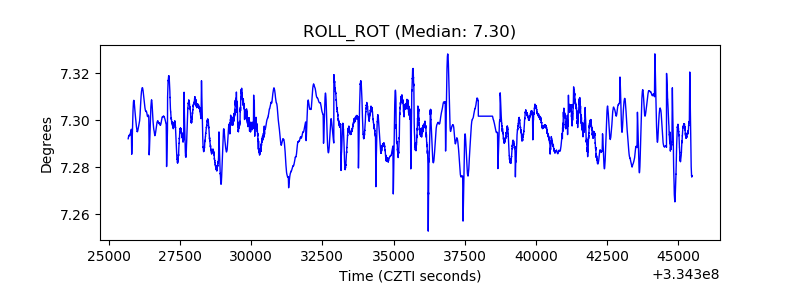 |
| _Roll_DEC | 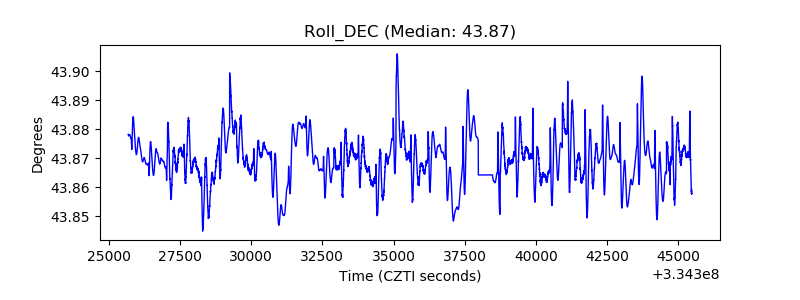 |
| _Roll_RA | 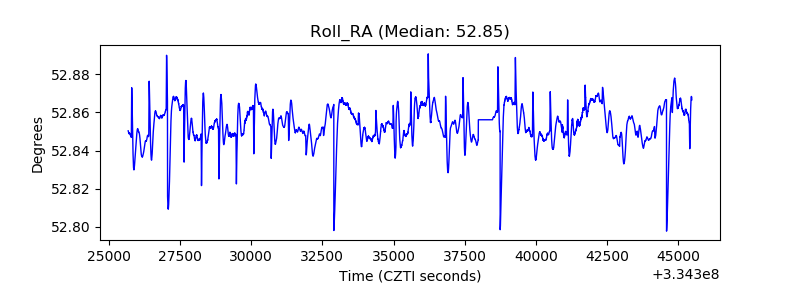 |
| Veto Counter | 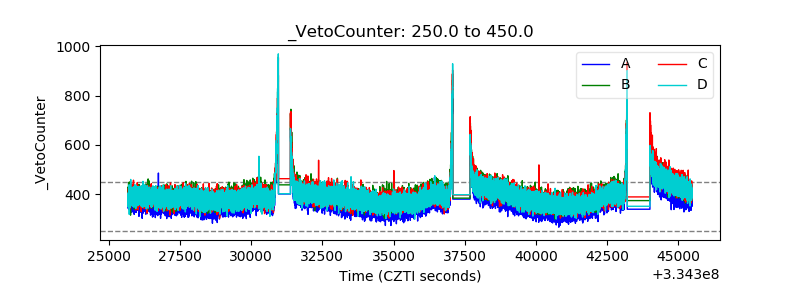 |