| Param | Original file | Final file |
|---|---|---|
| Filename | modeM0/AS1A09_079T03_9000003790_26252cztM0_level2.evt | modeM0/AS1A09_079T03_9000003790_26252cztM0_level2_quad_clean.evt |
| Size (bytes) | 497,931,840 | 78,045,120 |
| Size | 474.9 MB | 74.4 MB |
| Events in quadrant A | 3,395,047 | 475,926 |
| Events in quadrant B | 3,353,877 | 486,889 |
| Events in quadrant C | 3,376,217 | 476,724 |
| Events in quadrant D | 4,503,144 | 459,840 |
| Mode M0 | |||
|---|---|---|---|
| Quadrant | BADHDUFLAG | Total packets | Discarded packets |
| A | 0 | 14337 | 0 |
| B | 0 | 14287 | 0 |
| C | 0 | 14306 | 0 |
| D | 0 | 18088 | 0 |
| Mode M9 | |||
|---|---|---|---|
| Quadrant | BADHDUFLAG | Total packets | Discarded packets |
| A | 0 | 17 | 0 |
| B | 0 | 18 | 0 |
| C | 0 | 18 | 0 |
| D | 0 | 18 | 0 |
| Quadrant | Total seconds | Saturated seconds | Saturation percentage |
|---|---|---|---|
| A | 6656 | 55 | 0.826322% |
| B | 6656 | 62 | 0.931490% |
| C | 6656 | 116 | 1.742788% |
| D | 6656 | 320 | 4.807692% |
Noise dominated data is calculated using 1-second bins in cleaned event files. If a bin has >2000 counts, and if more than 50% of those come from <1% of pixels, then it is considered to be noise-dominated and hence unusable.
| Quadrant | # 1 sec bins | Bins with >0 counts | Bins with >2000 counts | High rate bins dominated by noise | Noise dominated (total time) | Noise dominated (detector-on time) | Marked lightcurve |
|---|---|---|---|---|---|---|---|
| A | 7611 | 6657 | 11 | 11 | 0.14% | 0.17% | 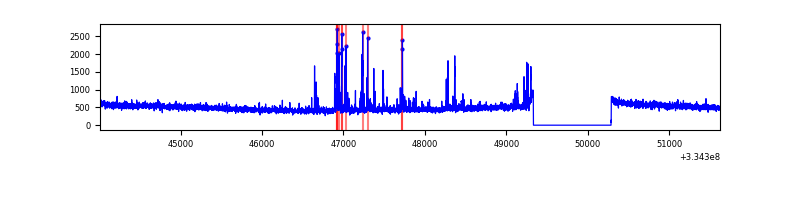 |
| B | 7611 | 6657 | 3 | 3 | 0.04% | 0.05% | 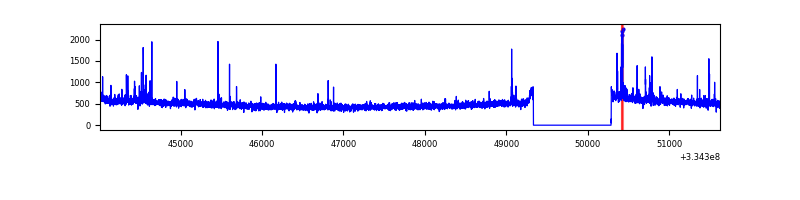 |
| C | 7611 | 6657 | 3 | 3 | 0.04% | 0.05% | 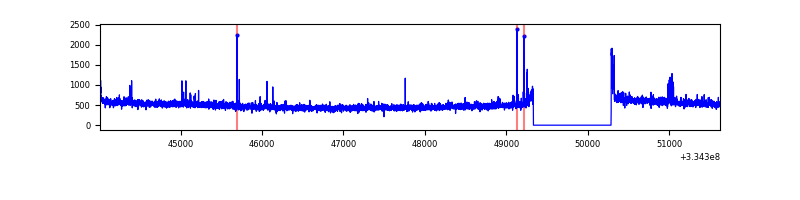 |
| D | 7611 | 6657 | 199 | 199 | 2.61% | 2.99% | 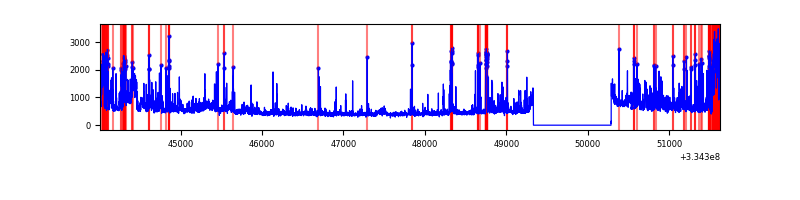 |
Top three noisy pixels from each quadrant. If the there are fewer than three noisy pixels in the level2.evt file, extra rows are filled as -1
| Pixel properties | Quadrant properties | ||||||
|---|---|---|---|---|---|---|---|
| Quadrant | DetID | PixID | Counts | Sigma | Mean | Median | Sigma |
| A | 0 | 13 | 170981 | 1013.28 | 833 | 815 | 167.9 |
| A | 13 | 254 | 11925 | 66.16 | 833 | 815 | 167.9 |
| A | 3 | 137 | 7574 | 40.25 | 833 | 815 | 167.9 |
| B | 5 | 172 | 68380 | 426.06 | 832 | 811 | 158.6 |
| B | 12 | 111 | 18654 | 112.51 | 832 | 811 | 158.6 |
| B | 11 | 111 | 16309 | 97.72 | 832 | 811 | 158.6 |
| C | 14 | 238 | 127188 | 668.51 | 804 | 809 | 189.0 |
| C | 2 | 16 | 65934 | 344.49 | 804 | 809 | 189.0 |
| C | 3 | 233 | 45573 | 236.79 | 804 | 809 | 189.0 |
| D | 1 | 52 | 1316916 | 6902.1 | 799 | 780 | 190.7 |
| D | 12 | 233 | 78672 | 408.48 | 799 | 780 | 190.7 |
| D | 8 | 195 | 49552 | 255.77 | 799 | 780 | 190.7 |
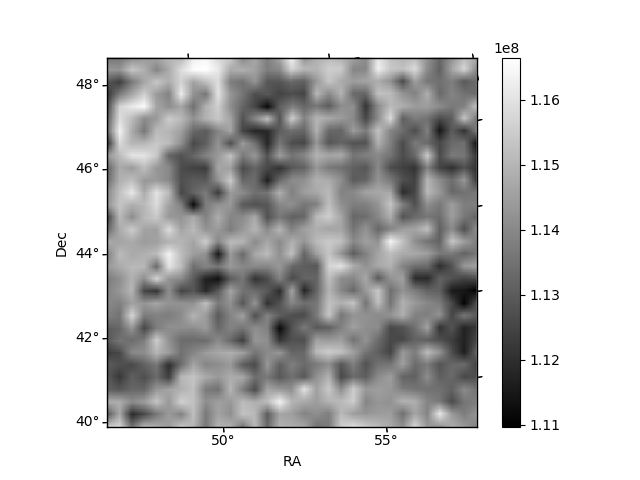
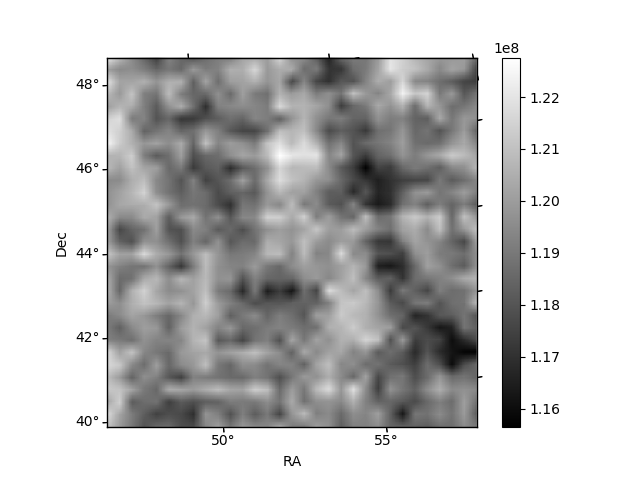
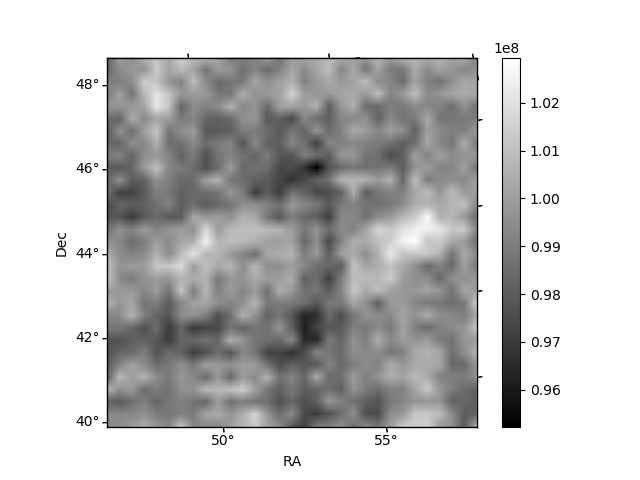
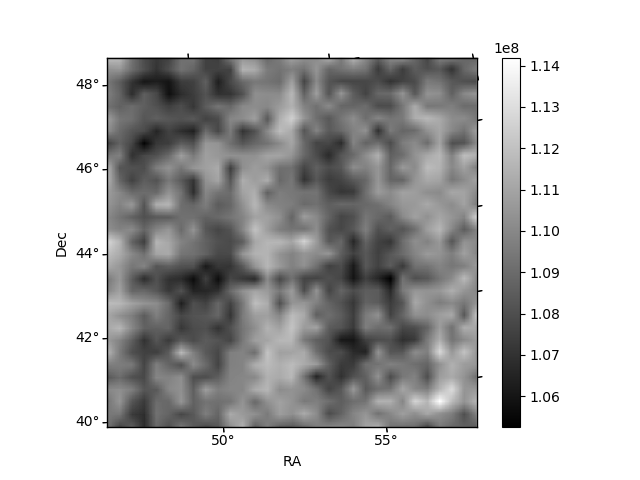
Histogram calculated using DETX and DETY for each event in the final _common_clean file
| Quadrant A |  |
 |
Quadrant B |
|---|---|---|---|
| Quadrant D |  |
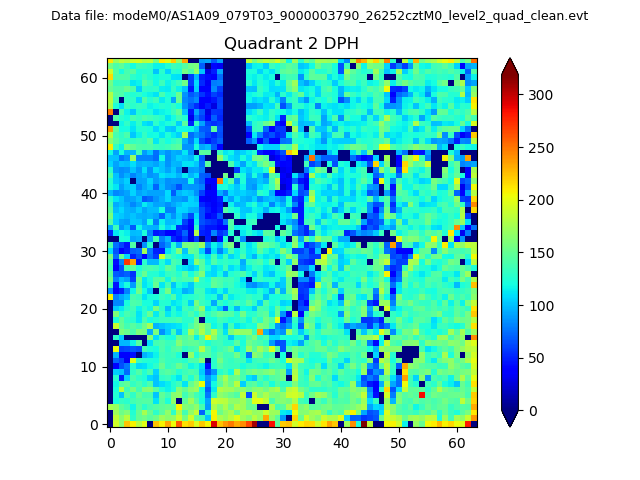 |
Quadrant C |
| Plot type | Count rate plots | Images |
|---|---|---|
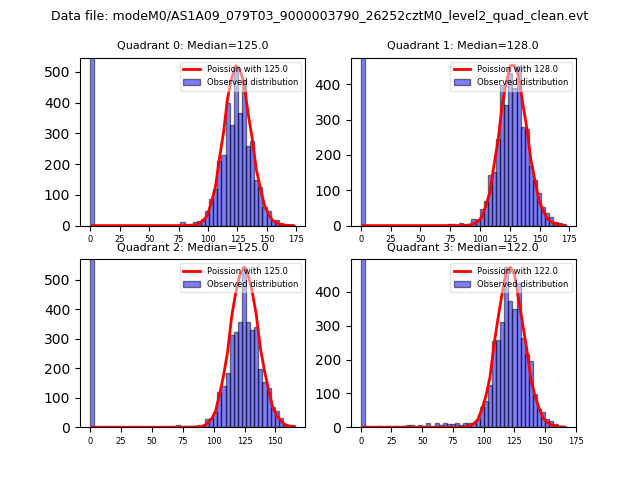
| Comparison with Poisson distribution Blue bars denote a histogram of data divided into 1 sec bins. Red curve is a Poisson curve with rate = median count rate of data. |
 |
 |
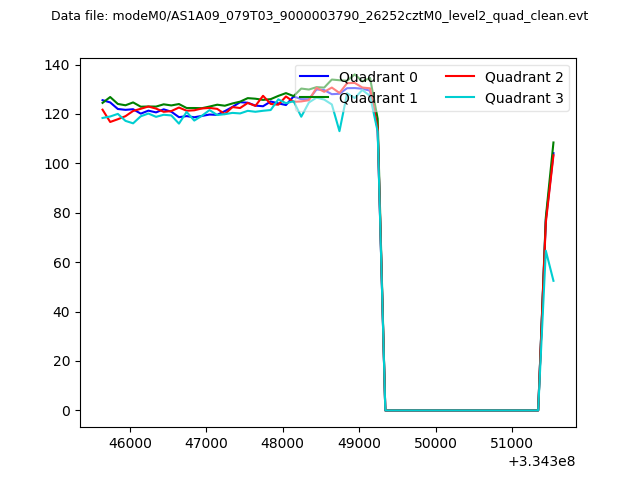
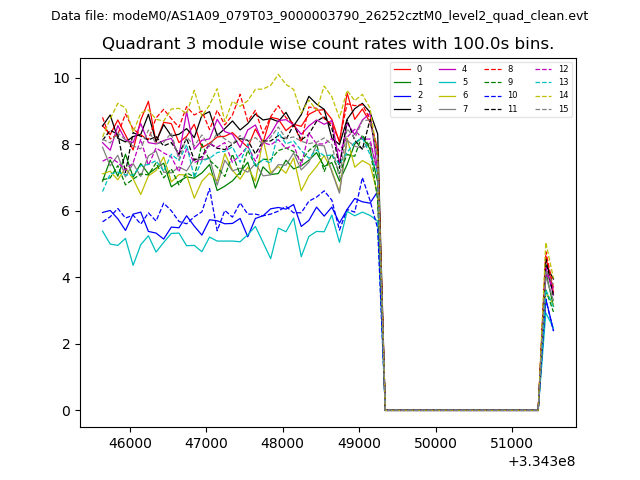
| Quadrant-wise count rates Data is divided into 100 sec bins |
 |
|
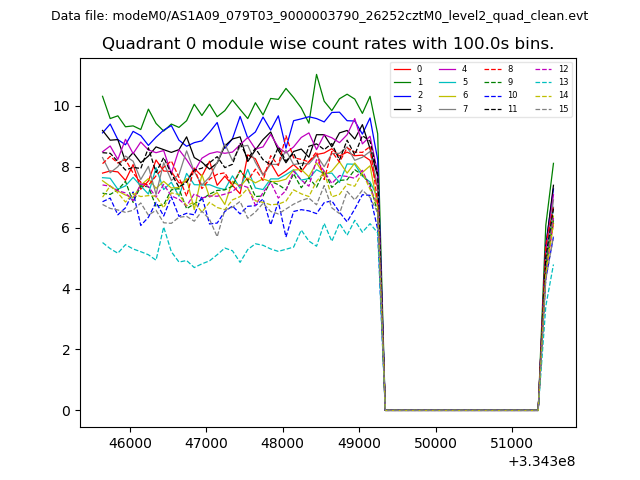
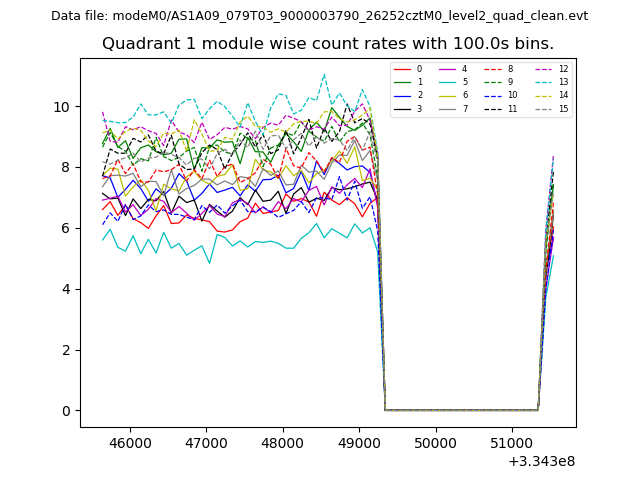
| Module-wise count rates for Quadrant A Data is divided into 100 sec bins |
 |
 |
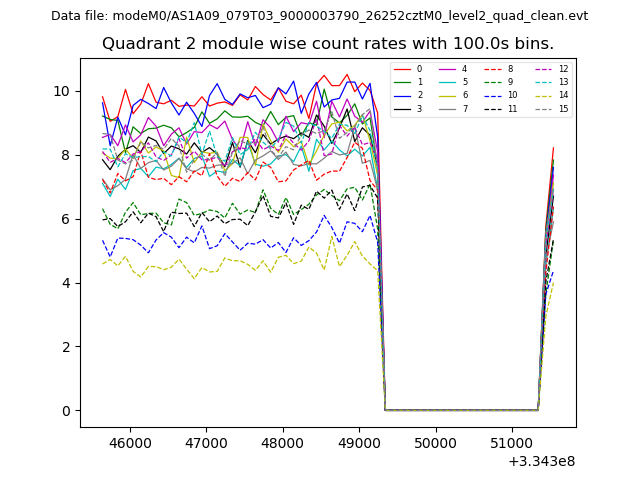
| Module-wise count rates for Quadrant B Data is divided into 100 sec bins |
 |
 |
| Module-wise count rates for Quadrant C Data is divided into 100 sec bins |
 |
 |
| Module-wise count rates for Quadrant D Data is divided into 100 sec bins |
 |
 |
| Parameter | Plot |
|---|---|
| CZT HV Monitor | 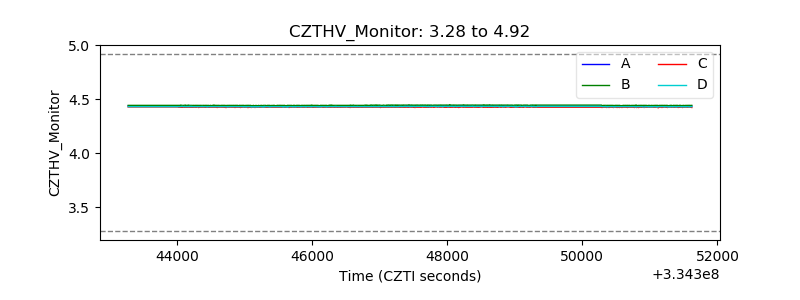 |
| D_VDD | 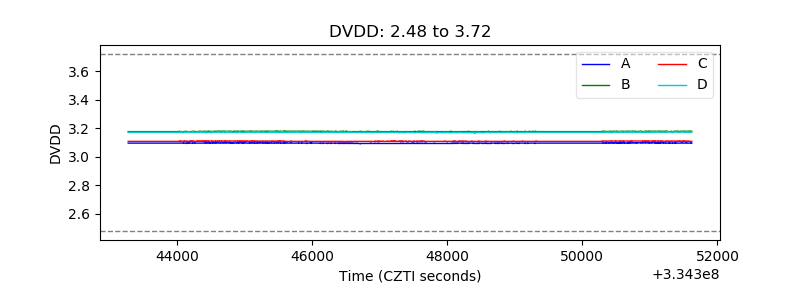 |
| Temperature 1 | 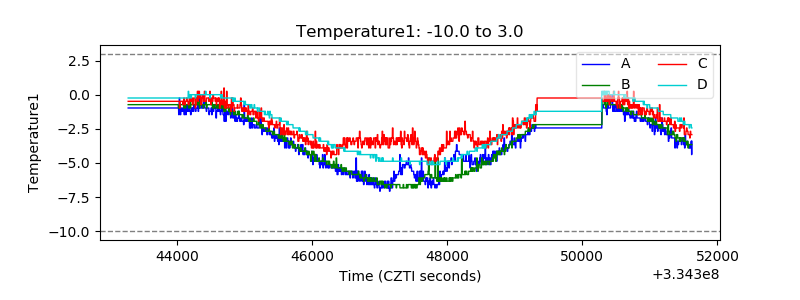 |
| Veto HV Monitor | 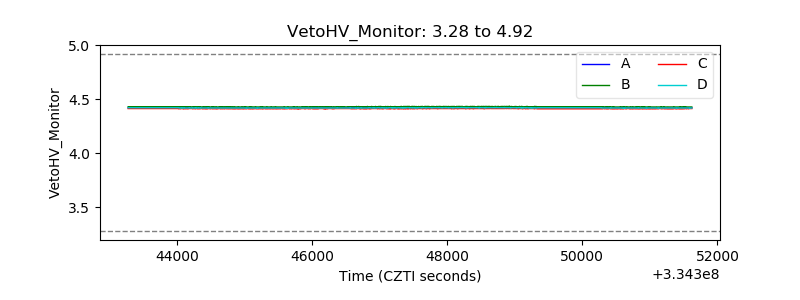 |
| Veto LLD |  |
| Alpha Counter | 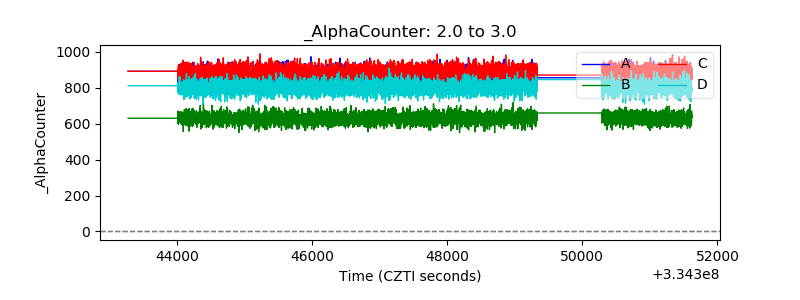 |
| _CPM_Rate | 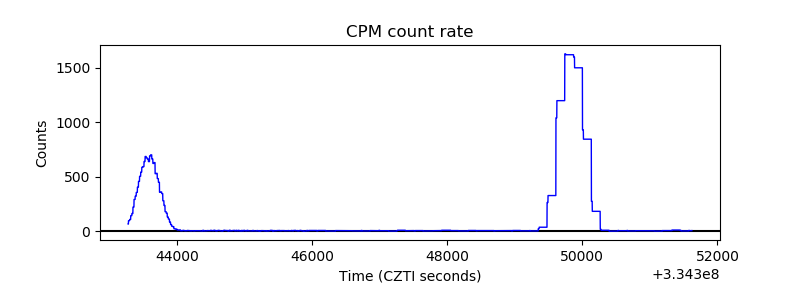 |
| CZT Counter | 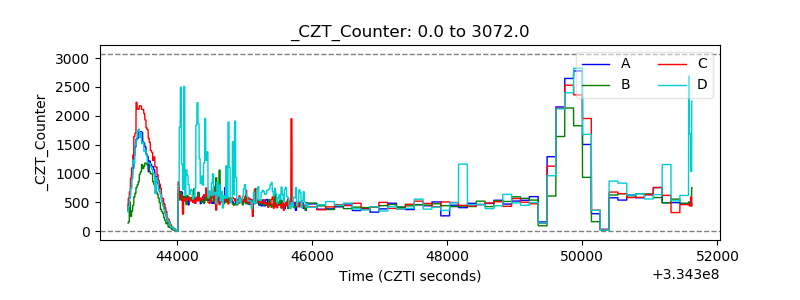 |
| +2.5 Volts monitor |  |
| +5 Volts monitor | 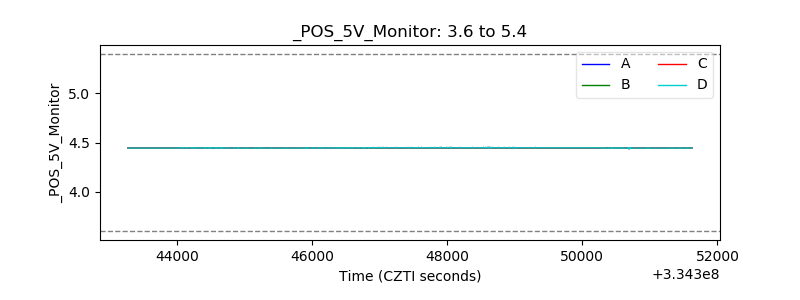 |
| _ROLL_ROT | 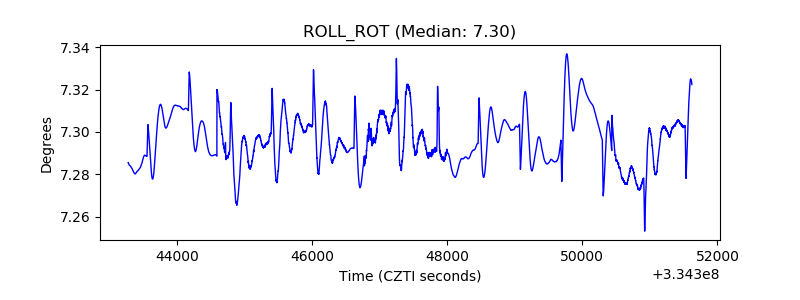 |
| _Roll_DEC | 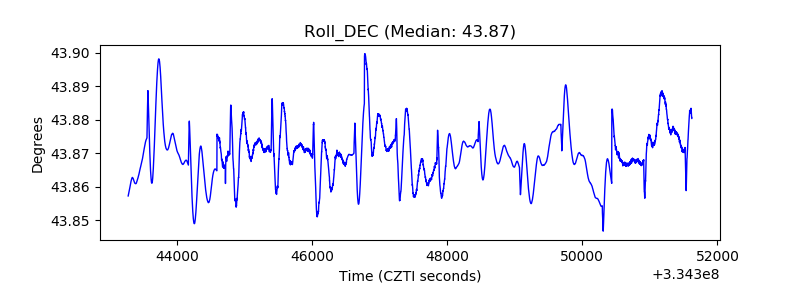 |
| _Roll_RA |  |
| Veto Counter | 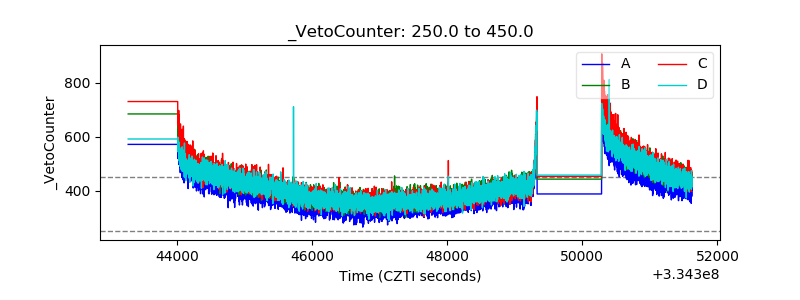 |