| Param | Original file | Final file |
|---|---|---|
| Filename | modeM0/AS1A09_079T03_9000003790_26255cztM0_level2.evt | modeM0/AS1A09_079T03_9000003790_26255cztM0_level2_quad_clean.evt |
| Size (bytes) | 574,868,160 | 97,588,800 |
| Size | 548.2 MB | 93.1 MB |
| Events in quadrant A | 3,663,383 | 635,984 |
| Events in quadrant B | 3,243,597 | 663,662 |
| Events in quadrant C | 5,623,034 | 606,454 |
| Events in quadrant D | 4,455,516 | 611,969 |
| Mode M0 | |||
|---|---|---|---|
| Quadrant | BADHDUFLAG | Total packets | Discarded packets |
| A | 0 | 15114 | 0 |
| B | 0 | 13787 | 0 |
| C | 0 | 21072 | 0 |
| D | 0 | 17610 | 0 |
| Mode M9 | |||
|---|---|---|---|
| Quadrant | BADHDUFLAG | Total packets | Discarded packets |
| A | 0 | 12 | 0 |
| B | 0 | 12 | 0 |
| C | 0 | 12 | 0 |
| D | 0 | 12 | 0 |
| Quadrant | Total seconds | Saturated seconds | Saturation percentage |
|---|---|---|---|
| A | 6258 | 137 | 2.189198% |
| B | 6259 | 58 | 0.926666% |
| C | 6259 | 934 | 14.922512% |
| D | 6259 | 337 | 5.384247% |
Noise dominated data is calculated using 1-second bins in cleaned event files. If a bin has >2000 counts, and if more than 50% of those come from <1% of pixels, then it is considered to be noise-dominated and hence unusable.
| Quadrant | # 1 sec bins | Bins with >0 counts | Bins with >2000 counts | High rate bins dominated by noise | Noise dominated (total time) | Noise dominated (detector-on time) | Marked lightcurve |
|---|---|---|---|---|---|---|---|
| A | 7463 | 6259 | 50 | 50 | 0.67% | 0.80% | 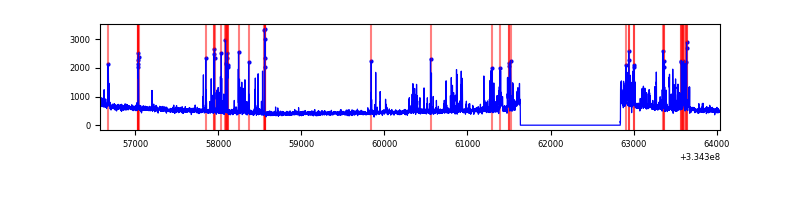 |
| B | 7463 | 6259 | 3 | 3 | 0.04% | 0.05% | 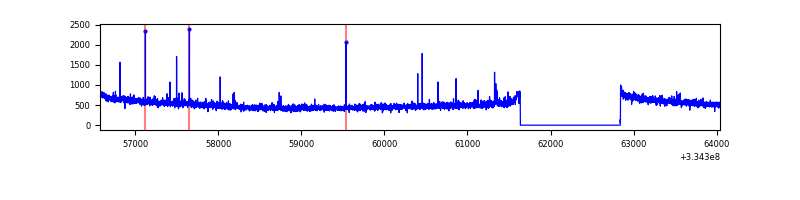 |
| C | 7463 | 6259 | 531 | 531 | 7.12% | 8.48% | 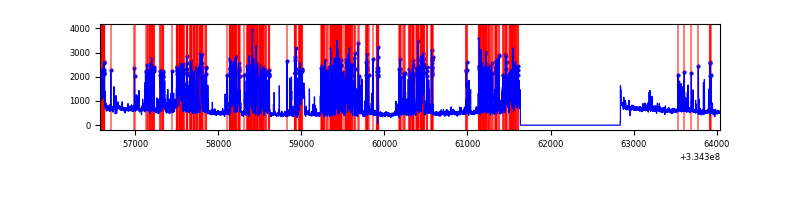 |
| D | 7463 | 6259 | 248 | 248 | 3.32% | 3.96% | 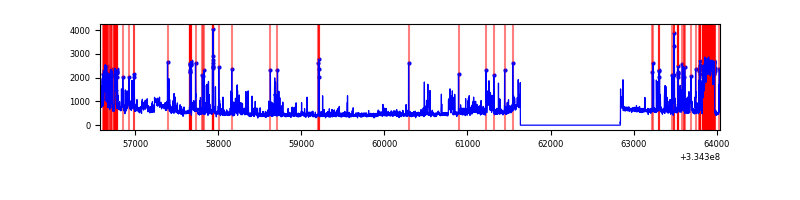 |
Top three noisy pixels from each quadrant. If the there are fewer than three noisy pixels in the level2.evt file, extra rows are filled as -1
| Pixel properties | Quadrant properties | ||||||
|---|---|---|---|---|---|---|---|
| Quadrant | DetID | PixID | Counts | Sigma | Mean | Median | Sigma |
| A | 0 | 13 | 535610 | 3272.49 | 811 | 795 | 163.4 |
| A | 13 | 254 | 11068 | 62.86 | 811 | 795 | 163.4 |
| A | 0 | 226 | 7108 | 38.63 | 811 | 795 | 163.4 |
| B | 12 | 111 | 17843 | 110.07 | 824 | 805 | 154.8 |
| B | 11 | 111 | 15456 | 94.65 | 824 | 805 | 154.8 |
| B | 5 | 172 | 13253 | 80.42 | 824 | 805 | 154.8 |
| C | 4 | 254 | 2395631 | 13606.04 | 759 | 764 | 176.0 |
| C | 14 | 238 | 120663 | 681.19 | 759 | 764 | 176.0 |
| C | 2 | 16 | 74864 | 420.99 | 759 | 764 | 176.0 |
| D | 1 | 52 | 1055905 | 5617.32 | 786 | 768 | 187.8 |
| D | 15 | 0 | 333602 | 1771.94 | 786 | 768 | 187.8 |
| D | 2 | 153 | 37565 | 195.9 | 786 | 768 | 187.8 |
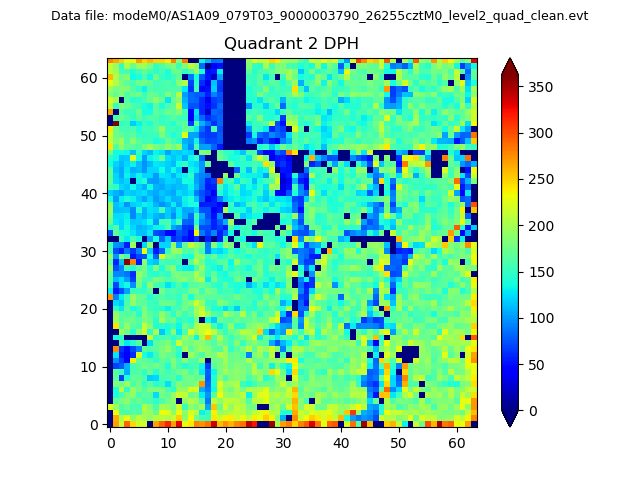
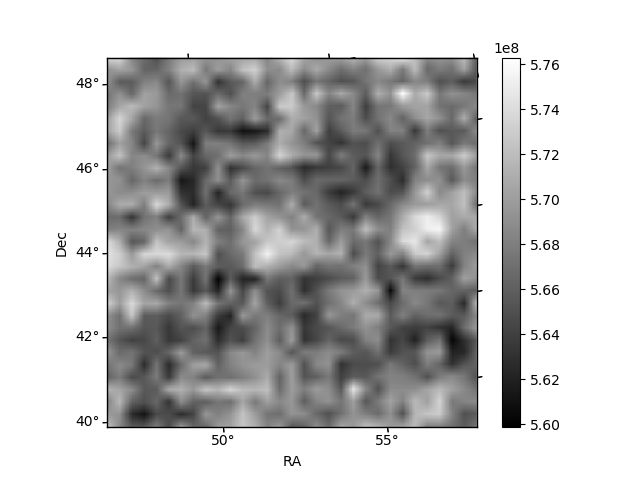
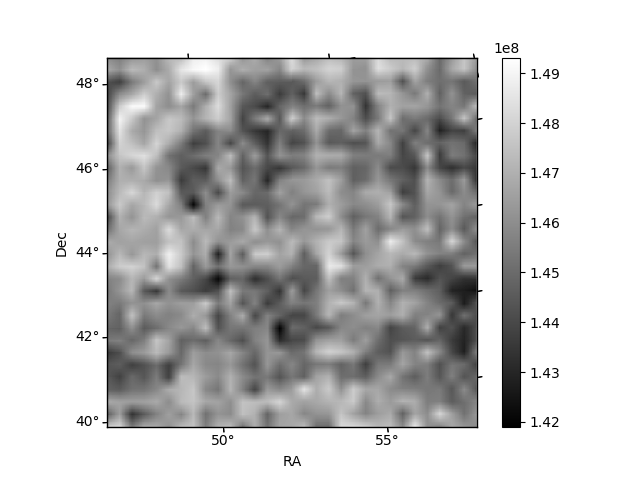
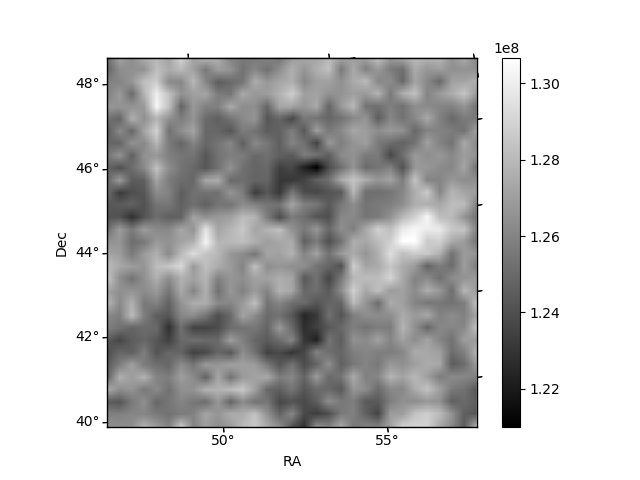
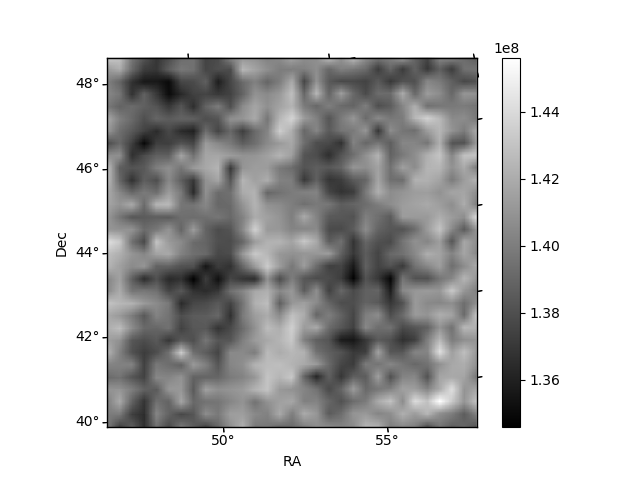
Histogram calculated using DETX and DETY for each event in the final _common_clean file
| Quadrant A | 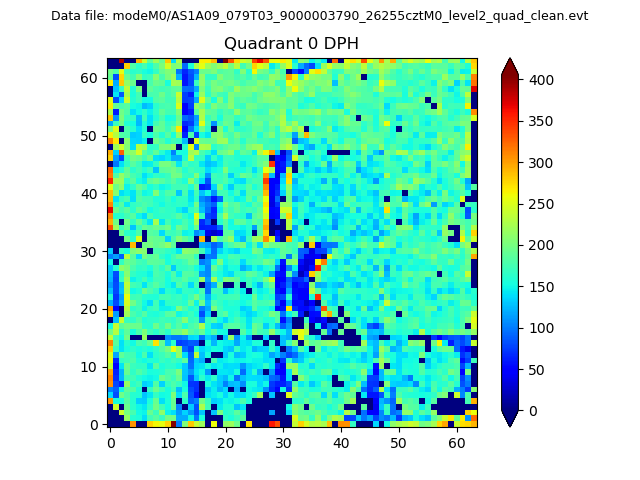 |
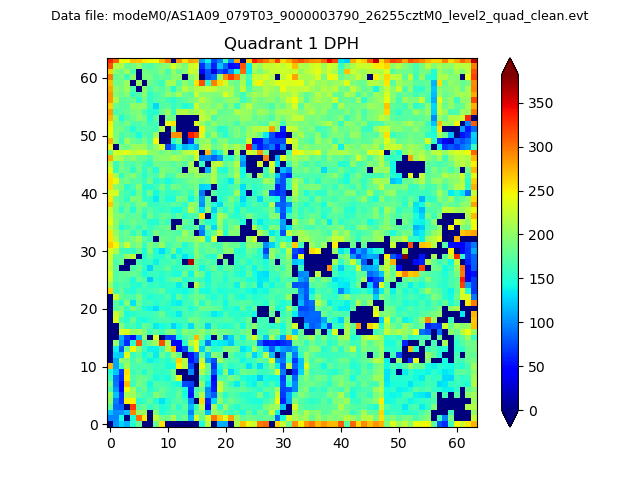 |
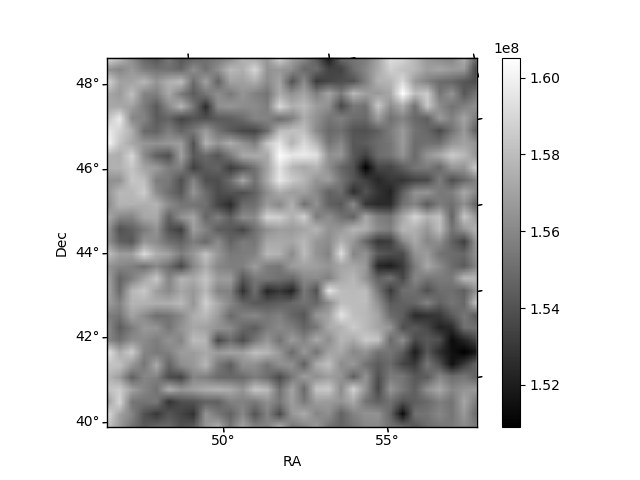
Quadrant B |
|---|---|---|---|
| Quadrant D | 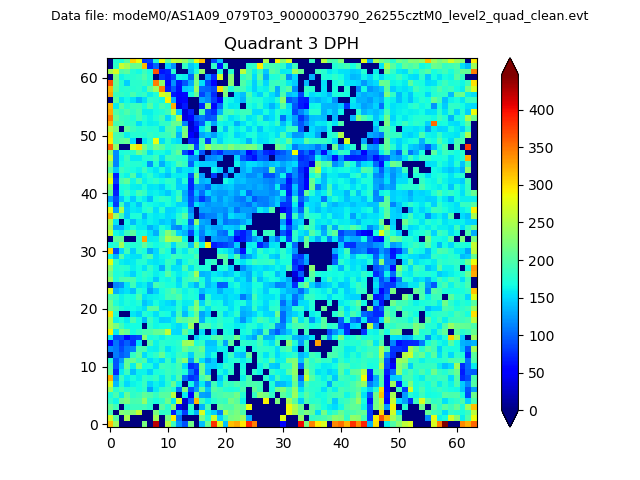 |
 |
Quadrant C |
| Plot type | Count rate plots | Images |
|---|---|---|
| Comparison with Poisson distribution Blue bars denote a histogram of data divided into 1 sec bins. Red curve is a Poisson curve with rate = median count rate of data. |
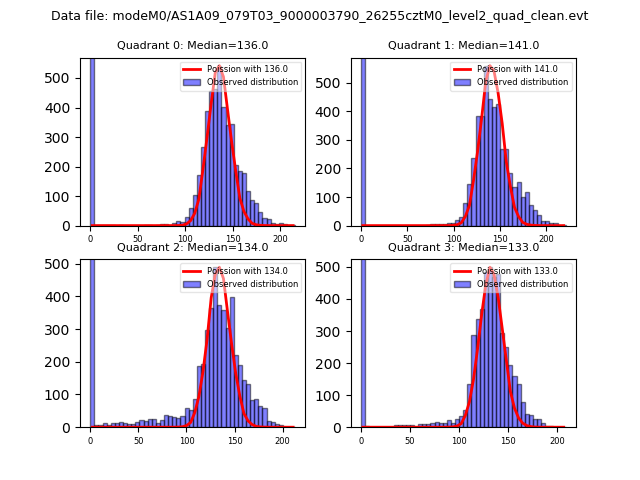 |
 |
| Quadrant-wise count rates Data is divided into 100 sec bins |
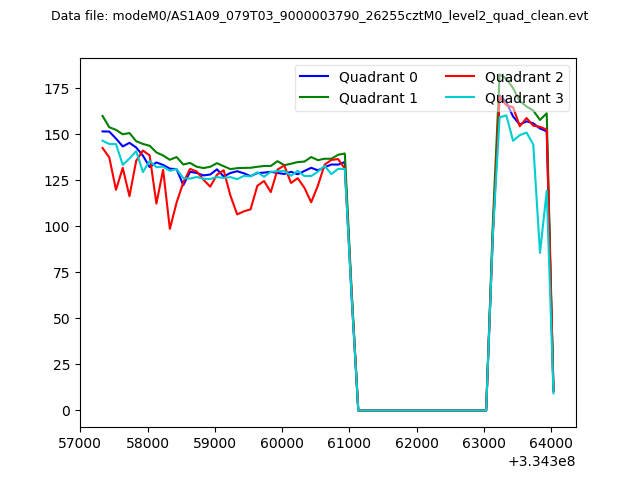 |
|
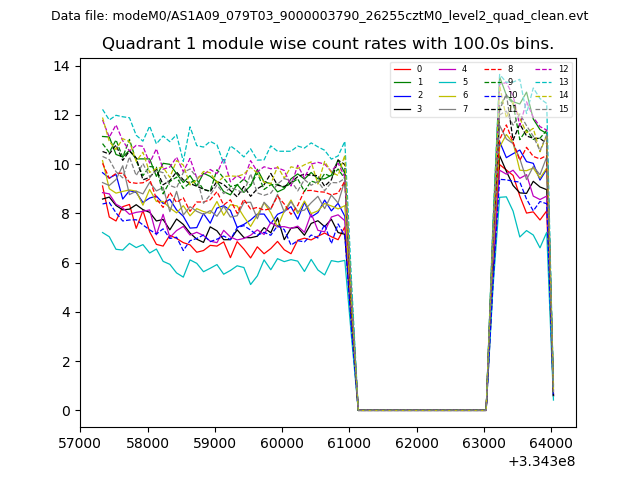
| Module-wise count rates for Quadrant A Data is divided into 100 sec bins |
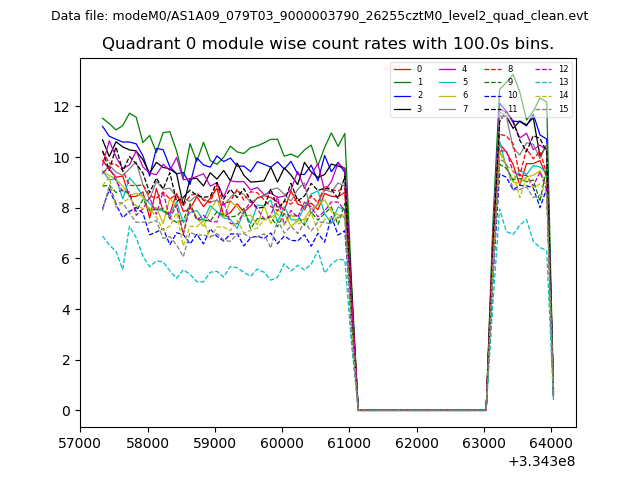 |
 |
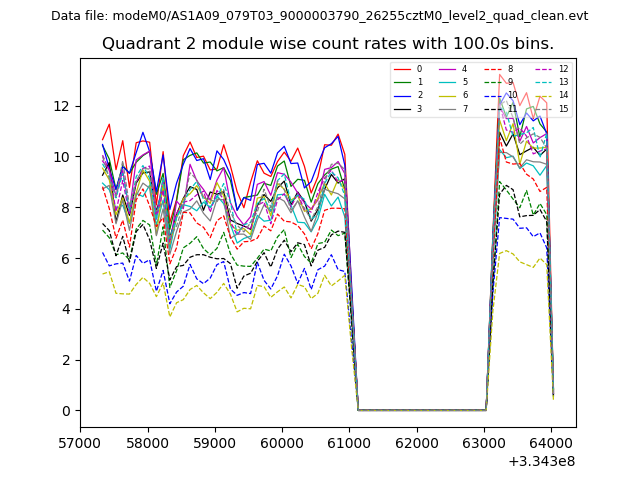
| Module-wise count rates for Quadrant B Data is divided into 100 sec bins |
 |
 |
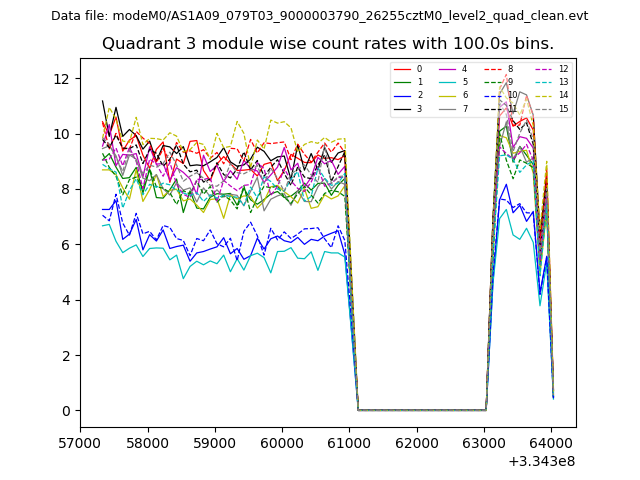
| Module-wise count rates for Quadrant C Data is divided into 100 sec bins |
 |
 |
| Module-wise count rates for Quadrant D Data is divided into 100 sec bins |
 |
 |
| Parameter | Plot |
|---|---|
| CZT HV Monitor | 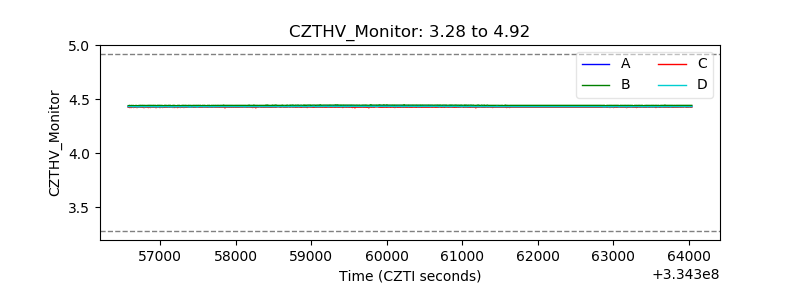 |
| D_VDD | 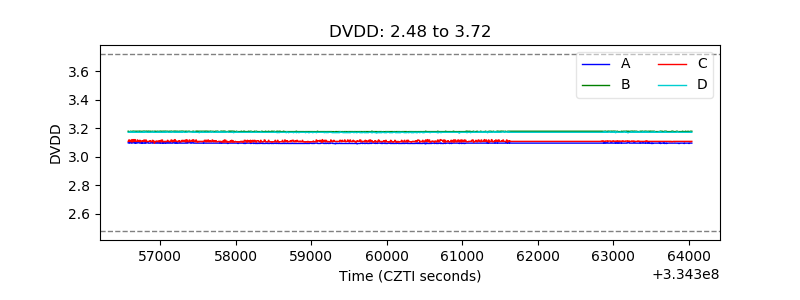 |
| Temperature 1 | 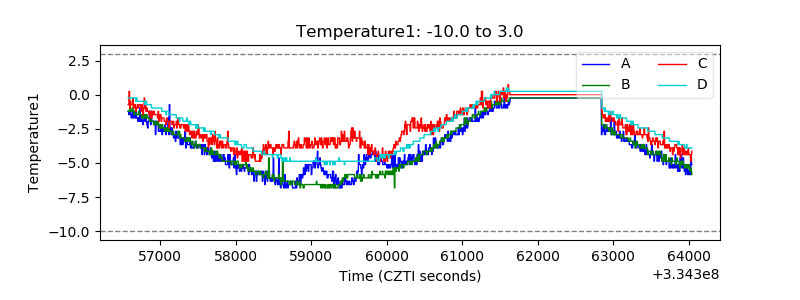 |
| Veto HV Monitor | 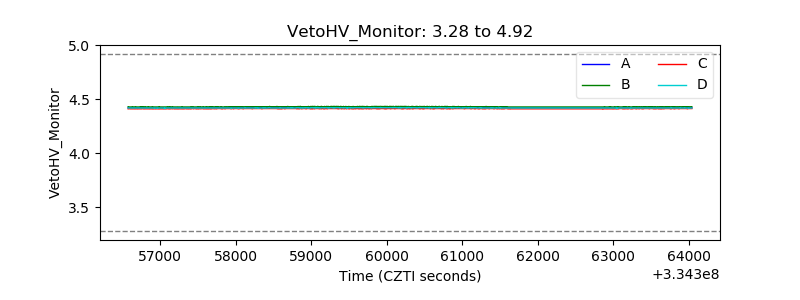 |
| Veto LLD | 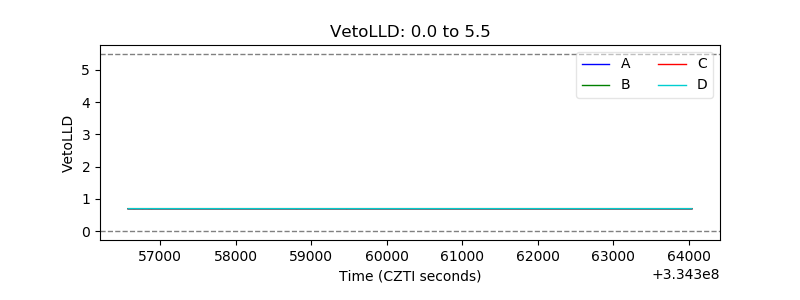 |
| Alpha Counter | 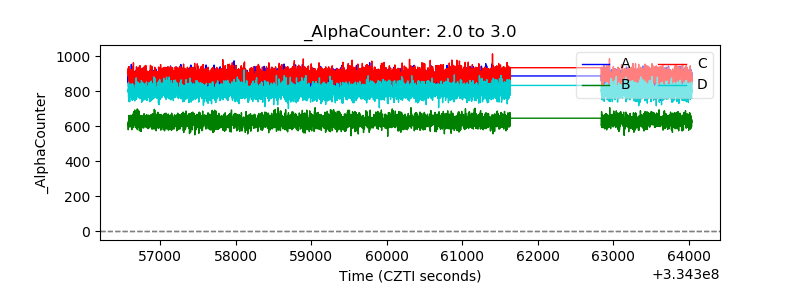 |
| _CPM_Rate | 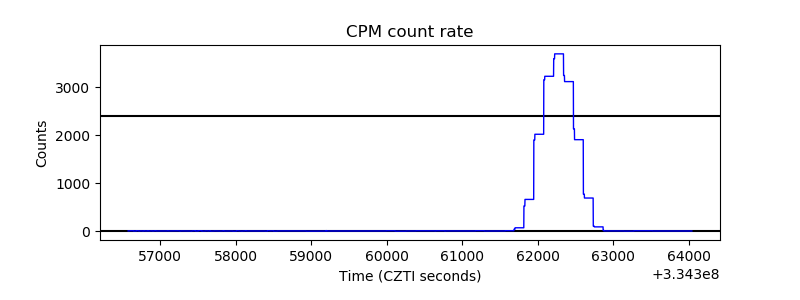 |
| CZT Counter | 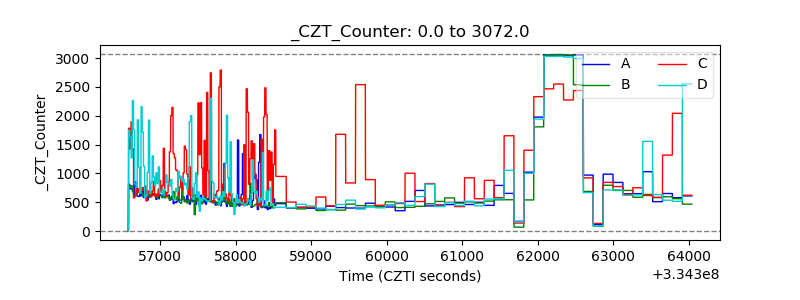 |
| +2.5 Volts monitor | 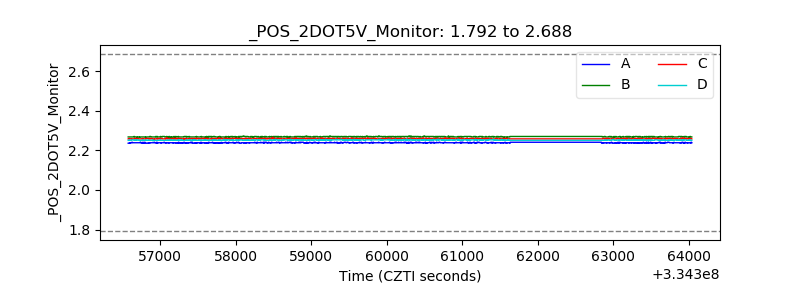 |
| +5 Volts monitor | 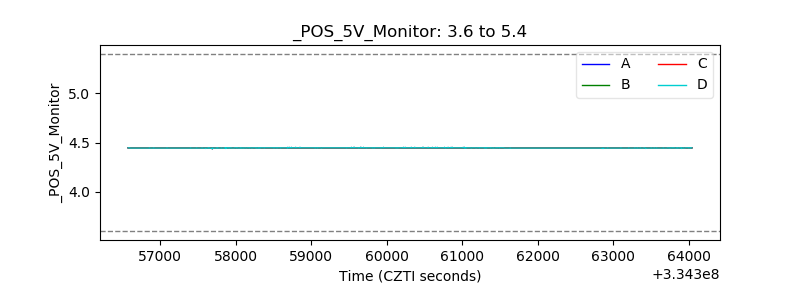 |
| _ROLL_ROT | 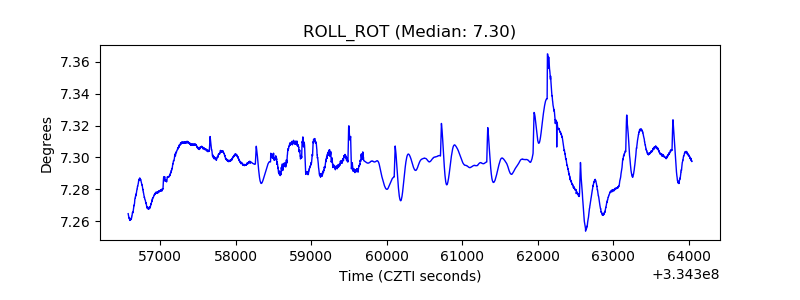 |
| _Roll_DEC | 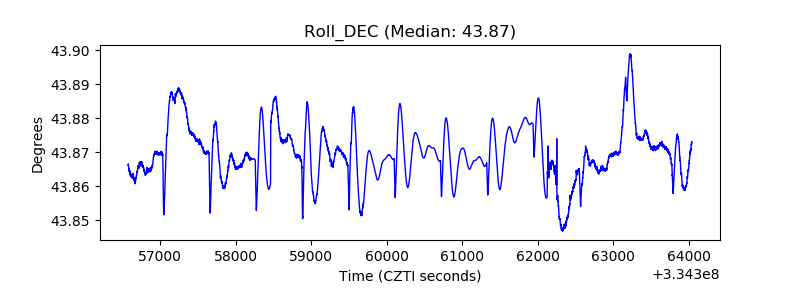 |
| _Roll_RA | 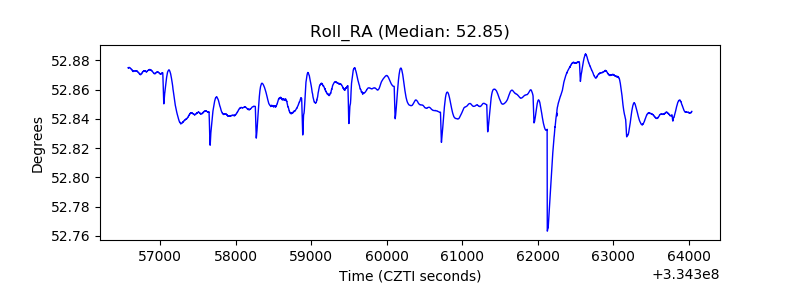 |
| Veto Counter | 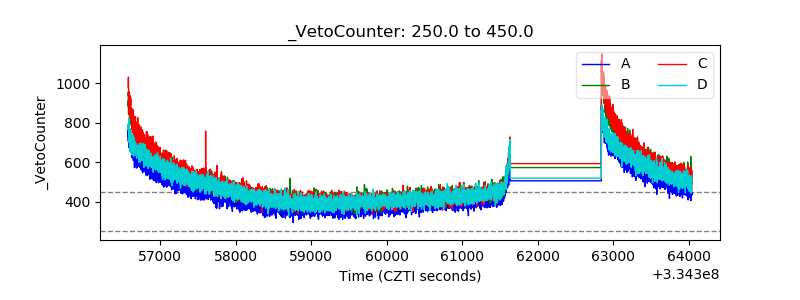 |