| Param | Original file | Final file |
|---|---|---|
| Filename | modeM0/AS1A09_079T03_9000003790_26256cztM0_level2.evt | modeM0/AS1A09_079T03_9000003790_26256cztM0_level2_quad_clean.evt |
| Size (bytes) | 518,814,720 | 112,507,200 |
| Size | 494.8 MB | 107.3 MB |
| Events in quadrant A | 3,896,598 | 736,200 |
| Events in quadrant B | 3,299,866 | 779,513 |
| Events in quadrant C | 3,993,816 | 748,050 |
| Events in quadrant D | 4,099,535 | 708,784 |
| Mode M0 | |||
|---|---|---|---|
| Quadrant | BADHDUFLAG | Total packets | Discarded packets |
| A | 0 | 15603 | 0 |
| B | 0 | 13775 | 0 |
| C | 0 | 15996 | 0 |
| D | 0 | 16410 | 0 |
| Mode M9 | |||
|---|---|---|---|
| Quadrant | BADHDUFLAG | Total packets | Discarded packets |
| A | 0 | 19 | 0 |
| B | 0 | 20 | 0 |
| C | 0 | 20 | 0 |
| D | 0 | 20 | 0 |
| Quadrant | Total seconds | Saturated seconds | Saturation percentage |
|---|---|---|---|
| A | 6234 | 158 | 2.534488% |
| B | 6233 | 58 | 0.930531% |
| C | 6233 | 304 | 4.877266% |
| D | 6233 | 273 | 4.379913% |
Noise dominated data is calculated using 1-second bins in cleaned event files. If a bin has >2000 counts, and if more than 50% of those come from <1% of pixels, then it is considered to be noise-dominated and hence unusable.
| Quadrant | # 1 sec bins | Bins with >0 counts | Bins with >2000 counts | High rate bins dominated by noise | Noise dominated (total time) | Noise dominated (detector-on time) | Marked lightcurve |
|---|---|---|---|---|---|---|---|
| A | 7529 | 6235 | 76 | 76 | 1.01% | 1.22% | 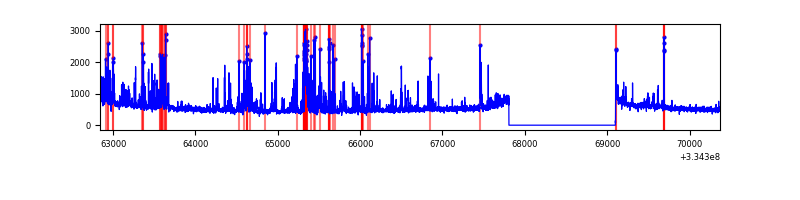 |
| B | 7528 | 6234 | 3 | 3 | 0.04% | 0.05% |  |
| C | 7528 | 6234 | 124 | 124 | 1.65% | 1.99% | 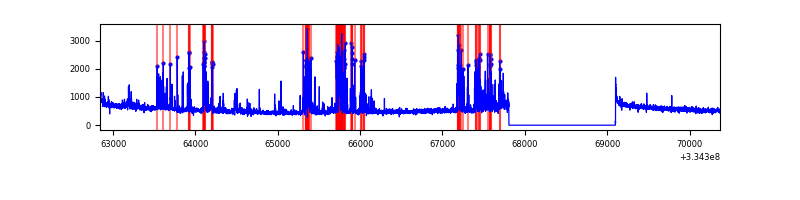 |
| D | 7528 | 6234 | 234 | 234 | 3.11% | 3.75% | 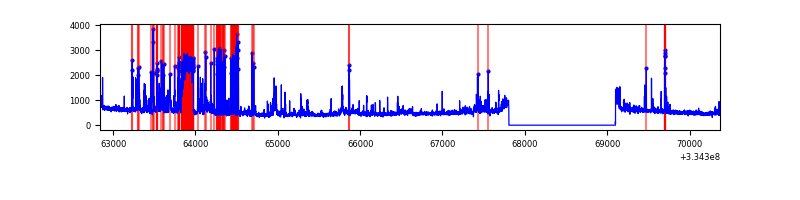 |
Top three noisy pixels from each quadrant. If the there are fewer than three noisy pixels in the level2.evt file, extra rows are filled as -1
| Pixel properties | Quadrant properties | ||||||
|---|---|---|---|---|---|---|---|
| Quadrant | DetID | PixID | Counts | Sigma | Mean | Median | Sigma |
| A | 0 | 13 | 747236 | 4582.77 | 815 | 801 | 162.9 |
| A | 13 | 254 | 11001 | 62.62 | 815 | 801 | 162.9 |
| A | 0 | 226 | 6989 | 37.99 | 815 | 801 | 162.9 |
| B | 5 | 172 | 24417 | 152.7 | 834 | 816 | 154.6 |
| B | 12 | 111 | 17605 | 108.63 | 834 | 816 | 154.6 |
| B | 0 | 230 | 16004 | 98.27 | 834 | 816 | 154.6 |
| C | 4 | 254 | 682691 | 3688.45 | 801 | 808 | 184.9 |
| C | 14 | 238 | 130234 | 700.09 | 801 | 808 | 184.9 |
| C | 3 | 233 | 30801 | 162.24 | 801 | 808 | 184.9 |
| D | 1 | 52 | 690343 | 3644.54 | 792 | 773 | 189.2 |
| D | 15 | 0 | 320530 | 1689.99 | 792 | 773 | 189.2 |
| D | 12 | 233 | 46468 | 241.51 | 792 | 773 | 189.2 |
Histogram calculated using DETX and DETY for each event in the final _common_clean file
| Quadrant A |  |
 |
Quadrant B |
|---|---|---|---|
| Quadrant D |  |
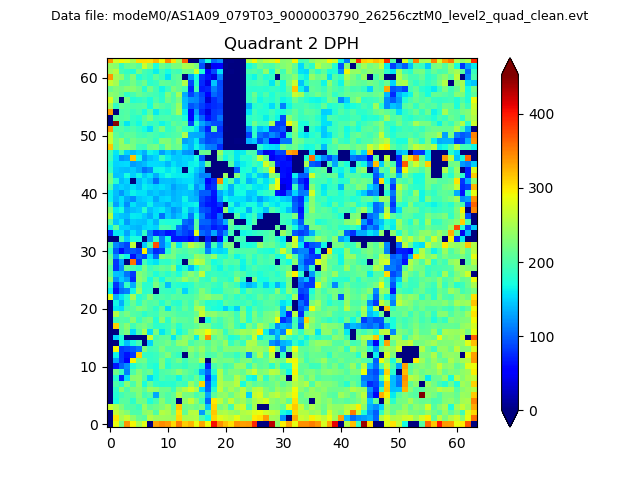 |
Quadrant C |
| Plot type | Count rate plots | Images |
|---|---|---|
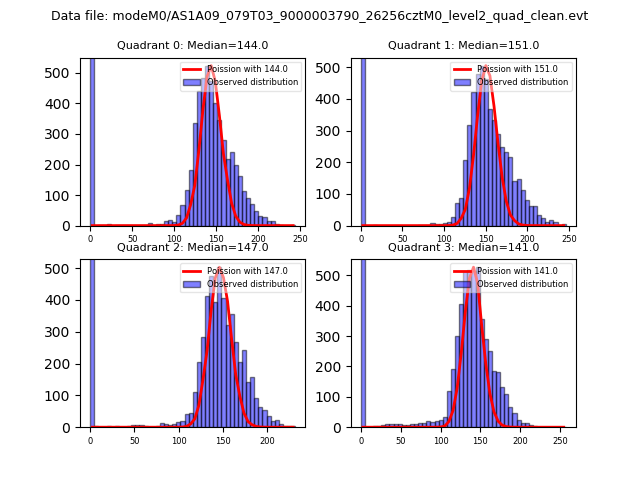
| Comparison with Poisson distribution Blue bars denote a histogram of data divided into 1 sec bins. Red curve is a Poisson curve with rate = median count rate of data. |
 |
 |
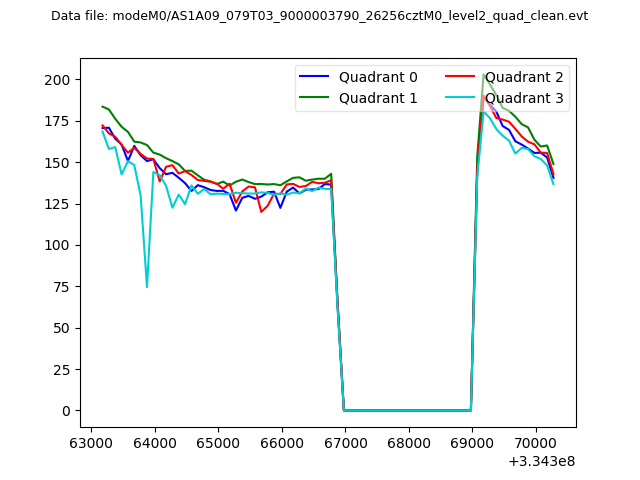
| Quadrant-wise count rates Data is divided into 100 sec bins |
 |
|
| Module-wise count rates for Quadrant A Data is divided into 100 sec bins |
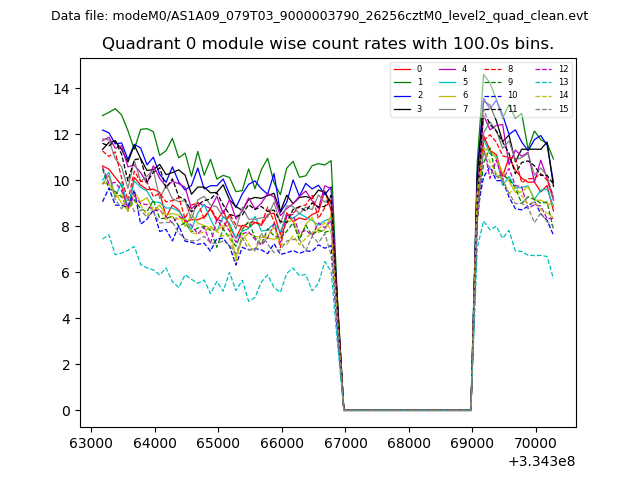 |
 |
| Module-wise count rates for Quadrant B Data is divided into 100 sec bins |
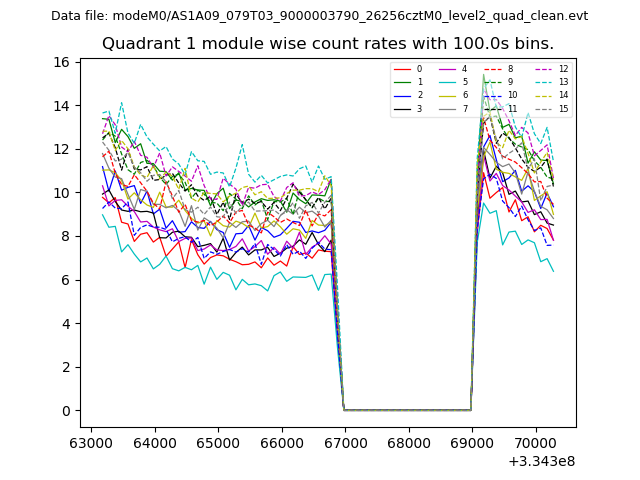 |
 |
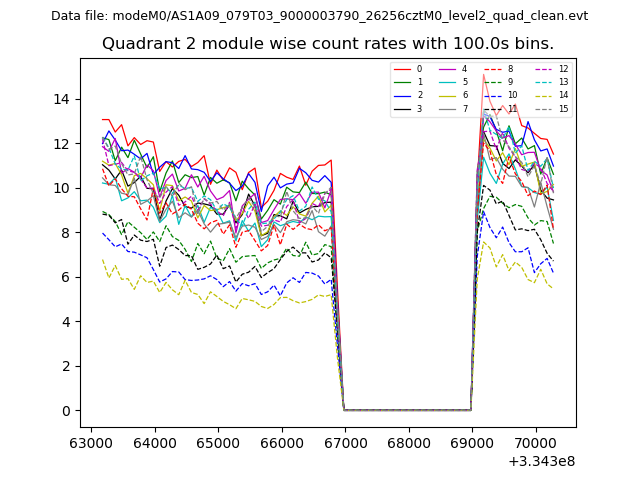
| Module-wise count rates for Quadrant C Data is divided into 100 sec bins |
 |
 |
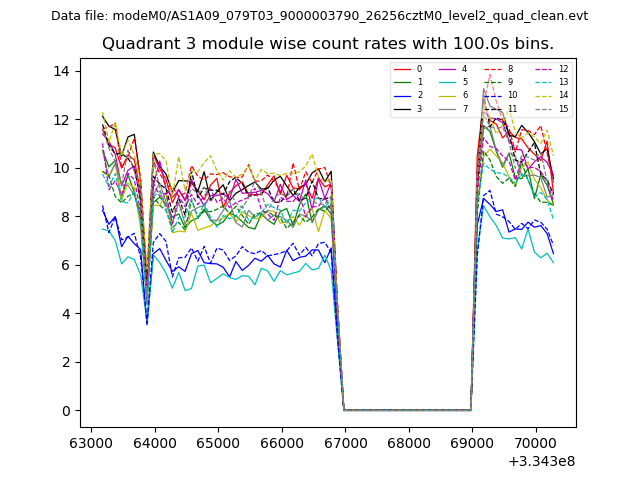
| Module-wise count rates for Quadrant D Data is divided into 100 sec bins |
 |
 |
| Parameter | Plot |
|---|---|
| CZT HV Monitor | 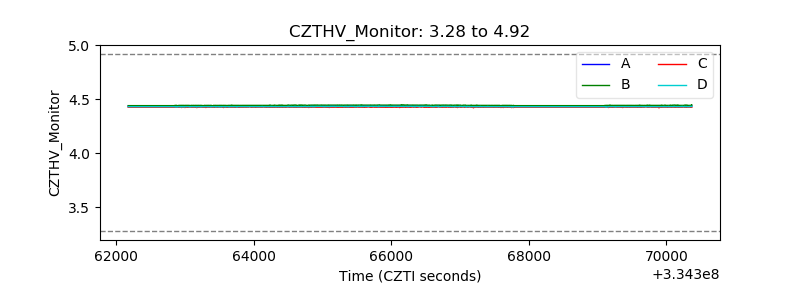 |
| D_VDD | 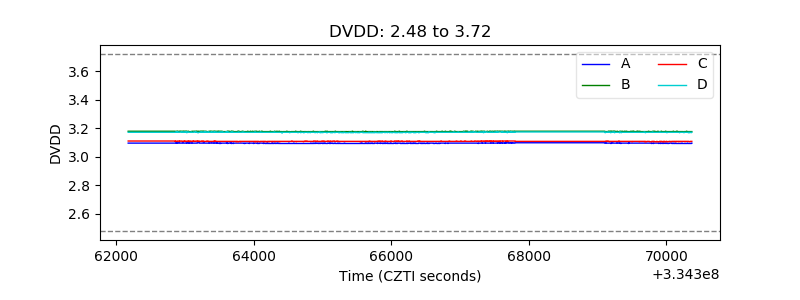 |
| Temperature 1 | 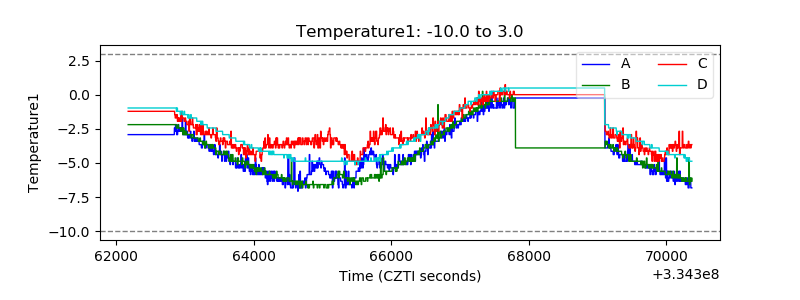 |
| Veto HV Monitor | 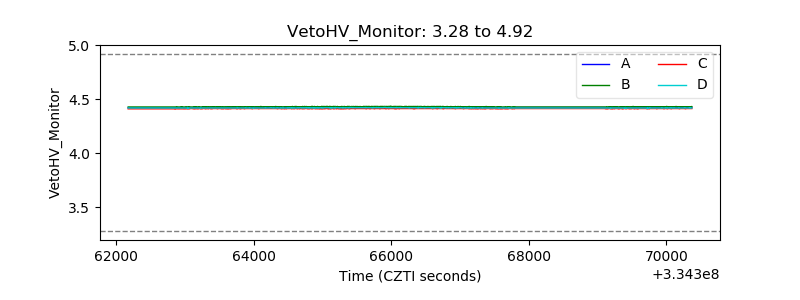 |
| Veto LLD |  |
| Alpha Counter | 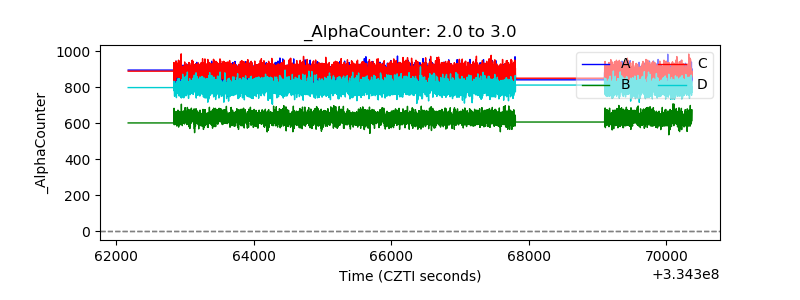 |
| _CPM_Rate | 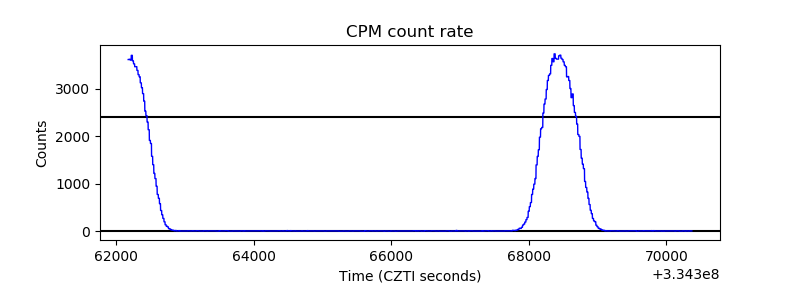 |
| CZT Counter | 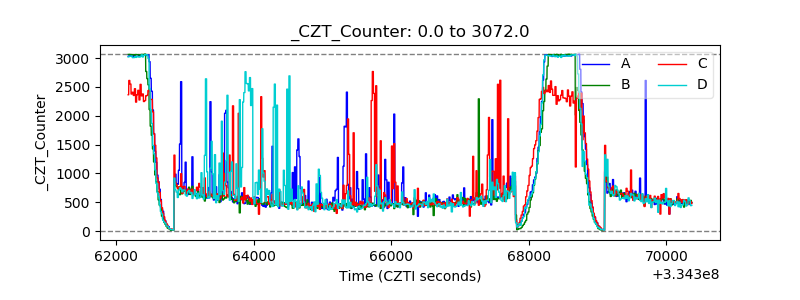 |
| +2.5 Volts monitor | 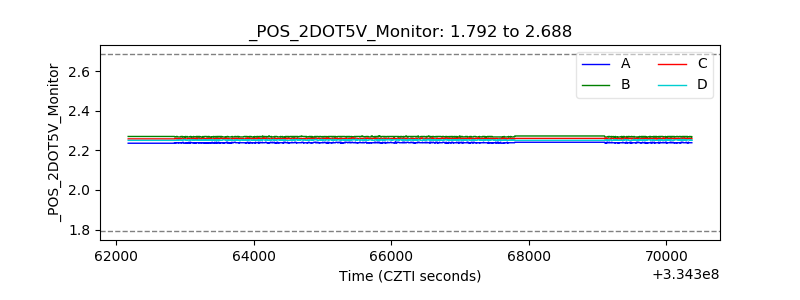 |
| +5 Volts monitor |  |
| _ROLL_ROT | 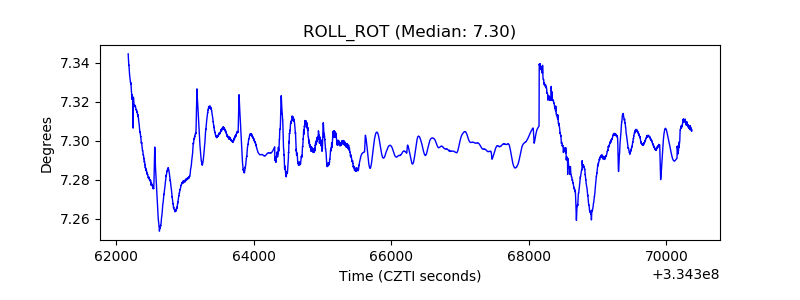 |
| _Roll_DEC | 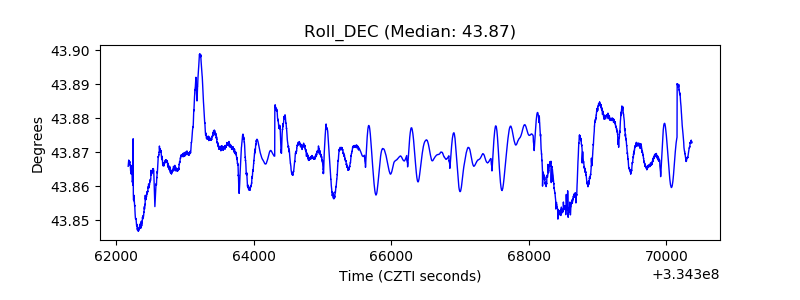 |
| _Roll_RA | 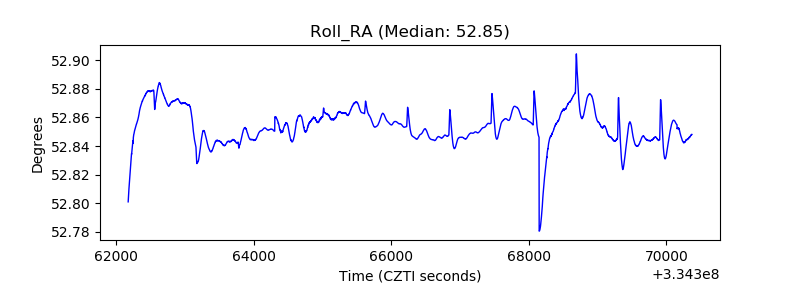 |
| Veto Counter |  |