| Param | Original file | Final file |
|---|---|---|
| Filename | modeM0/AS1A09_079T03_9000003790_26257cztM0_level2.evt | modeM0/AS1A09_079T03_9000003790_26257cztM0_level2_quad_clean.evt |
| Size (bytes) | 442,114,560 | 114,324,480 |
| Size | 421.6 MB | 109.0 MB |
| Events in quadrant A | 3,200,447 | 750,699 |
| Events in quadrant B | 3,239,293 | 790,344 |
| Events in quadrant C | 3,370,068 | 761,229 |
| Events in quadrant D | 3,162,523 | 731,678 |
| Mode M0 | |||
|---|---|---|---|
| Quadrant | BADHDUFLAG | Total packets | Discarded packets |
| A | 0 | 13359 | 0 |
| B | 0 | 13445 | 0 |
| C | 0 | 13936 | 0 |
| D | 0 | 13531 | 0 |
| Mode M9 | |||
|---|---|---|---|
| Quadrant | BADHDUFLAG | Total packets | Discarded packets |
| A | 0 | 16 | 0 |
| B | 0 | 17 | 0 |
| C | 0 | 17 | 0 |
| D | 0 | 17 | 0 |
| Quadrant | Total seconds | Saturated seconds | Saturation percentage |
|---|---|---|---|
| A | 6144 | 24 | 0.390625% |
| B | 6144 | 35 | 0.569661% |
| C | 6144 | 92 | 1.497396% |
| D | 6143 | 23 | 0.374410% |
Noise dominated data is calculated using 1-second bins in cleaned event files. If a bin has >2000 counts, and if more than 50% of those come from <1% of pixels, then it is considered to be noise-dominated and hence unusable.
| Quadrant | # 1 sec bins | Bins with >0 counts | Bins with >2000 counts | High rate bins dominated by noise | Noise dominated (total time) | Noise dominated (detector-on time) | Marked lightcurve |
|---|---|---|---|---|---|---|---|
| A | 7514 | 6145 | 7 | 7 | 0.09% | 0.11% | 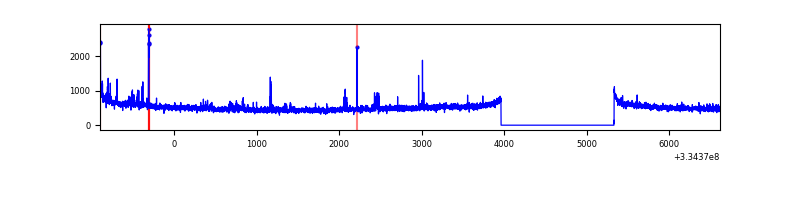 |
| B | 7514 | 6145 | 1 | 1 | 0.01% | 0.02% | 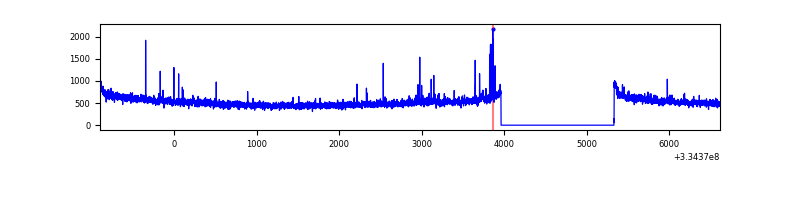 |
| C | 7514 | 6145 | 13 | 13 | 0.17% | 0.21% | 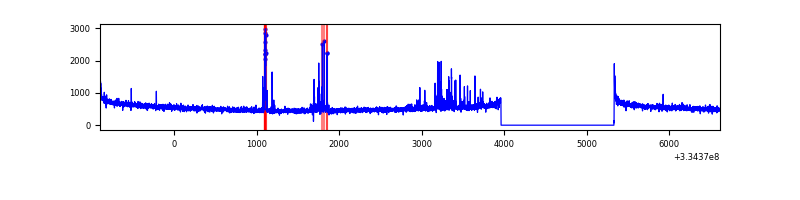 |
| D | 7513 | 6144 | 11 | 11 | 0.15% | 0.18% | 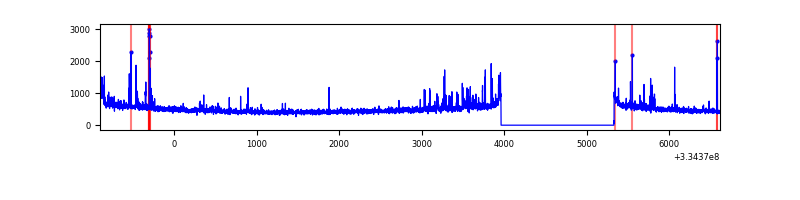 |
Top three noisy pixels from each quadrant. If the there are fewer than three noisy pixels in the level2.evt file, extra rows are filled as -1
| Pixel properties | Quadrant properties | ||||||
|---|---|---|---|---|---|---|---|
| Quadrant | DetID | PixID | Counts | Sigma | Mean | Median | Sigma |
| A | 0 | 13 | 109384 | 680.67 | 801 | 788 | 159.5 |
| A | 13 | 254 | 10162 | 58.76 | 801 | 788 | 159.5 |
| A | 0 | 226 | 6875 | 38.15 | 801 | 788 | 159.5 |
| B | 5 | 172 | 30027 | 195.67 | 816 | 799 | 149.4 |
| B | 12 | 111 | 17278 | 110.32 | 816 | 799 | 149.4 |
| B | 11 | 111 | 15052 | 95.42 | 816 | 799 | 149.4 |
| C | 4 | 254 | 129945 | 705.07 | 790 | 798 | 183.2 |
| C | 14 | 238 | 129078 | 700.33 | 790 | 798 | 183.2 |
| C | 3 | 233 | 15766 | 81.72 | 790 | 798 | 183.2 |
| D | 1 | 52 | 68063 | 366.82 | 779 | 762 | 183.5 |
| D | 12 | 233 | 58947 | 317.13 | 779 | 762 | 183.5 |
| D | 15 | 0 | 40522 | 216.71 | 779 | 762 | 183.5 |
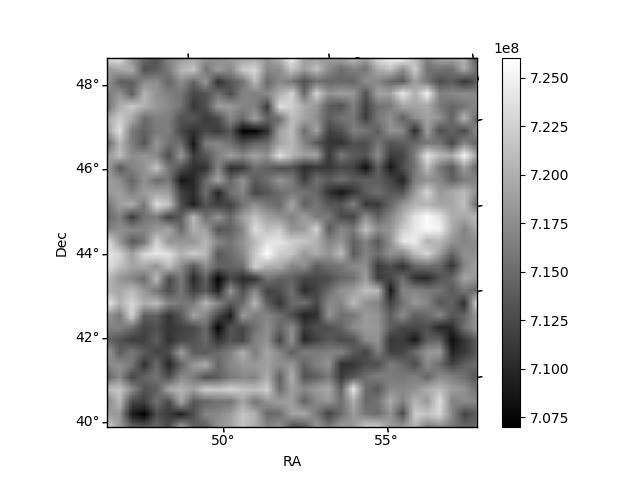
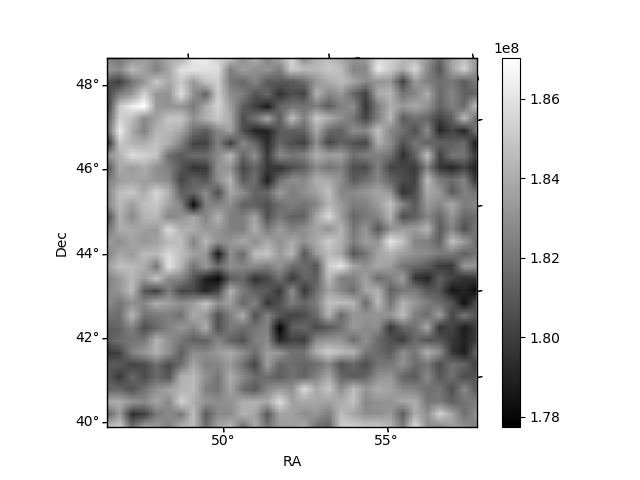
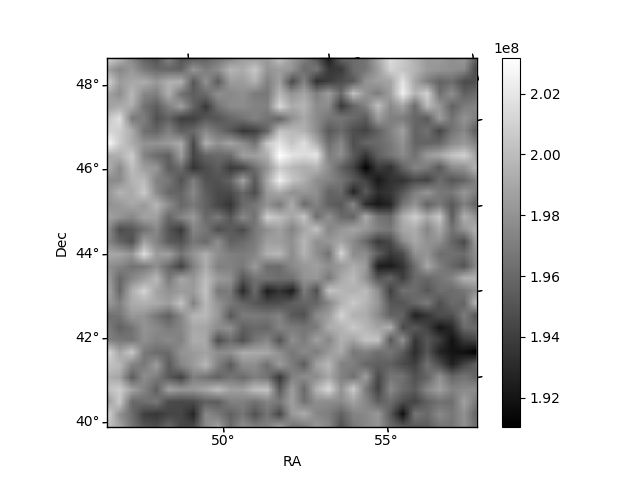
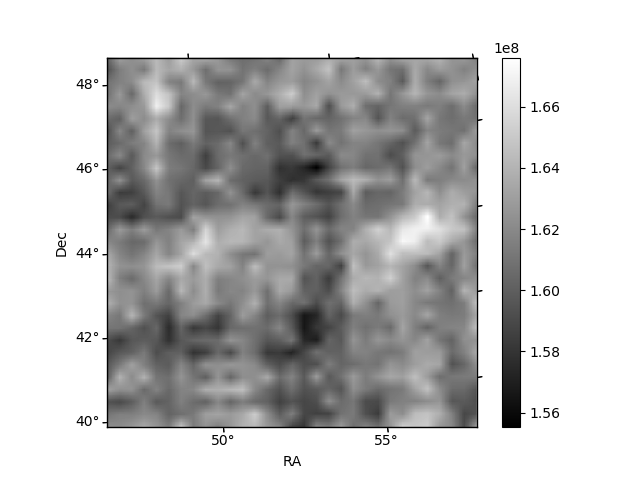
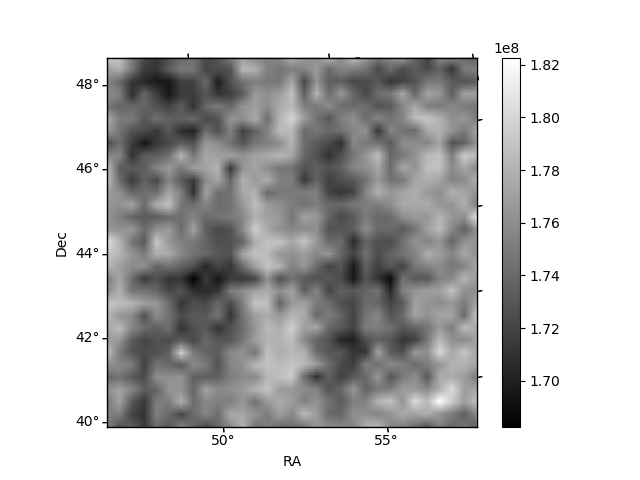
Histogram calculated using DETX and DETY for each event in the final _common_clean file
| Quadrant A |  |
 |
Quadrant B |
|---|---|---|---|
| Quadrant D |  |
 |
Quadrant C |
| Plot type | Count rate plots | Images |
|---|---|---|
| Comparison with Poisson distribution Blue bars denote a histogram of data divided into 1 sec bins. Red curve is a Poisson curve with rate = median count rate of data. |
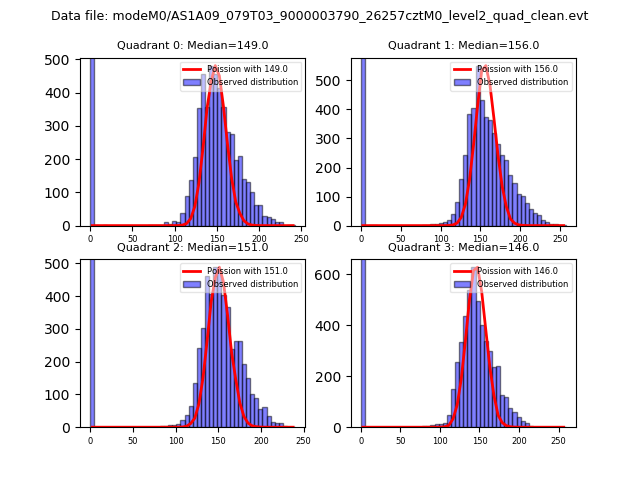 |
 |
| Quadrant-wise count rates Data is divided into 100 sec bins |
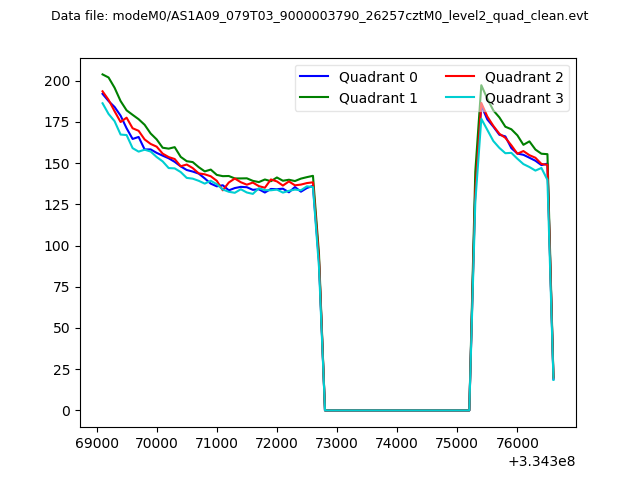 |
|
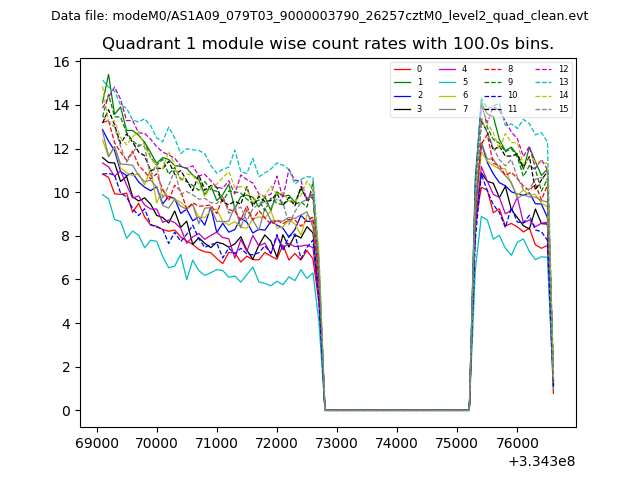
| Module-wise count rates for Quadrant A Data is divided into 100 sec bins |
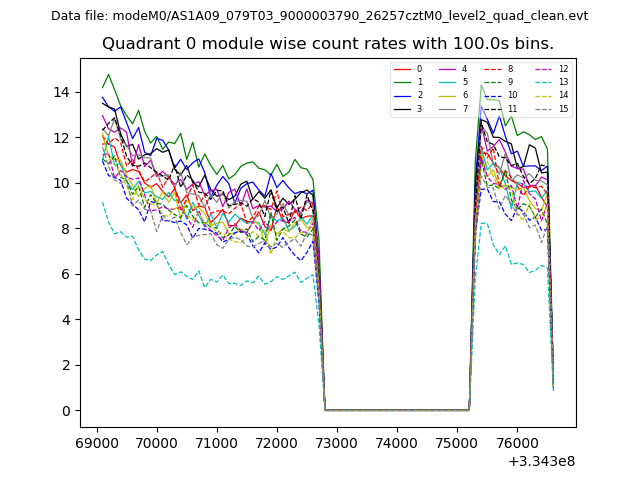 |
 |
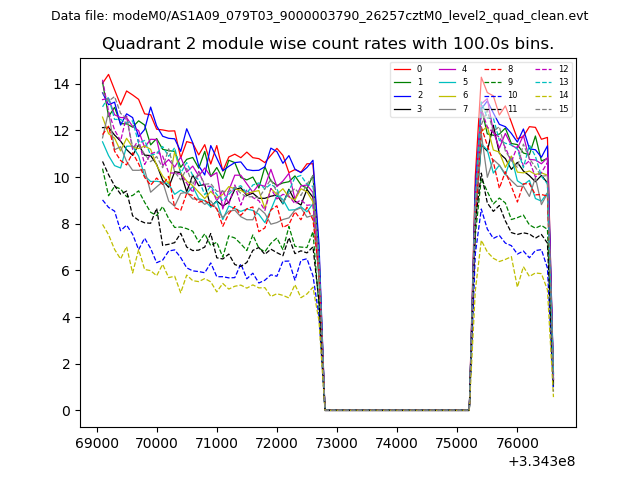
| Module-wise count rates for Quadrant B Data is divided into 100 sec bins |
 |
 |
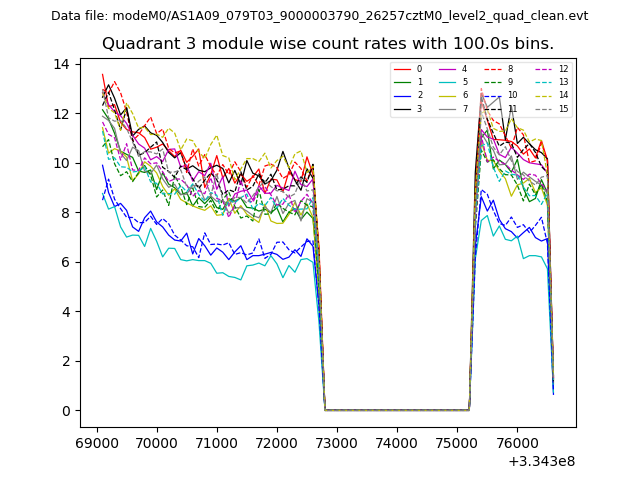
| Module-wise count rates for Quadrant C Data is divided into 100 sec bins |
 |
 |
| Module-wise count rates for Quadrant D Data is divided into 100 sec bins |
 |
 |
| Parameter | Plot |
|---|---|
| CZT HV Monitor | 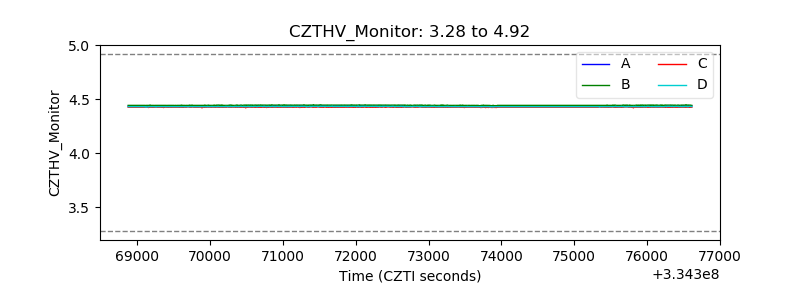 |
| D_VDD | 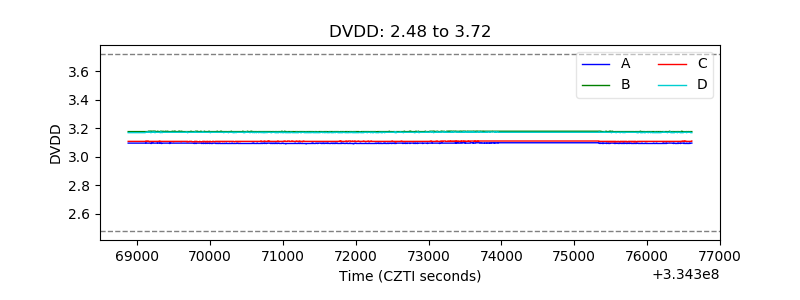 |
| Temperature 1 | 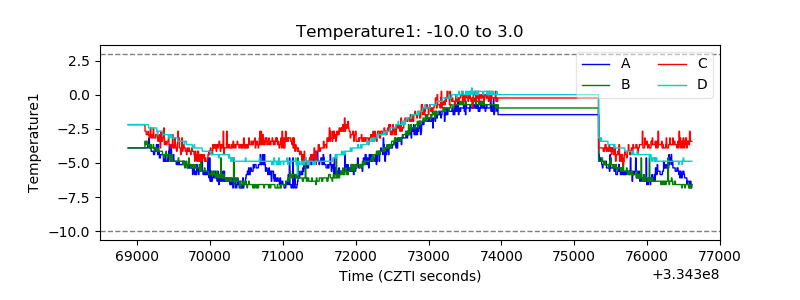 |
| Veto HV Monitor |  |
| Veto LLD | 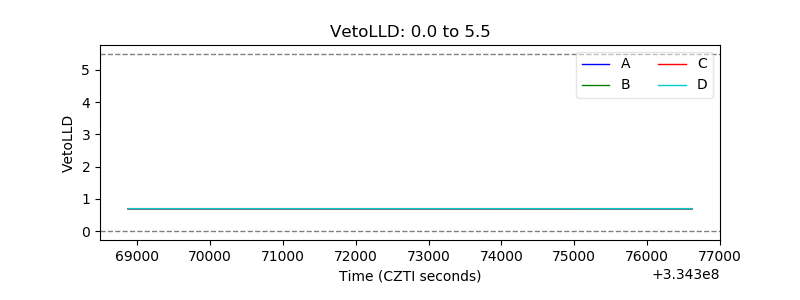 |
| Alpha Counter | 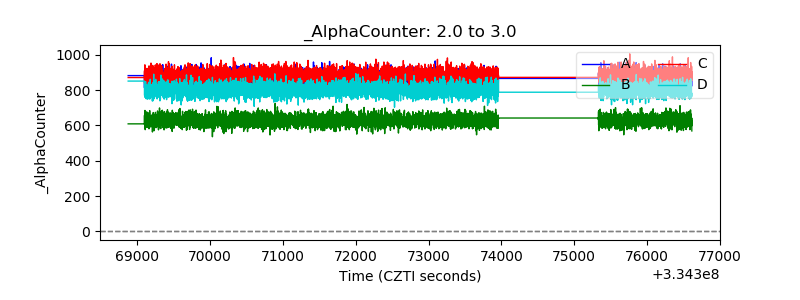 |
| _CPM_Rate | 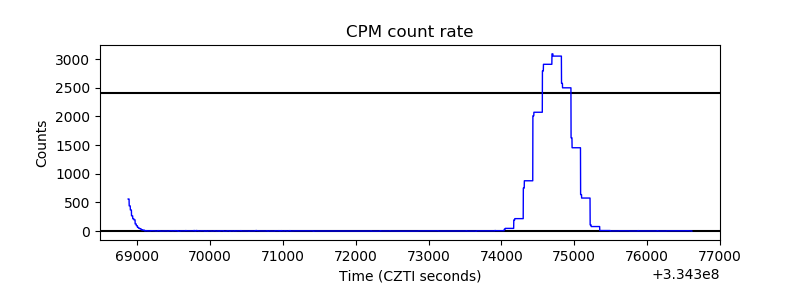 |
| CZT Counter | 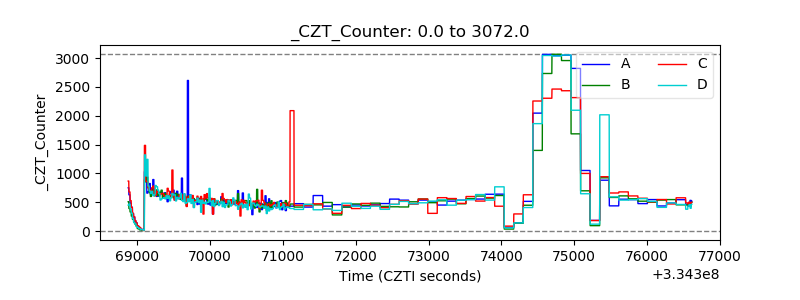 |
| +2.5 Volts monitor |  |
| +5 Volts monitor | 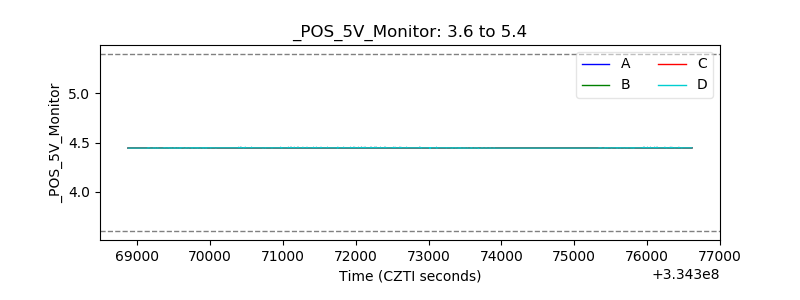 |
| _ROLL_ROT | 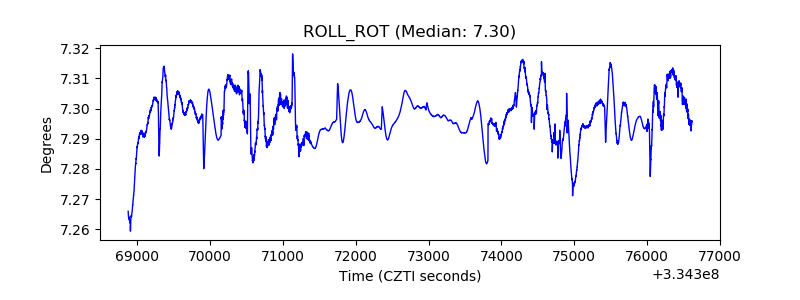 |
| _Roll_DEC | 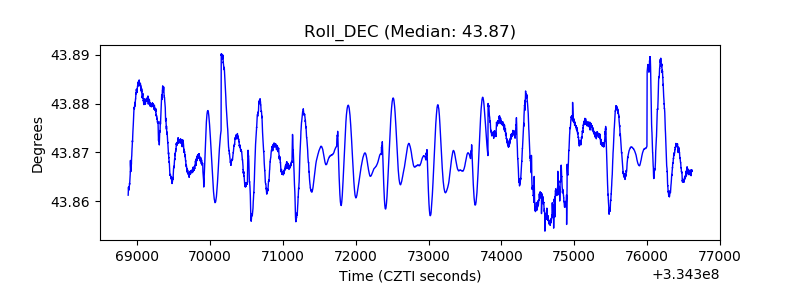 |
| _Roll_RA | 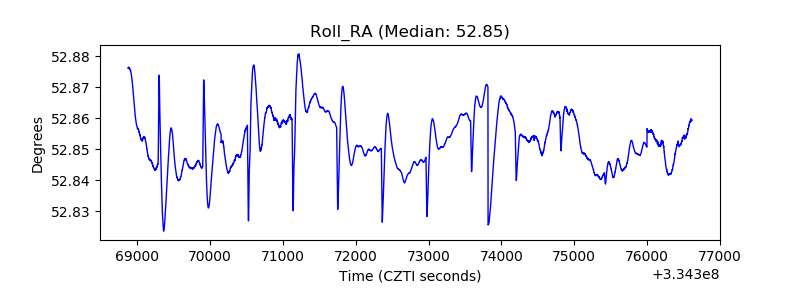 |
| Veto Counter | 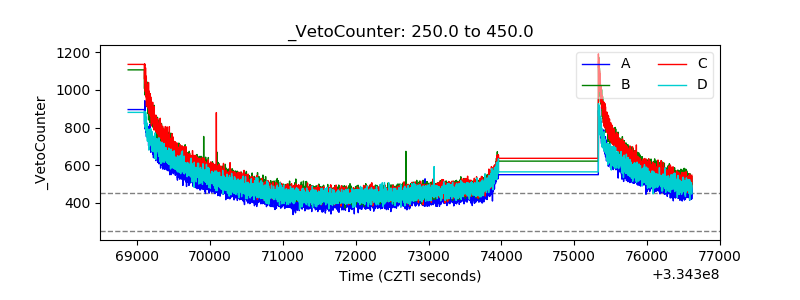 |