| Param | Original file | Final file |
|---|---|---|
| Filename | modeM0/AS1A09_079T03_9000003790_26258cztM0_level2.evt | modeM0/AS1A09_079T03_9000003790_26258cztM0_level2_quad_clean.evt |
| Size (bytes) | 594,066,240 | 108,849,600 |
| Size | 566.5 MB | 103.8 MB |
| Events in quadrant A | 3,372,693 | 723,106 |
| Events in quadrant B | 3,416,977 | 761,568 |
| Events in quadrant C | 7,449,663 | 651,994 |
| Events in quadrant D | 3,305,531 | 700,344 |
| Mode M0 | |||
|---|---|---|---|
| Quadrant | BADHDUFLAG | Total packets | Discarded packets |
| A | 0 | 14188 | 0 |
| B | 0 | 14247 | 0 |
| C | 0 | 26531 | 0 |
| D | 0 | 14279 | 0 |
| Mode M9 | |||
|---|---|---|---|
| Quadrant | BADHDUFLAG | Total packets | Discarded packets |
| A | 0 | 18 | 0 |
| B | 0 | 19 | 0 |
| C | 0 | 19 | 0 |
| D | 0 | 19 | 0 |
| Quadrant | Total seconds | Saturated seconds | Saturation percentage |
|---|---|---|---|
| A | 6593 | 39 | 0.591536% |
| B | 6593 | 62 | 0.940391% |
| C | 6593 | 1708 | 25.906264% |
| D | 6592 | 17 | 0.257888% |
Noise dominated data is calculated using 1-second bins in cleaned event files. If a bin has >2000 counts, and if more than 50% of those come from <1% of pixels, then it is considered to be noise-dominated and hence unusable.
| Quadrant | # 1 sec bins | Bins with >0 counts | Bins with >2000 counts | High rate bins dominated by noise | Noise dominated (total time) | Noise dominated (detector-on time) | Marked lightcurve |
|---|---|---|---|---|---|---|---|
| A | 7918 | 6594 | 6 | 6 | 0.08% | 0.09% | 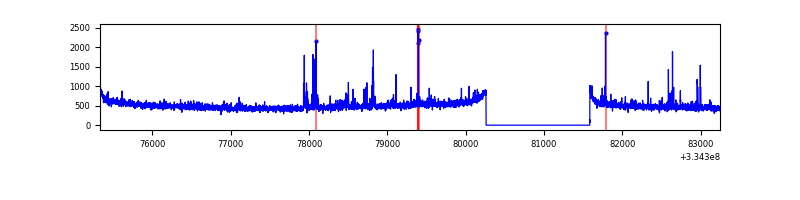 |
| B | 7918 | 6594 | 7 | 7 | 0.09% | 0.11% | 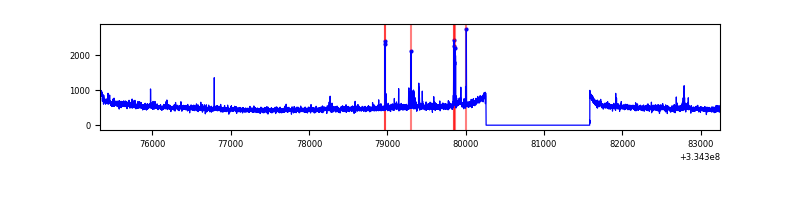 |
| C | 7918 | 6594 | 1327 | 1327 | 16.76% | 20.12% | 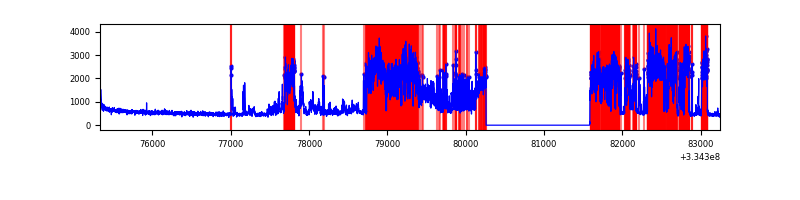 |
| D | 7917 | 6593 | 5 | 5 | 0.06% | 0.08% | 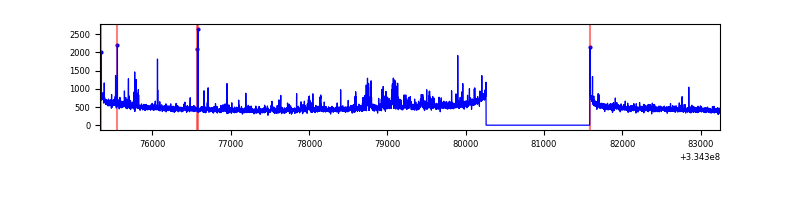 |
Top three noisy pixels from each quadrant. If the there are fewer than three noisy pixels in the level2.evt file, extra rows are filled as -1
| Pixel properties | Quadrant properties | ||||||
|---|---|---|---|---|---|---|---|
| Quadrant | DetID | PixID | Counts | Sigma | Mean | Median | Sigma |
| A | 0 | 13 | 129887 | 771.51 | 840 | 825 | 167.3 |
| A | 13 | 254 | 10851 | 59.93 | 840 | 825 | 167.3 |
| A | 3 | 137 | 7413 | 39.38 | 840 | 825 | 167.3 |
| B | 5 | 172 | 36377 | 224.98 | 853 | 835 | 158.0 |
| B | 0 | 245 | 25391 | 155.44 | 853 | 835 | 158.0 |
| B | 12 | 111 | 18558 | 112.19 | 853 | 835 | 158.0 |
| C | 2 | 16 | 4479013 | 26978.17 | 718 | 724 | 166.0 |
| C | 14 | 238 | 115820 | 693.36 | 718 | 724 | 166.0 |
| C | 3 | 233 | 42915 | 254.17 | 718 | 724 | 166.0 |
| D | 1 | 52 | 169155 | 874.64 | 812 | 793 | 192.5 |
| D | 2 | 234 | 25447 | 128.08 | 812 | 793 | 192.5 |
| D | 8 | 195 | 19960 | 99.57 | 812 | 793 | 192.5 |
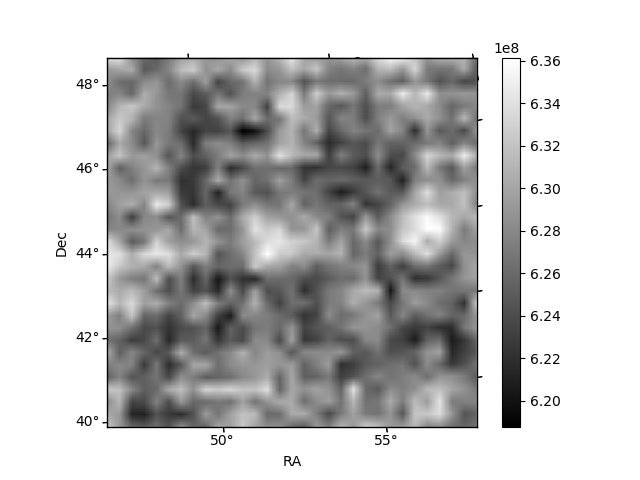
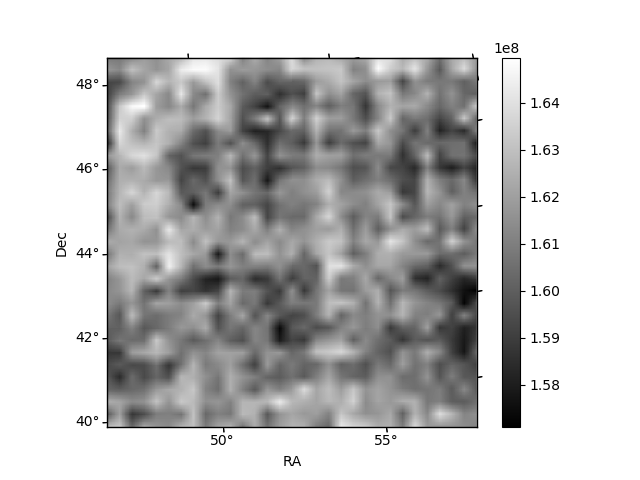
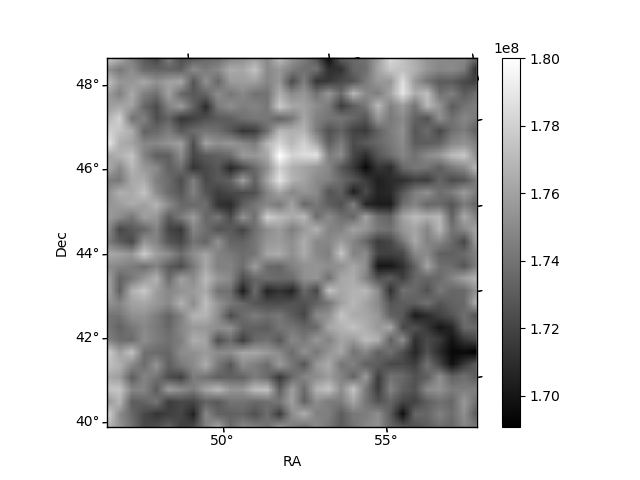
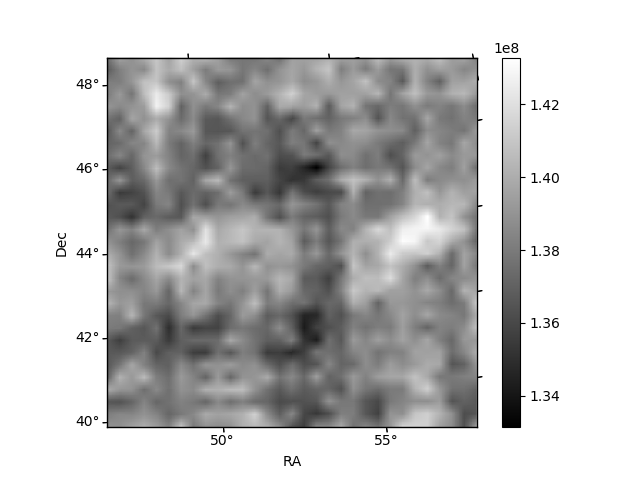
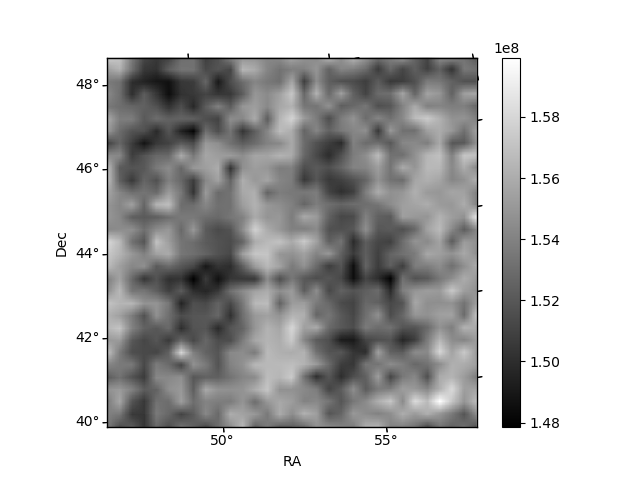
Histogram calculated using DETX and DETY for each event in the final _common_clean file
| Quadrant A | 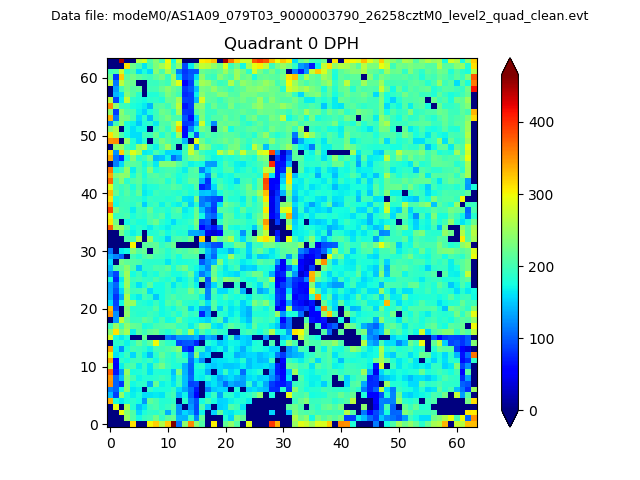 |
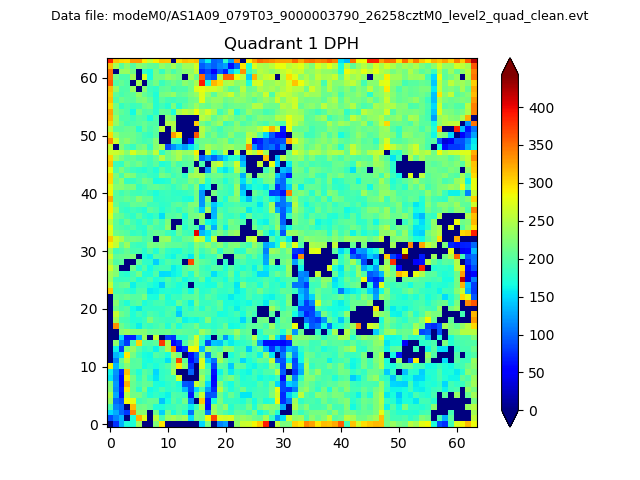 |
Quadrant B |
|---|---|---|---|
| Quadrant D | 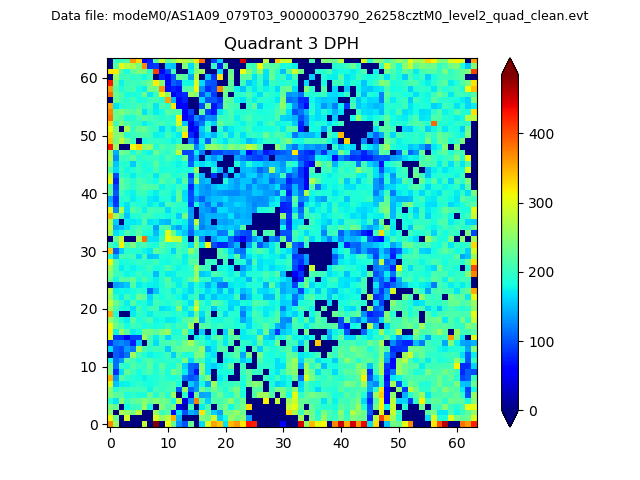 |
 |
Quadrant C |
| Plot type | Count rate plots | Images |
|---|---|---|
| Comparison with Poisson distribution Blue bars denote a histogram of data divided into 1 sec bins. Red curve is a Poisson curve with rate = median count rate of data. |
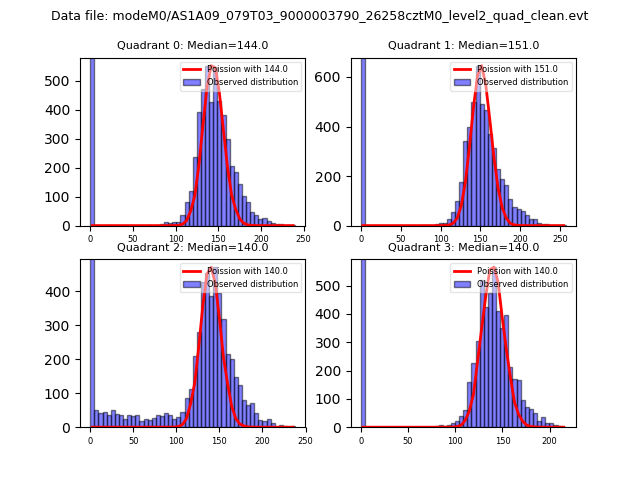 |
 |
| Quadrant-wise count rates Data is divided into 100 sec bins |
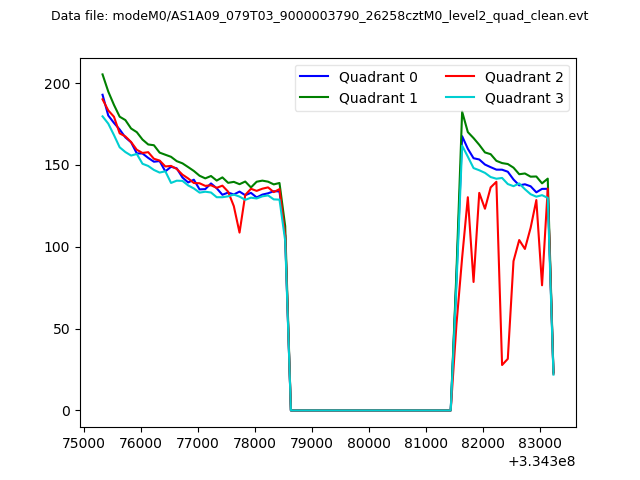 |
|
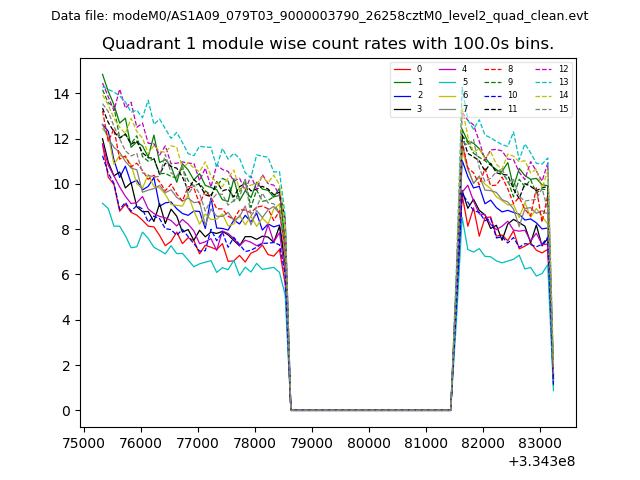
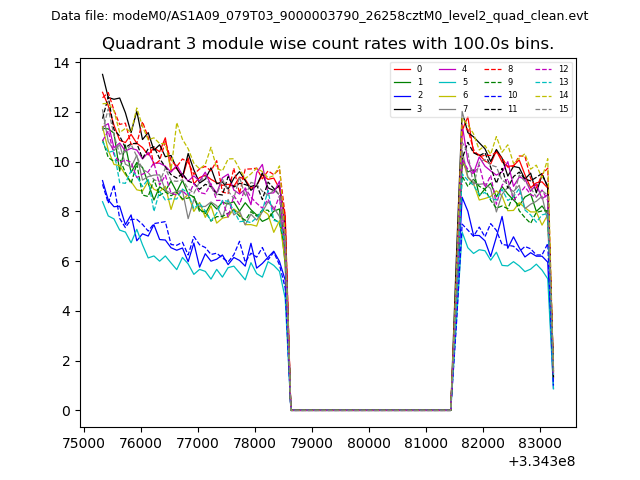
| Module-wise count rates for Quadrant A Data is divided into 100 sec bins |
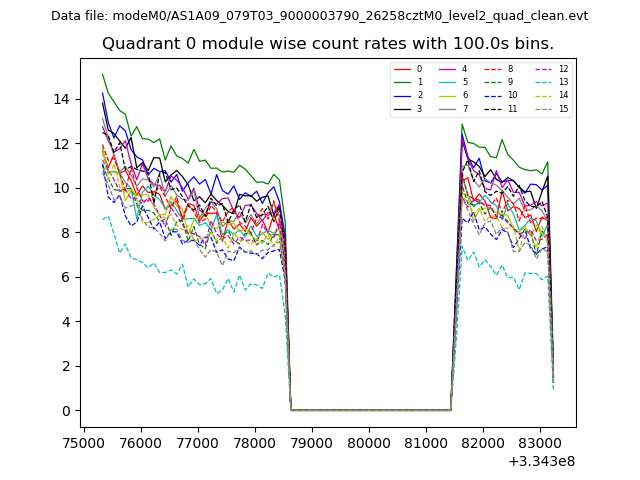 |
 |
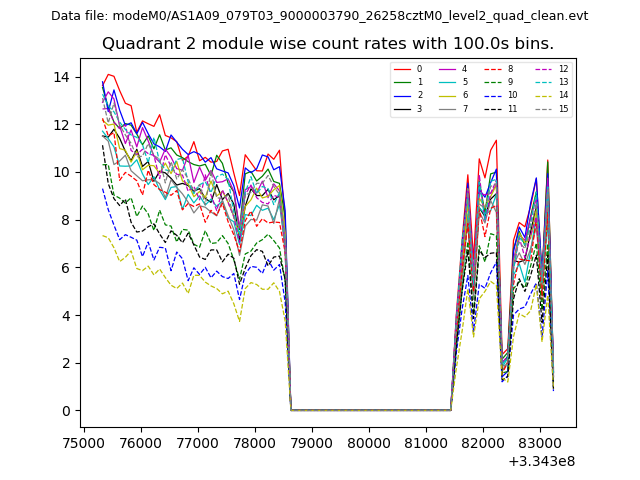
| Module-wise count rates for Quadrant B Data is divided into 100 sec bins |
 |
 |
| Module-wise count rates for Quadrant C Data is divided into 100 sec bins |
 |
 |
| Module-wise count rates for Quadrant D Data is divided into 100 sec bins |
 |
 |
| Parameter | Plot |
|---|---|
| CZT HV Monitor | 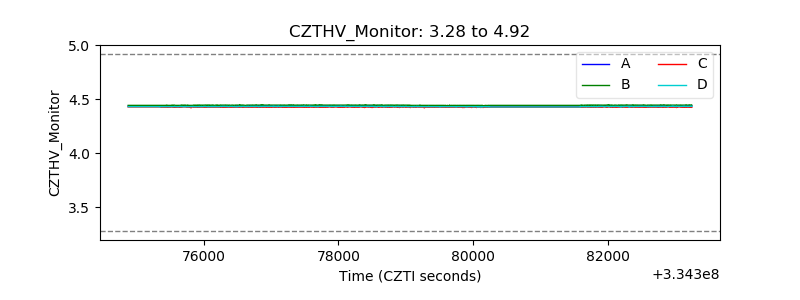 |
| D_VDD | 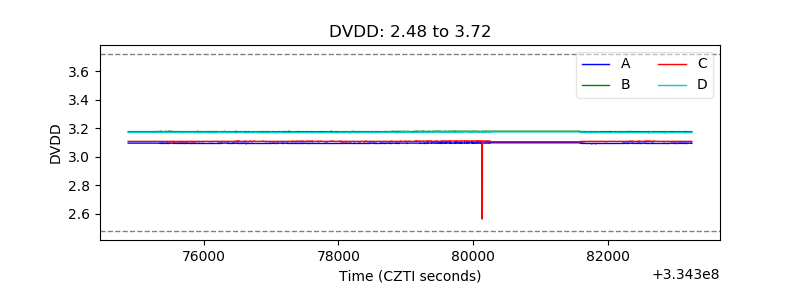 |
| Temperature 1 | 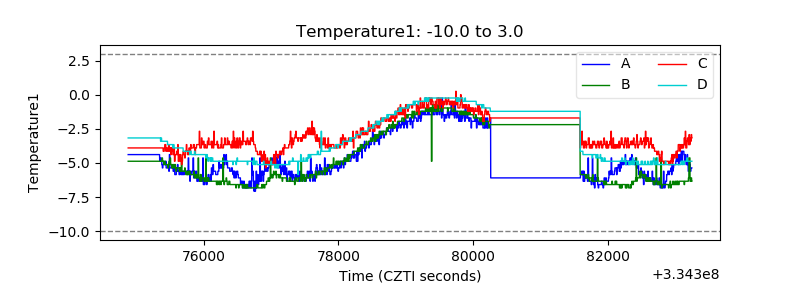 |
| Veto HV Monitor | 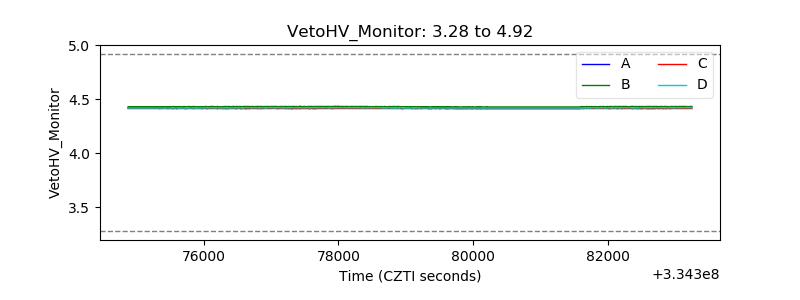 |
| Veto LLD | 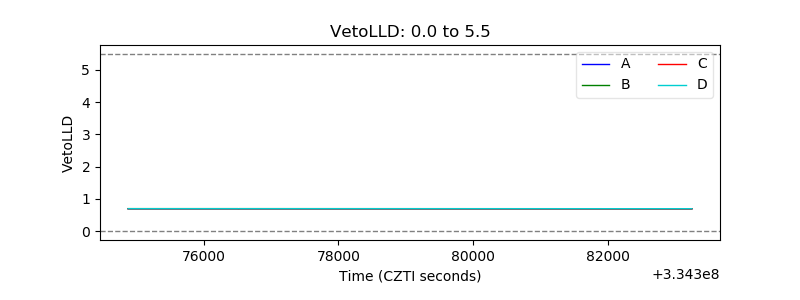 |
| Alpha Counter | 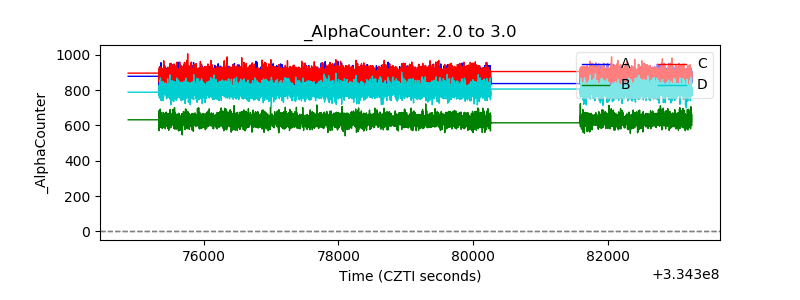 |
| _CPM_Rate | 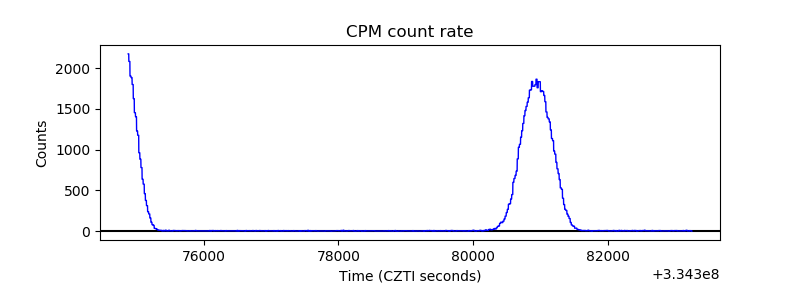 |
| CZT Counter | 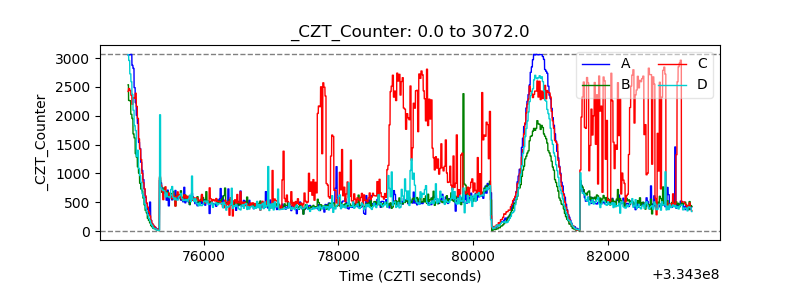 |
| +2.5 Volts monitor |  |
| +5 Volts monitor |  |
| _ROLL_ROT | 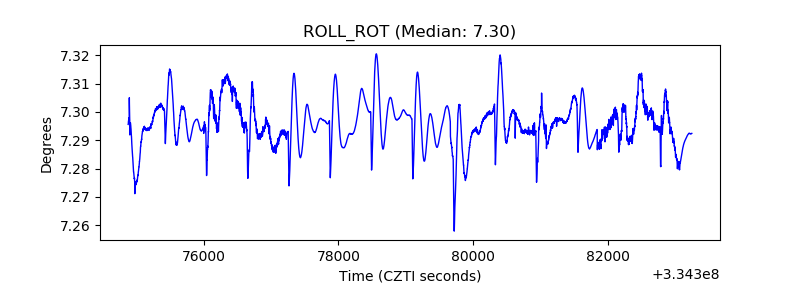 |
| _Roll_DEC | 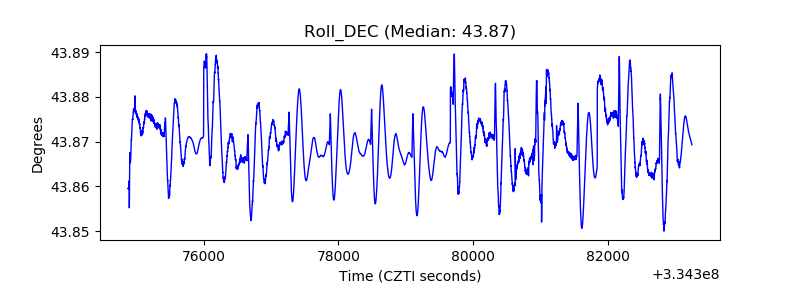 |
| _Roll_RA | 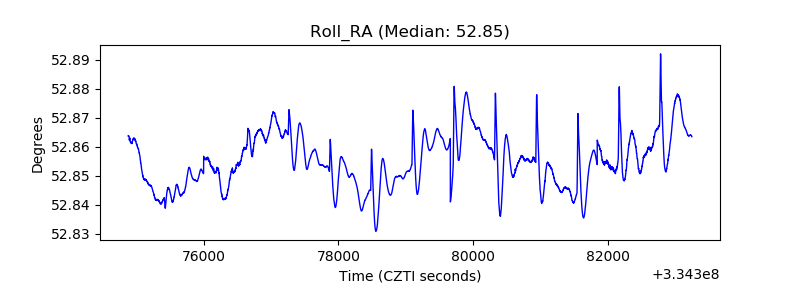 |
| Veto Counter | 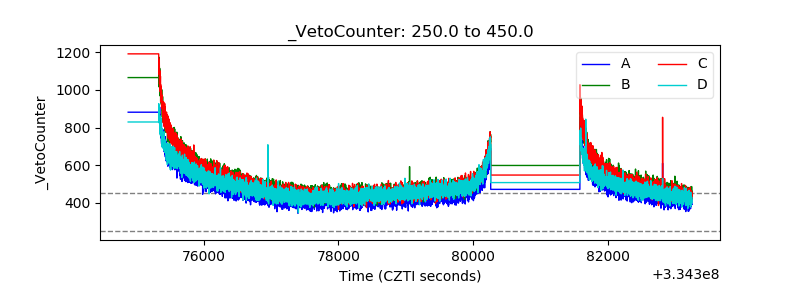 |