| Param | Original file | Final file |
|---|---|---|
| Filename | modeM0/AS1A09_079T03_9000003790_26259cztM0_level2.evt | modeM0/AS1A09_079T03_9000003790_26259cztM0_level2_quad_clean.evt |
| Size (bytes) | 471,352,320 | 79,902,720 |
| Size | 449.5 MB | 76.2 MB |
| Events in quadrant A | 2,975,543 | 515,457 |
| Events in quadrant B | 2,927,374 | 534,268 |
| Events in quadrant C | 4,946,455 | 454,758 |
| Events in quadrant D | 3,022,759 | 500,565 |
| Mode M0 | |||
|---|---|---|---|
| Quadrant | BADHDUFLAG | Total packets | Discarded packets |
| A | 0 | 12661 | 0 |
| B | 0 | 12480 | 0 |
| C | 0 | 18577 | 0 |
| D | 0 | 13266 | 0 |
| Mode M9 | |||
|---|---|---|---|
| Quadrant | BADHDUFLAG | Total packets | Discarded packets |
| A | 0 | 12 | 0 |
| B | 0 | 12 | 0 |
| C | 0 | 12 | 0 |
| D | 0 | 12 | 0 |
| Quadrant | Total seconds | Saturated seconds | Saturation percentage |
|---|---|---|---|
| A | 5930 | 37 | 0.623946% |
| B | 5931 | 37 | 0.623841% |
| C | 5931 | 803 | 13.539032% |
| D | 5931 | 33 | 0.556399% |
Noise dominated data is calculated using 1-second bins in cleaned event files. If a bin has >2000 counts, and if more than 50% of those come from <1% of pixels, then it is considered to be noise-dominated and hence unusable.
| Quadrant | # 1 sec bins | Bins with >0 counts | Bins with >2000 counts | High rate bins dominated by noise | Noise dominated (total time) | Noise dominated (detector-on time) | Marked lightcurve |
|---|---|---|---|---|---|---|---|
| A | 7125 | 5931 | 4 | 4 | 0.06% | 0.07% | 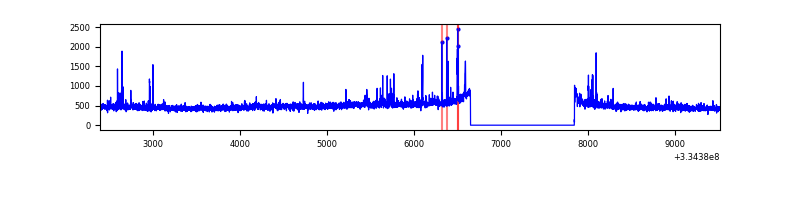 |
| B | 7126 | 5932 | 1 | 1 | 0.01% | 0.02% | 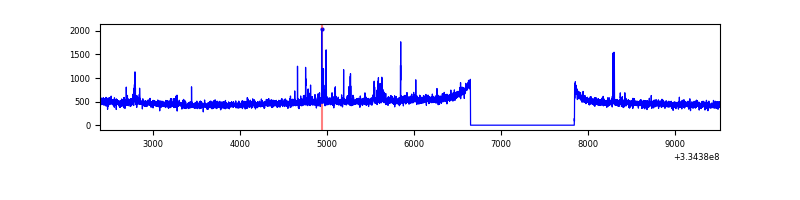 |
| C | 7126 | 5932 | 717 | 717 | 10.06% | 12.09% | 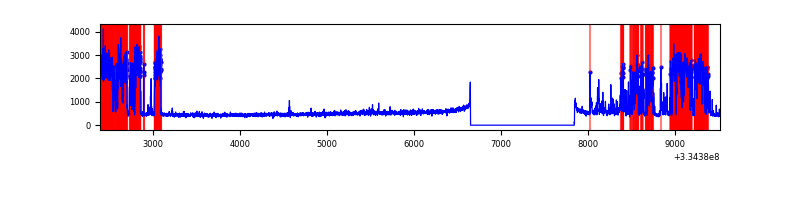 |
| D | 7126 | 5932 | 17 | 17 | 0.24% | 0.29% | 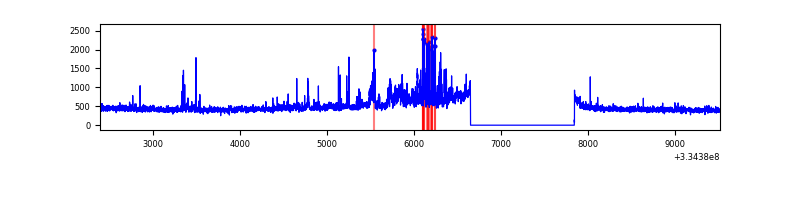 |
Top three noisy pixels from each quadrant. If the there are fewer than three noisy pixels in the level2.evt file, extra rows are filled as -1
| Pixel properties | Quadrant properties | ||||||
|---|---|---|---|---|---|---|---|
| Quadrant | DetID | PixID | Counts | Sigma | Mean | Median | Sigma |
| A | 0 | 13 | 149187 | 1021.04 | 724 | 711 | 145.4 |
| A | 12 | 16 | 25712 | 171.93 | 724 | 711 | 145.4 |
| A | 13 | 254 | 9188 | 58.29 | 724 | 711 | 145.4 |
| B | 0 | 245 | 21844 | 154.55 | 727 | 708 | 136.8 |
| B | 5 | 172 | 19882 | 140.21 | 727 | 708 | 136.8 |
| B | 0 | 230 | 16762 | 117.39 | 727 | 708 | 136.8 |
| C | 2 | 16 | 2247489 | 14796.92 | 654 | 657 | 151.8 |
| C | 14 | 238 | 105960 | 693.49 | 654 | 657 | 151.8 |
| C | 3 | 233 | 30021 | 193.38 | 654 | 657 | 151.8 |
| D | 1 | 52 | 246316 | 1465.96 | 699 | 681 | 167.6 |
| D | 13 | 168 | 86669 | 513.18 | 699 | 681 | 167.6 |
| D | 12 | 233 | 26664 | 155.07 | 699 | 681 | 167.6 |
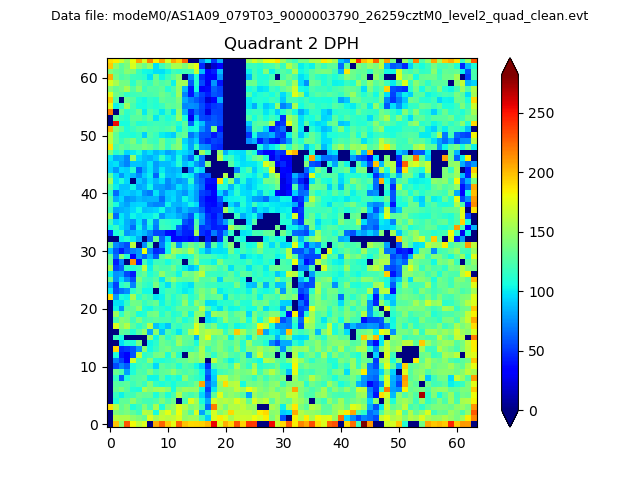
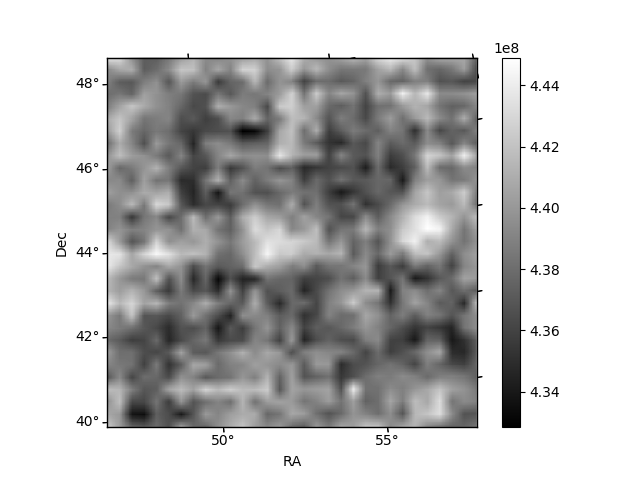
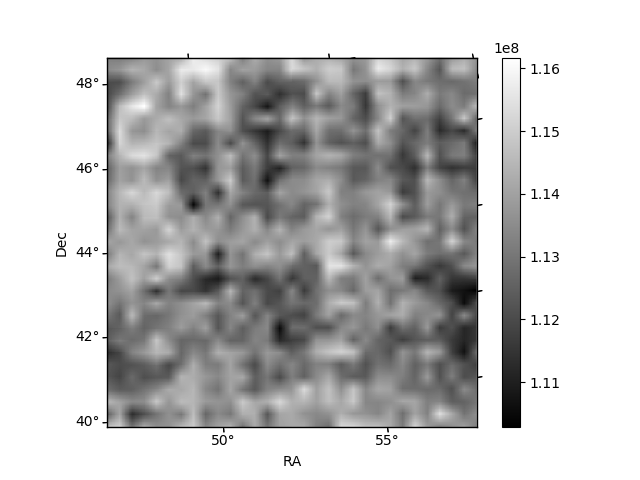
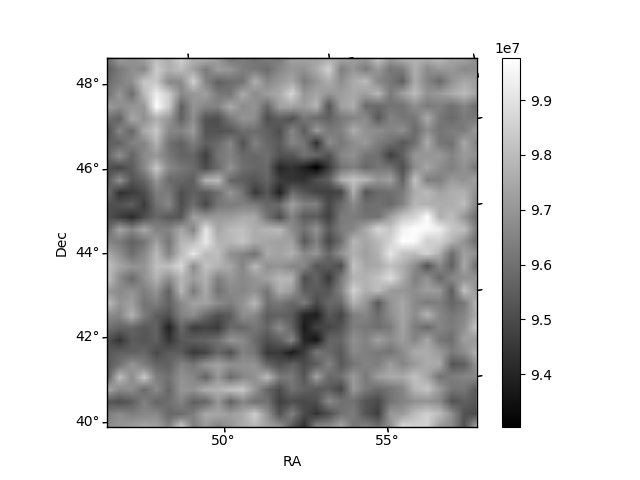
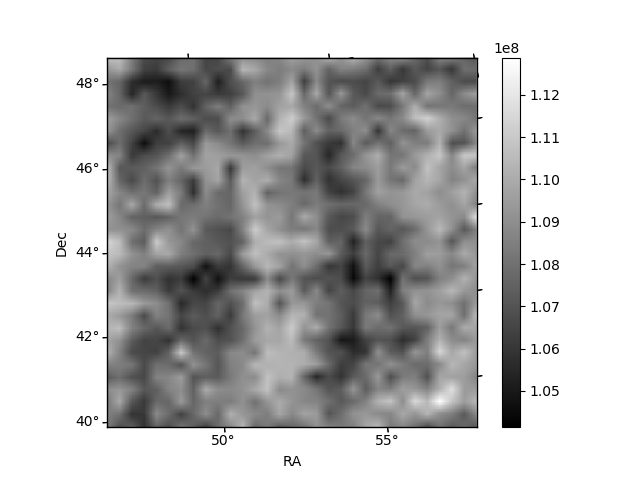
Histogram calculated using DETX and DETY for each event in the final _common_clean file
| Quadrant A | 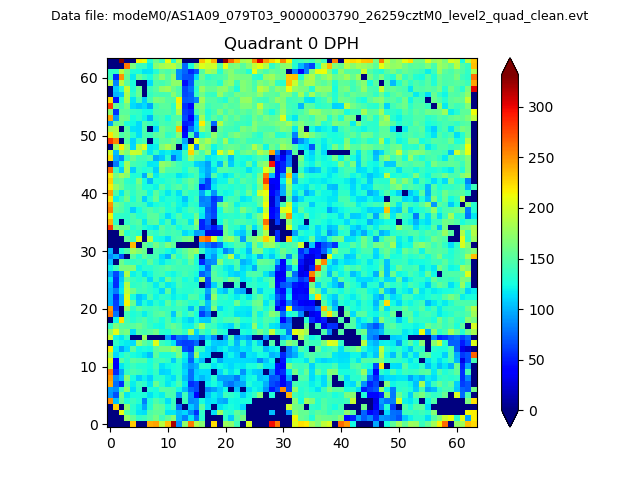 |
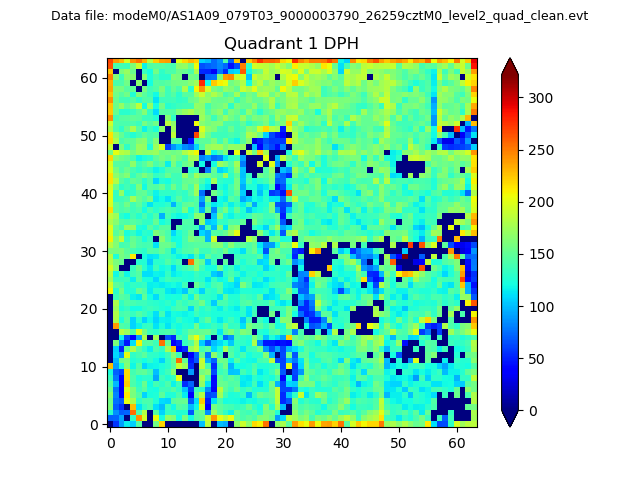 |
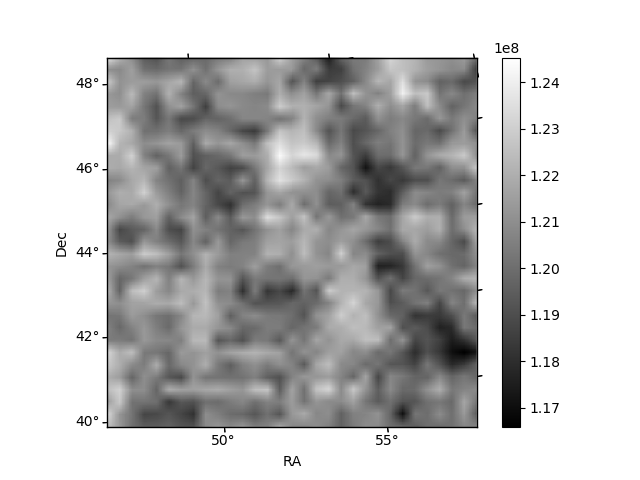
Quadrant B |
|---|---|---|---|
| Quadrant D | 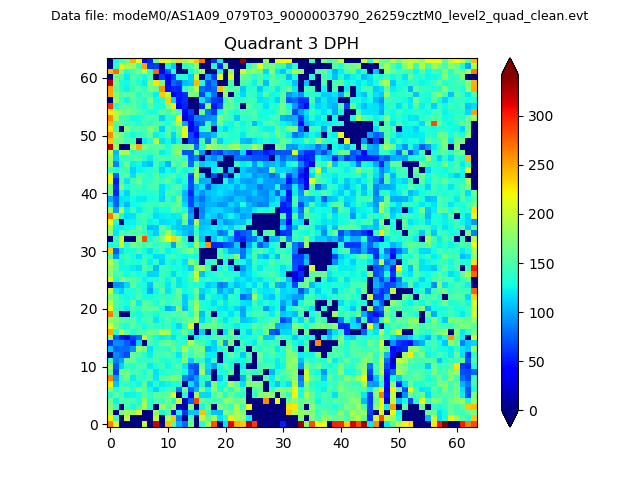 |
 |
Quadrant C |
| Plot type | Count rate plots | Images |
|---|---|---|
| Comparison with Poisson distribution Blue bars denote a histogram of data divided into 1 sec bins. Red curve is a Poisson curve with rate = median count rate of data. |
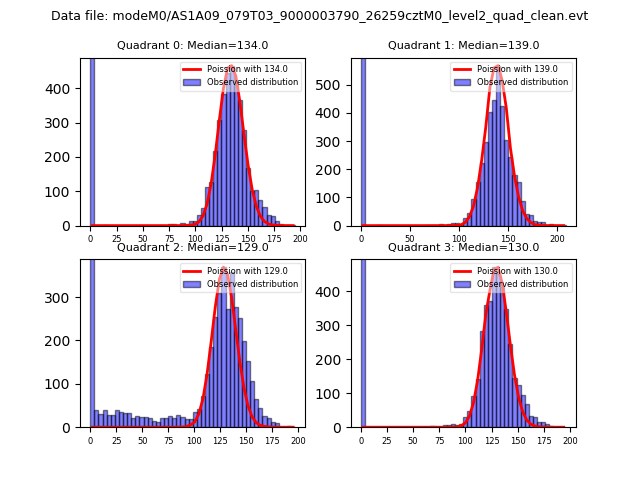 |
 |
| Quadrant-wise count rates Data is divided into 100 sec bins |
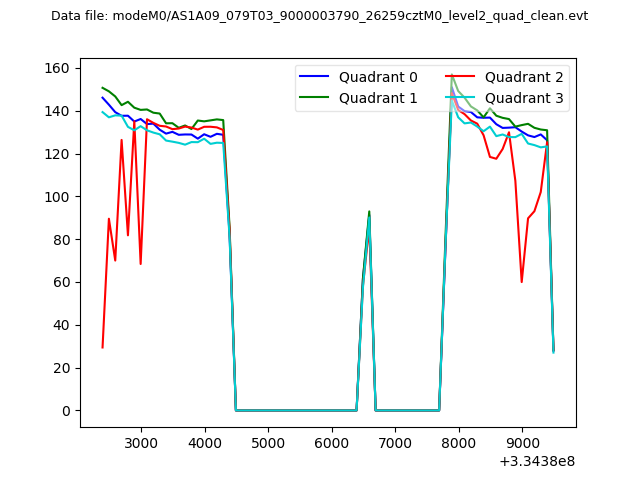 |
|
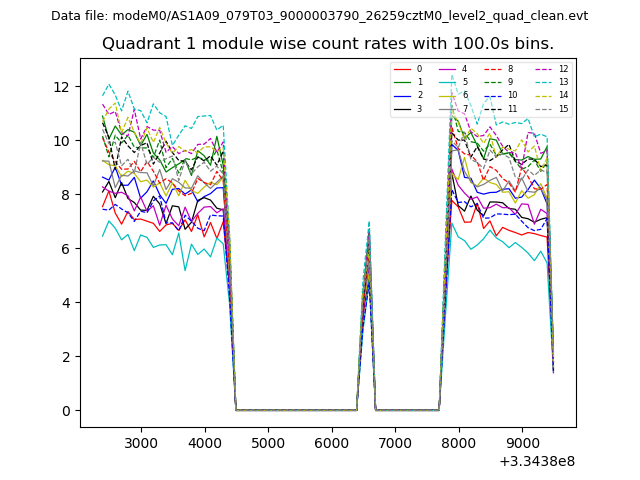
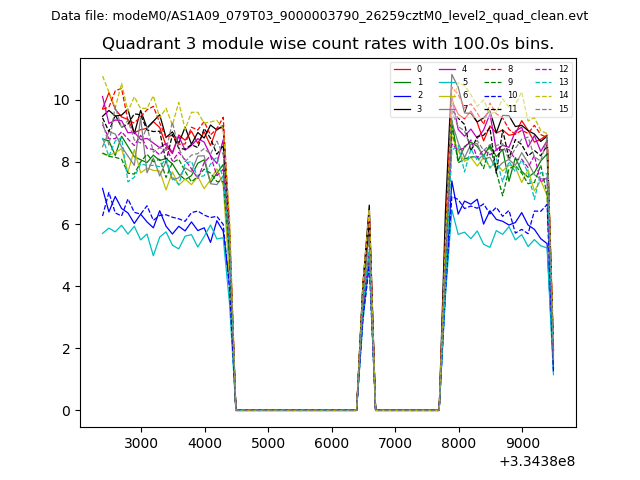
| Module-wise count rates for Quadrant A Data is divided into 100 sec bins |
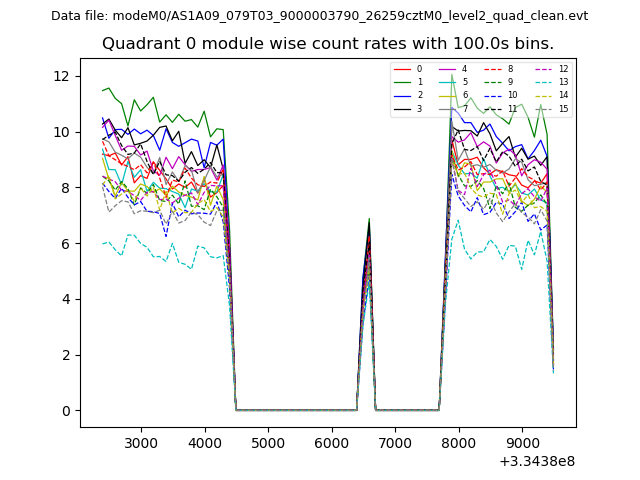 |
 |
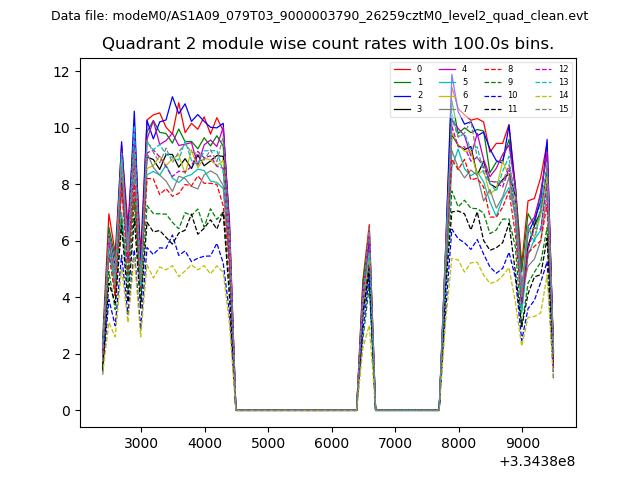
| Module-wise count rates for Quadrant B Data is divided into 100 sec bins |
 |
 |
| Module-wise count rates for Quadrant C Data is divided into 100 sec bins |
 |
 |
| Module-wise count rates for Quadrant D Data is divided into 100 sec bins |
 |
 |
| Parameter | Plot |
|---|---|
| CZT HV Monitor | 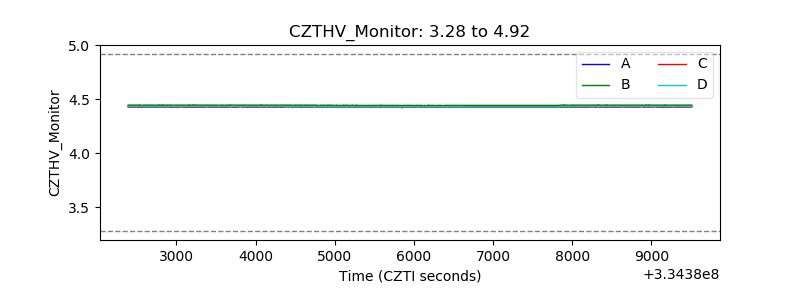 |
| D_VDD | 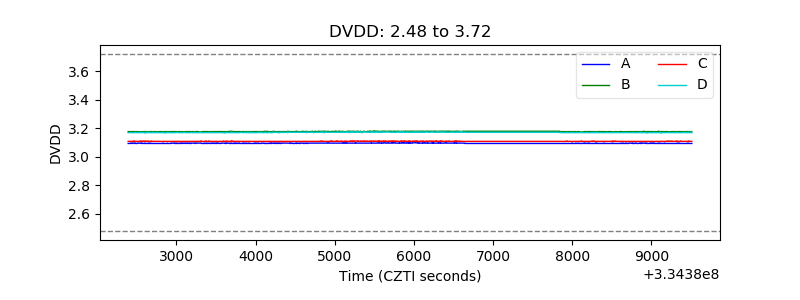 |
| Temperature 1 | 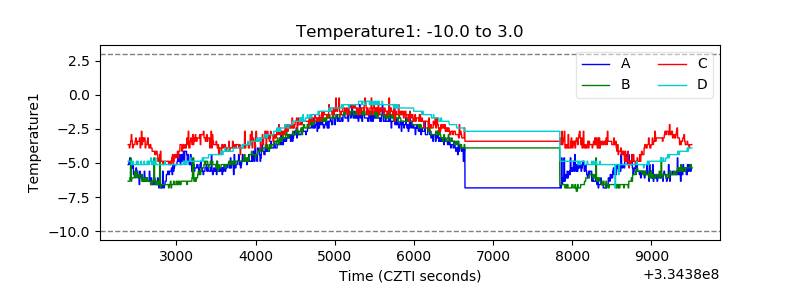 |
| Veto HV Monitor |  |
| Veto LLD | 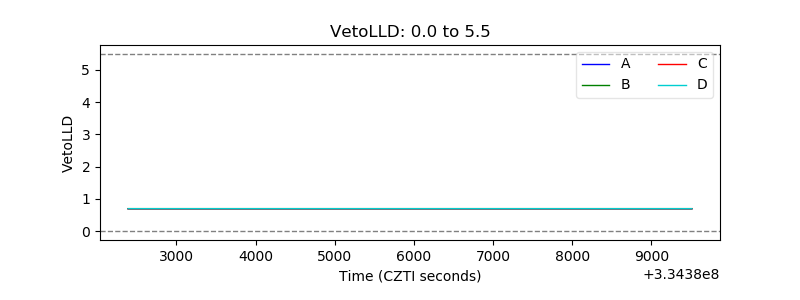 |
| Alpha Counter | 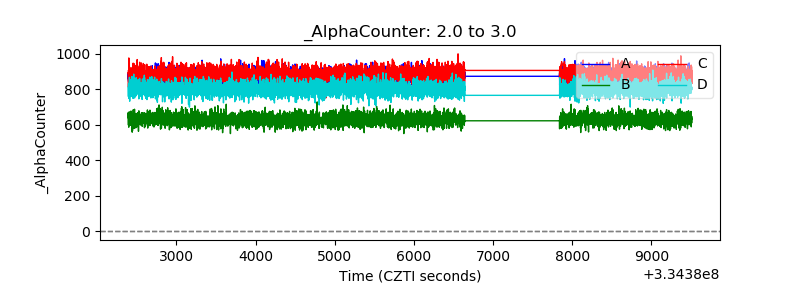 |
| _CPM_Rate | 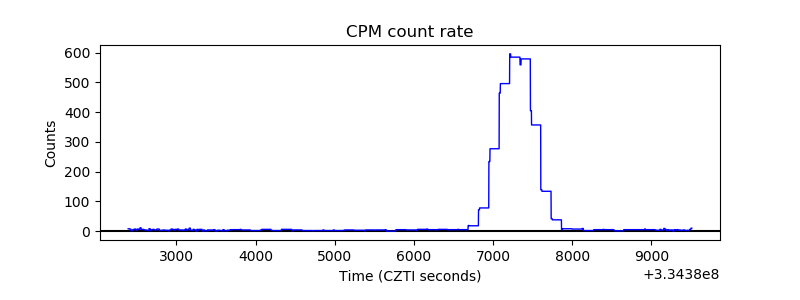 |
| CZT Counter | 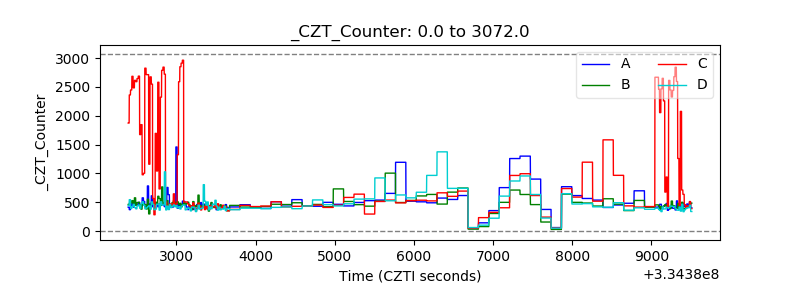 |
| +2.5 Volts monitor |  |
| +5 Volts monitor |  |
| _ROLL_ROT | 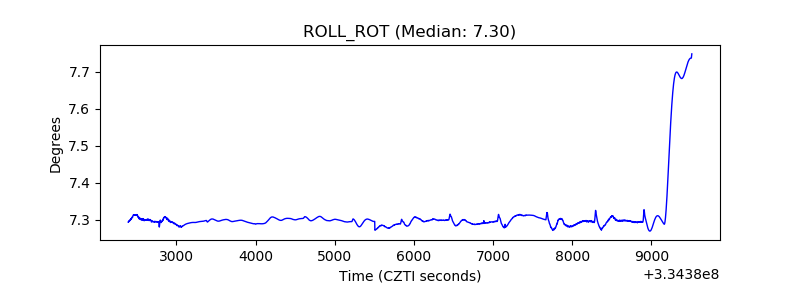 |
| _Roll_DEC | 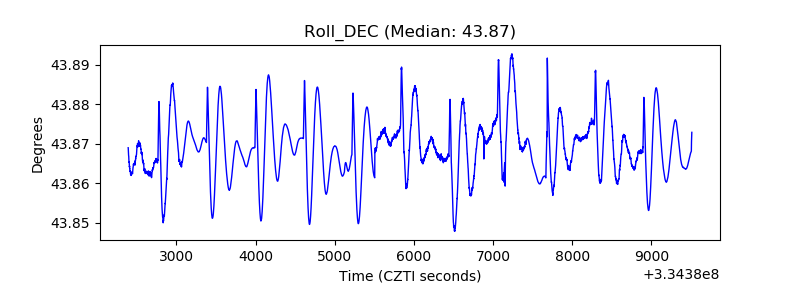 |
| _Roll_RA | 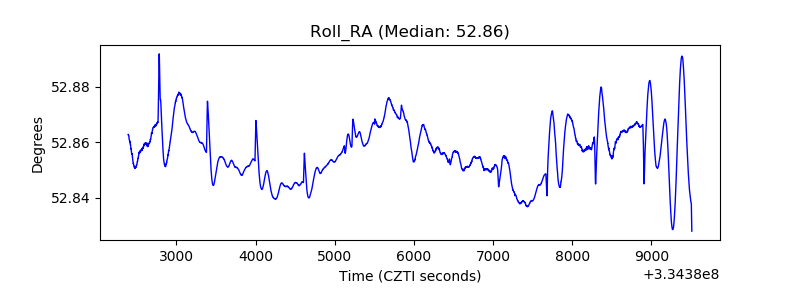 |
| Veto Counter | 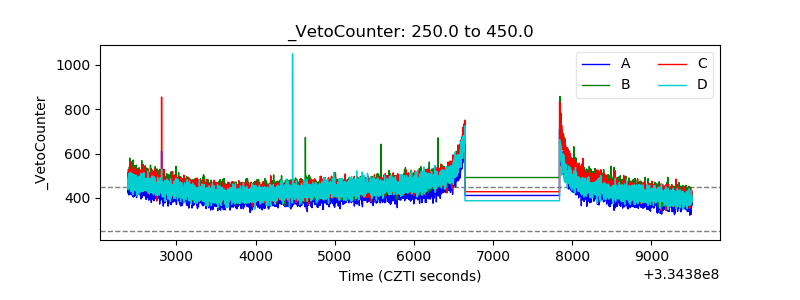 |