| Param | Original file | Final file |
|---|---|---|
| Filename | modeM0/AS1A09_079T03_9000003790_26260cztM0_level2.evt | modeM0/AS1A09_079T03_9000003790_26260cztM0_level2_quad_clean.evt |
| Size (bytes) | 434,617,920 | 80,343,360 |
| Size | 414.5 MB | 76.6 MB |
| Events in quadrant A | 2,879,306 | 507,724 |
| Events in quadrant B | 2,904,891 | 525,876 |
| Events in quadrant C | 4,108,616 | 481,143 |
| Events in quadrant D | 2,859,650 | 497,101 |
| Mode M0 | |||
|---|---|---|---|
| Quadrant | BADHDUFLAG | Total packets | Discarded packets |
| A | 0 | 12505 | 0 |
| B | 0 | 12507 | 0 |
| C | 0 | 16031 | 0 |
| D | 0 | 12804 | 0 |
| Mode M9 | |||
|---|---|---|---|
| Quadrant | BADHDUFLAG | Total packets | Discarded packets |
| A | 0 | 8 | 0 |
| B | 0 | 8 | 0 |
| C | 0 | 8 | 0 |
| D | 0 | 8 | 0 |
| Quadrant | Total seconds | Saturated seconds | Saturation percentage |
|---|---|---|---|
| A | 6028 | 65 | 1.078301% |
| B | 6029 | 74 | 1.227401% |
| C | 6029 | 511 | 8.475701% |
| D | 6029 | 40 | 0.663460% |
Noise dominated data is calculated using 1-second bins in cleaned event files. If a bin has >2000 counts, and if more than 50% of those come from <1% of pixels, then it is considered to be noise-dominated and hence unusable.
| Quadrant | # 1 sec bins | Bins with >0 counts | Bins with >2000 counts | High rate bins dominated by noise | Noise dominated (total time) | Noise dominated (detector-on time) | Marked lightcurve |
|---|---|---|---|---|---|---|---|
| A | 6848 | 6029 | 0 | 0 | 0.00% | 0.00% |  |
| B | 6849 | 6030 | 4 | 4 | 0.06% | 0.07% |  |
| C | 6849 | 6030 | 387 | 387 | 5.65% | 6.42% |  |
| D | 6849 | 6030 | 8 | 8 | 0.12% | 0.13% |  |
Top three noisy pixels from each quadrant. If the there are fewer than three noisy pixels in the level2.evt file, extra rows are filled as -1
| Pixel properties | Quadrant properties | ||||||
|---|---|---|---|---|---|---|---|
| Quadrant | DetID | PixID | Counts | Sigma | Mean | Median | Sigma |
| A | 0 | 13 | 54479 | 364.4 | 732 | 717 | 147.5 |
| A | 13 | 254 | 9513 | 59.62 | 732 | 717 | 147.5 |
| A | 3 | 137 | 6734 | 40.78 | 732 | 717 | 147.5 |
| B | 0 | 245 | 32490 | 226.25 | 730 | 710 | 140.5 |
| B | 12 | 111 | 16802 | 114.57 | 730 | 710 | 140.5 |
| B | 11 | 111 | 15051 | 102.1 | 730 | 710 | 140.5 |
| C | 2 | 16 | 1071070 | 6709.02 | 681 | 685 | 159.5 |
| C | 4 | 254 | 186290 | 1163.35 | 681 | 685 | 159.5 |
| C | 14 | 238 | 109043 | 679.17 | 681 | 685 | 159.5 |
| D | 1 | 52 | 116164 | 676.03 | 709 | 691 | 170.8 |
| D | 12 | 233 | 44317 | 255.41 | 709 | 691 | 170.8 |
| D | 2 | 234 | 25114 | 142.98 | 709 | 691 | 170.8 |
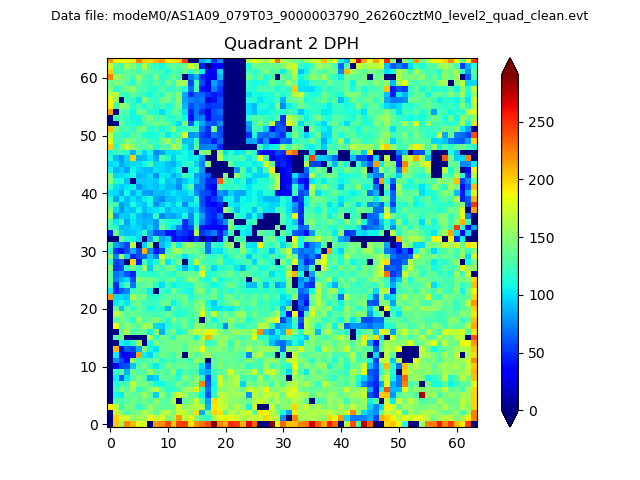
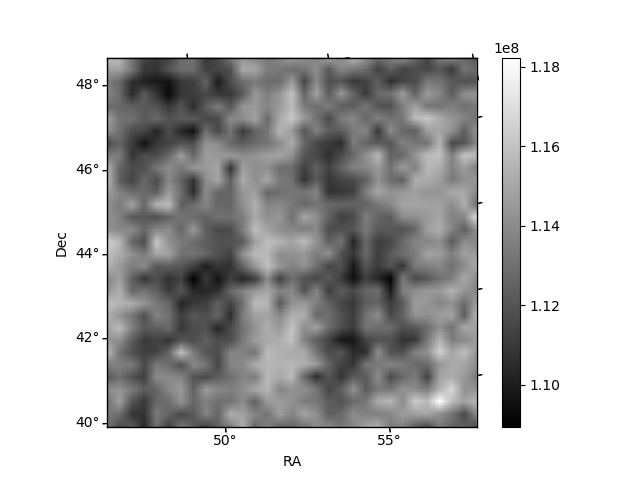
Histogram calculated using DETX and DETY for each event in the final _common_clean file
| Quadrant A | 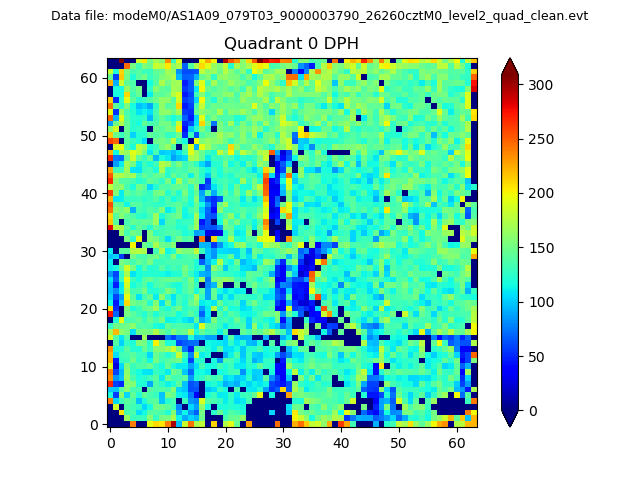 |
 |
Quadrant B |
|---|---|---|---|
| Quadrant D | 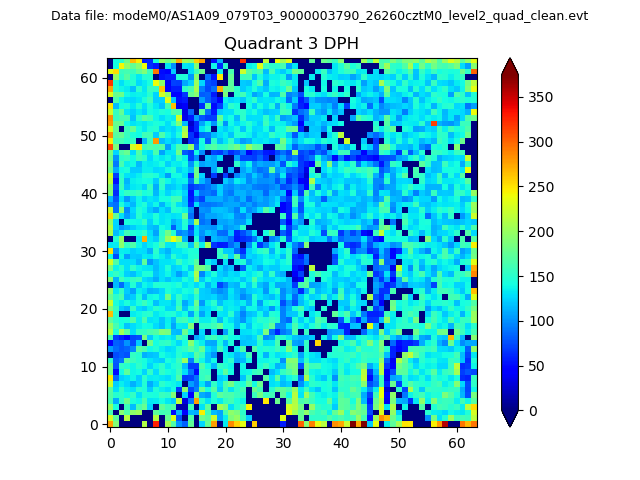 |
 |
Quadrant C |
| Plot type | Count rate plots | Images |
|---|---|---|
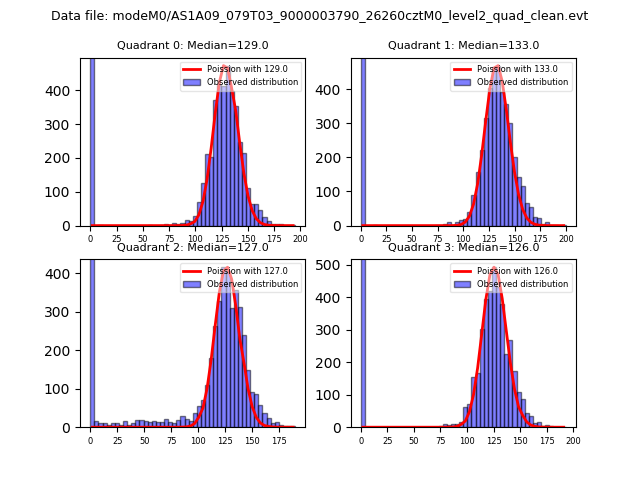
| Comparison with Poisson distribution Blue bars denote a histogram of data divided into 1 sec bins. Red curve is a Poisson curve with rate = median count rate of data. |
 |
 |
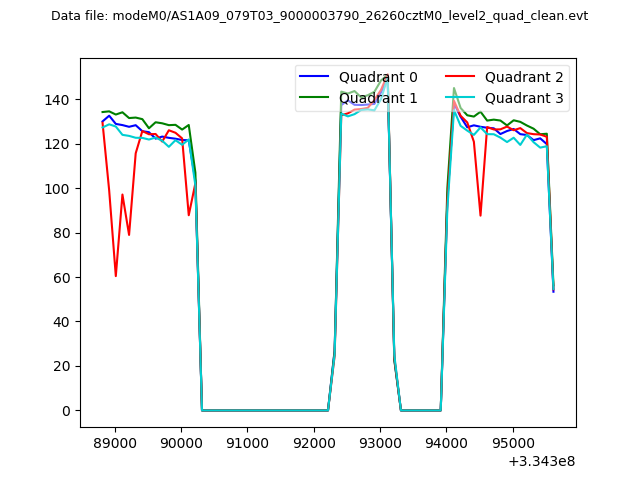
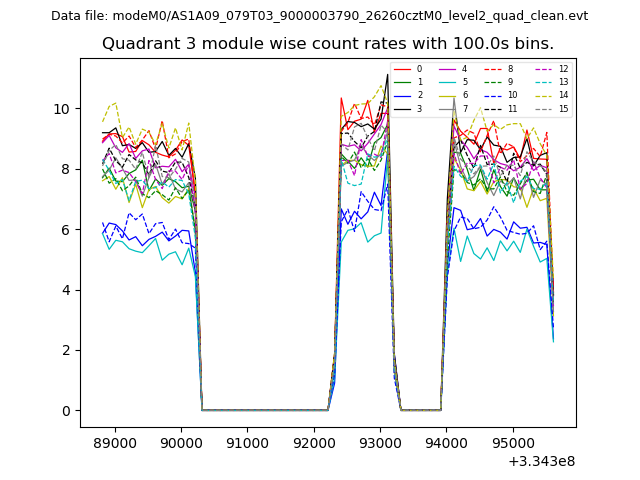
| Quadrant-wise count rates Data is divided into 100 sec bins |
 |
|
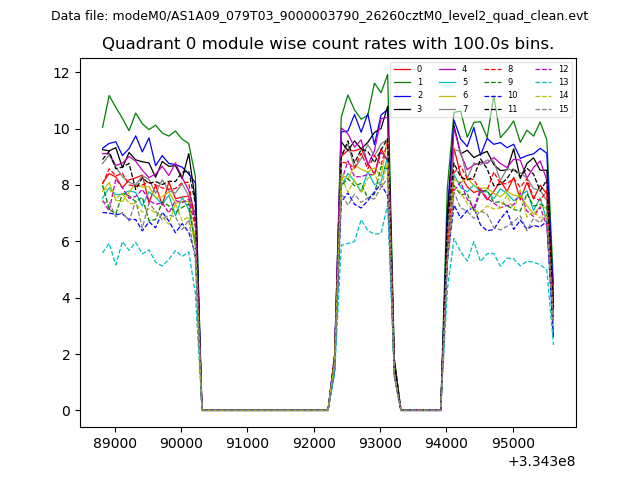
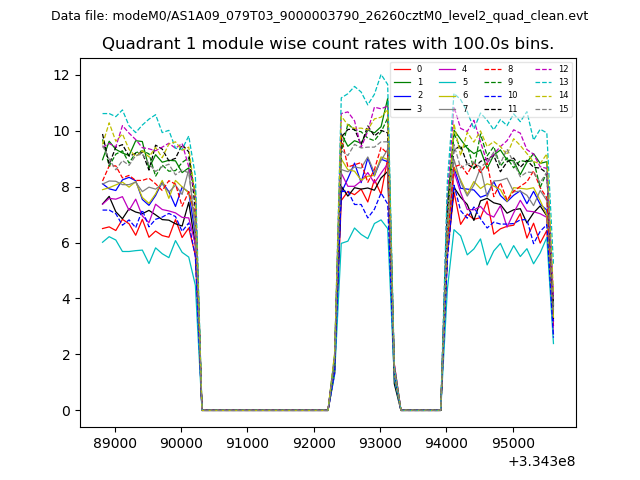
| Module-wise count rates for Quadrant A Data is divided into 100 sec bins |
 |
 |
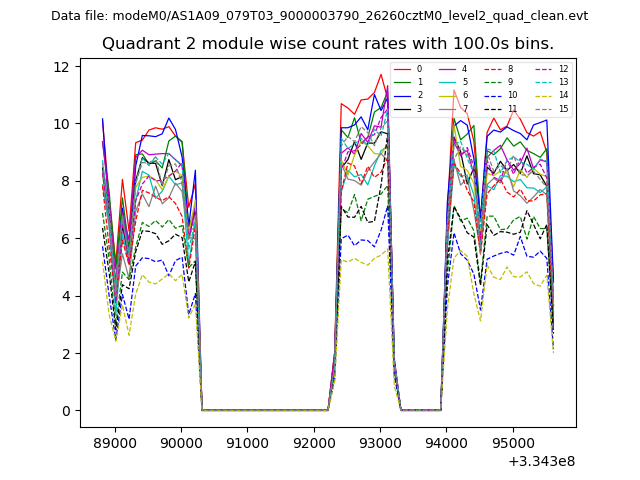
| Module-wise count rates for Quadrant B Data is divided into 100 sec bins |
 |
 |
| Module-wise count rates for Quadrant C Data is divided into 100 sec bins |
 |
 |
| Module-wise count rates for Quadrant D Data is divided into 100 sec bins |
 |
 |
| Parameter | Plot |
|---|---|
| CZT HV Monitor | 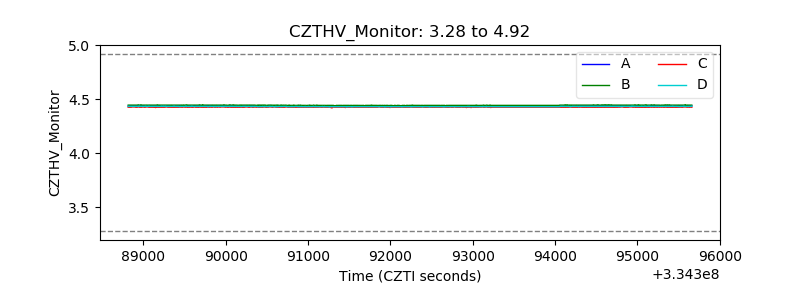 |
| D_VDD | 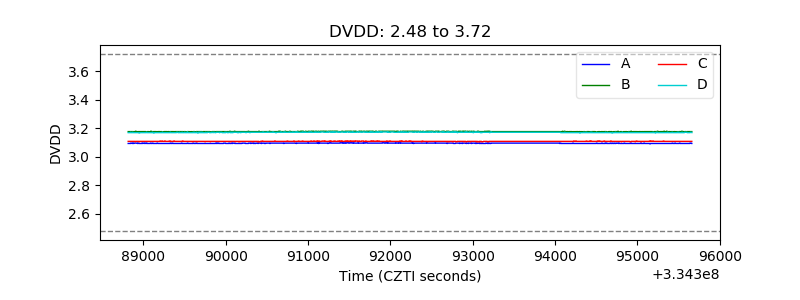 |
| Temperature 1 | 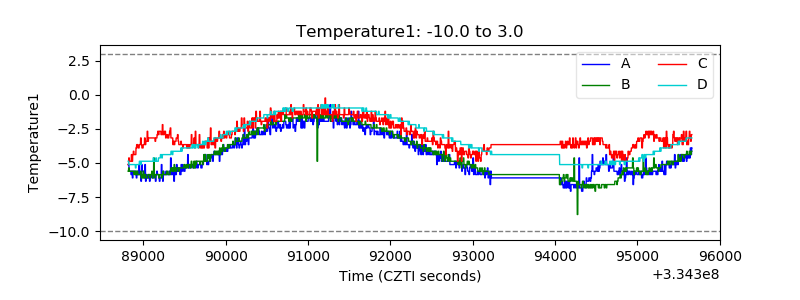 |
| Veto HV Monitor | 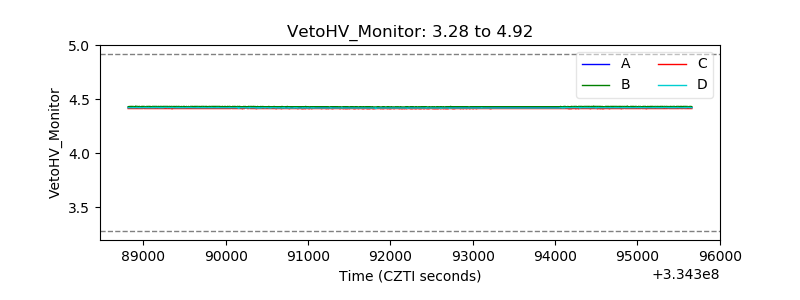 |
| Veto LLD | 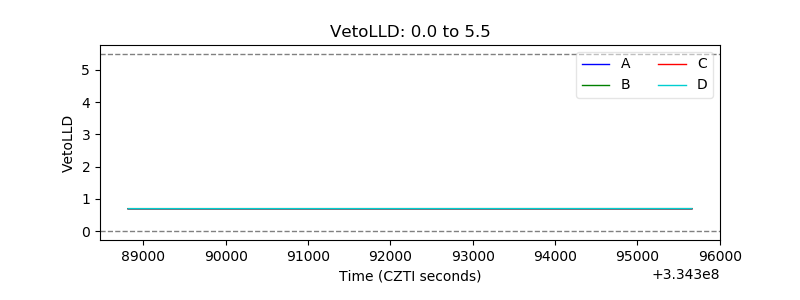 |
| Alpha Counter | 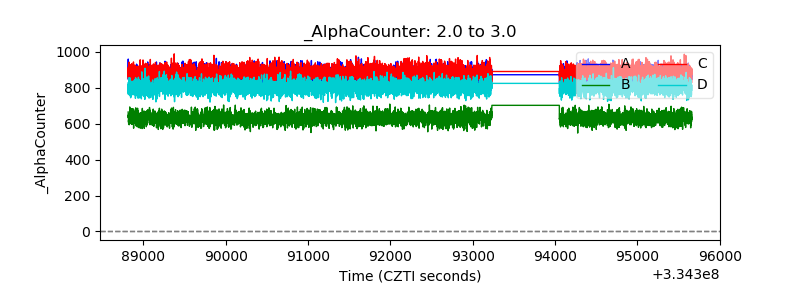 |
| _CPM_Rate | 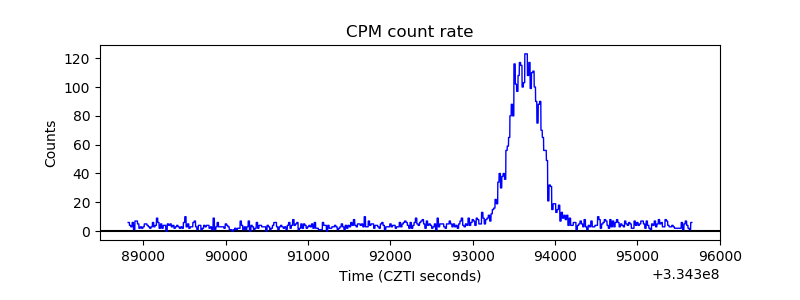 |
| CZT Counter | 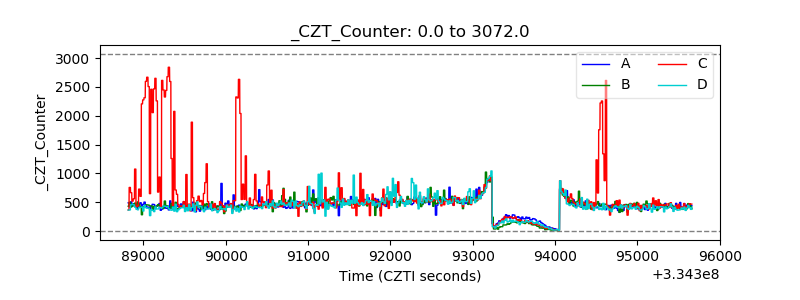 |
| +2.5 Volts monitor |  |
| +5 Volts monitor | 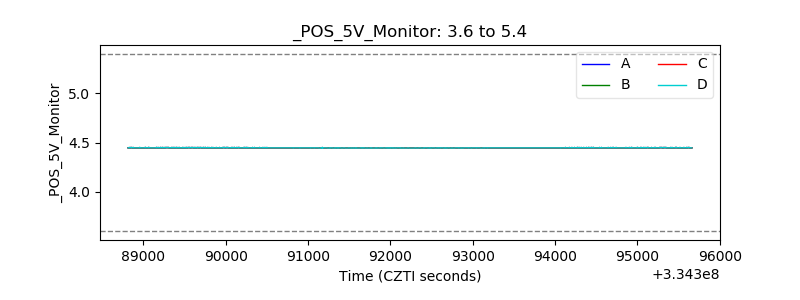 |
| _ROLL_ROT | 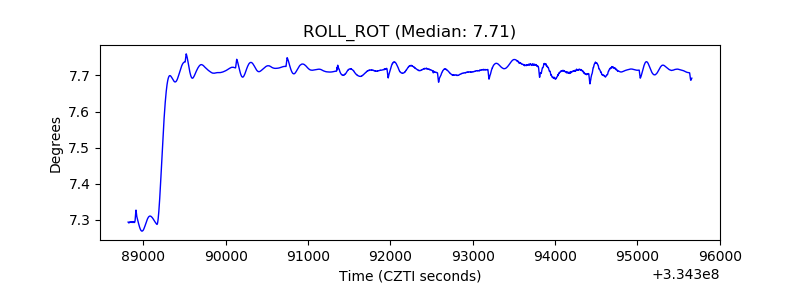 |
| _Roll_DEC | 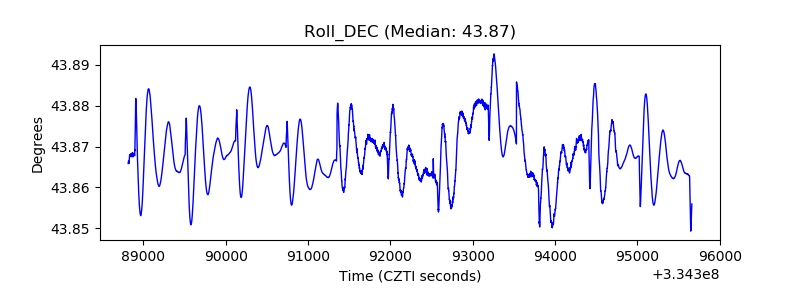 |
| _Roll_RA | 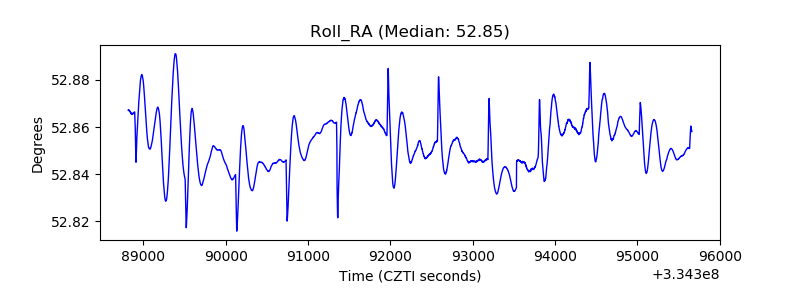 |
| Veto Counter | 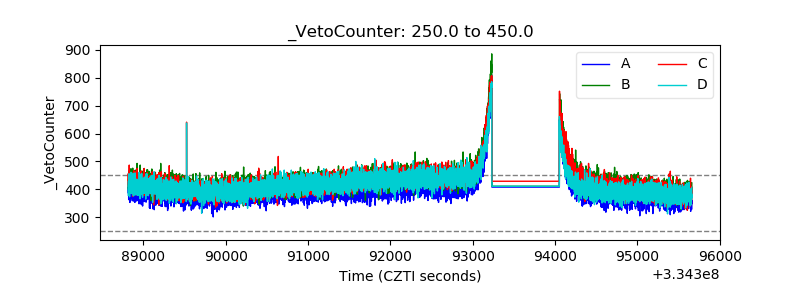 |