| Param | Original file | Final file |
|---|---|---|
| Filename | modeM0/AS1A09_079T03_9000003790_26261cztM0_level2.evt | modeM0/AS1A09_079T03_9000003790_26261cztM0_level2_quad_clean.evt |
| Size (bytes) | 1,664,576,640 | 294,986,880 |
| Size | 1.6 GB | 281.3 MB |
| Events in quadrant A | 10,788,450 | 1,872,502 |
| Events in quadrant B | 10,844,101 | 1,946,049 |
| Events in quadrant C | 16,433,315 | 1,773,129 |
| Events in quadrant D | 10,860,261 | 1,828,449 |
| Mode M0 | |||
|---|---|---|---|
| Quadrant | BADHDUFLAG | Total packets | Discarded packets |
| A | 0 | 46239 | 0 |
| B | 0 | 46114 | 0 |
| C | 0 | 63018 | 0 |
| D | 0 | 47612 | 0 |
| Mode M9 | |||
|---|---|---|---|
| Quadrant | BADHDUFLAG | Total packets | Discarded packets |
| A | 0 | 38 | 0 |
| B | 0 | 38 | 0 |
| C | 0 | 38 | 0 |
| D | 0 | 38 | 0 |
| Quadrant | Total seconds | Saturated seconds | Saturation percentage |
|---|---|---|---|
| A | 22002 | 248 | 1.127170% |
| B | 22003 | 267 | 1.213471% |
| C | 22002 | 2463 | 11.194437% |
| D | 22003 | 186 | 0.845339% |
Noise dominated data is calculated using 1-second bins in cleaned event files. If a bin has >2000 counts, and if more than 50% of those come from <1% of pixels, then it is considered to be noise-dominated and hence unusable.
| Quadrant | # 1 sec bins | Bins with >0 counts | Bins with >2000 counts | High rate bins dominated by noise | Noise dominated (total time) | Noise dominated (detector-on time) | Marked lightcurve |
|---|---|---|---|---|---|---|---|
| A | 25732 | 22006 | 10 | 10 | 0.04% | 0.05% | 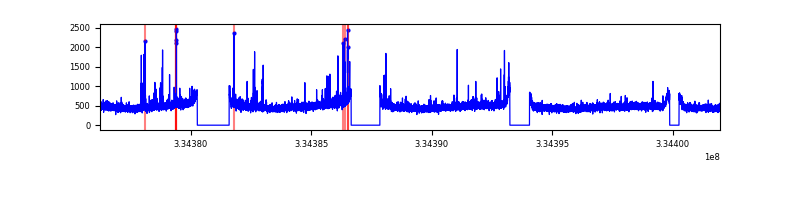 |
| B | 25733 | 22007 | 13 | 13 | 0.05% | 0.06% | 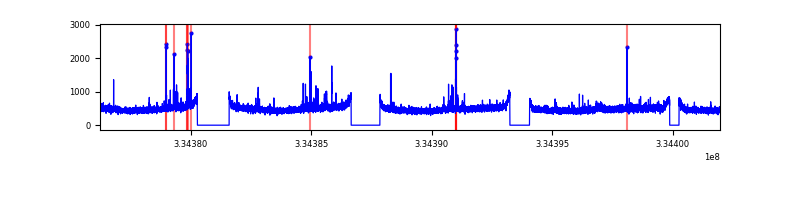 |
| C | 25733 | 22007 | 1789 | 1789 | 6.95% | 8.13% | 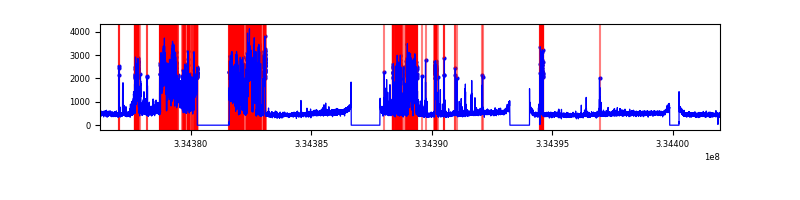 |
| D | 25733 | 22007 | 46 | 46 | 0.18% | 0.21% | 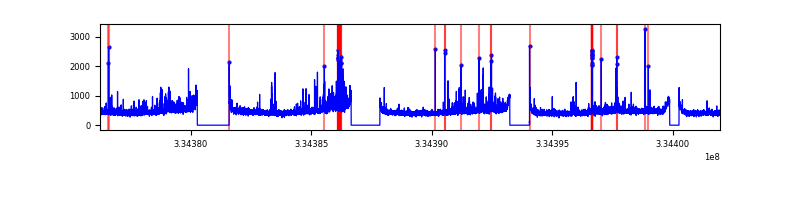 |
Top three noisy pixels from each quadrant. If the there are fewer than three noisy pixels in the level2.evt file, extra rows are filled as -1
| Pixel properties | Quadrant properties | ||||||
|---|---|---|---|---|---|---|---|
| Quadrant | DetID | PixID | Counts | Sigma | Mean | Median | Sigma |
| A | 0 | 13 | 308588 | 566.97 | 2709 | 2650 | 539.6 |
| A | 13 | 254 | 35171 | 60.27 | 2709 | 2650 | 539.6 |
| A | 12 | 16 | 31282 | 53.06 | 2709 | 2650 | 539.6 |
| B | 0 | 245 | 80737 | 153.33 | 2714 | 2647 | 509.3 |
| B | 5 | 172 | 66462 | 125.3 | 2714 | 2647 | 509.3 |
| B | 12 | 111 | 61464 | 115.49 | 2714 | 2647 | 509.3 |
| C | 2 | 16 | 5958826 | 10415.95 | 2484 | 2503 | 571.8 |
| C | 14 | 238 | 399024 | 693.4 | 2484 | 2503 | 571.8 |
| C | 4 | 254 | 206769 | 357.2 | 2484 | 2503 | 571.8 |
| D | 1 | 52 | 562432 | 895.83 | 2627 | 2560 | 625.0 |
| D | 12 | 233 | 109295 | 170.78 | 2627 | 2560 | 625.0 |
| D | 13 | 168 | 107941 | 168.61 | 2627 | 2560 | 625.0 |
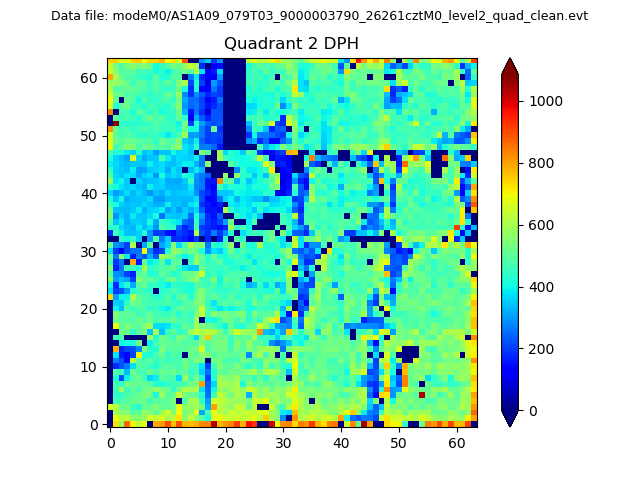
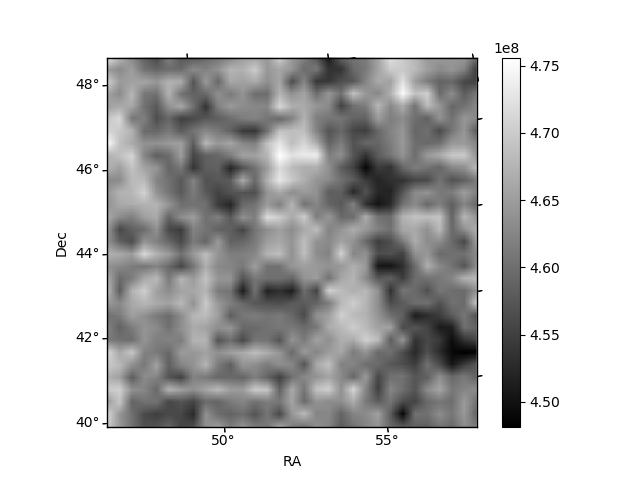
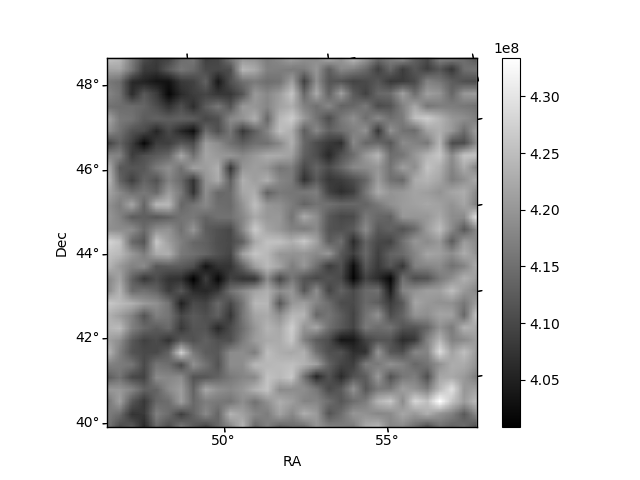
Histogram calculated using DETX and DETY for each event in the final _common_clean file
| Quadrant A | 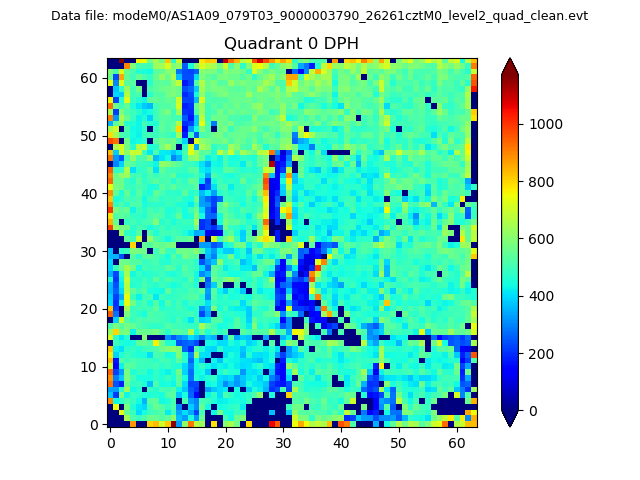 |
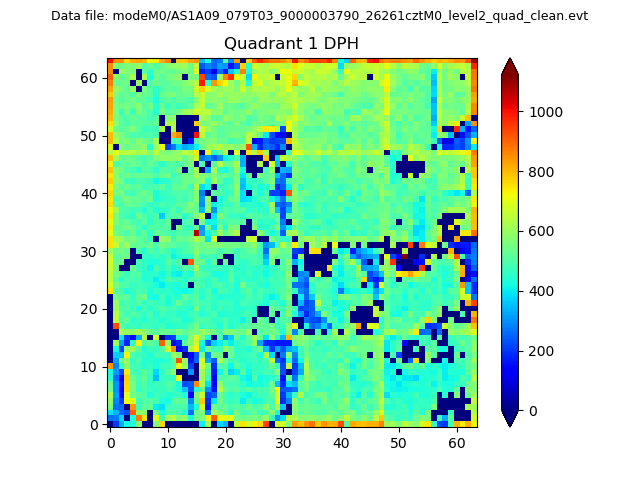 |
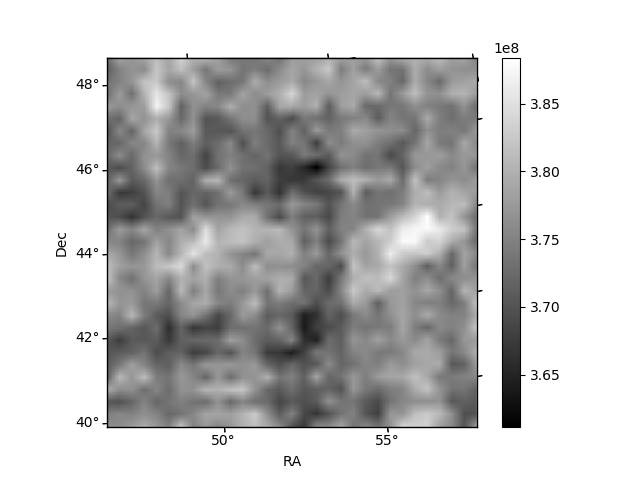
Quadrant B |
|---|---|---|---|
| Quadrant D | 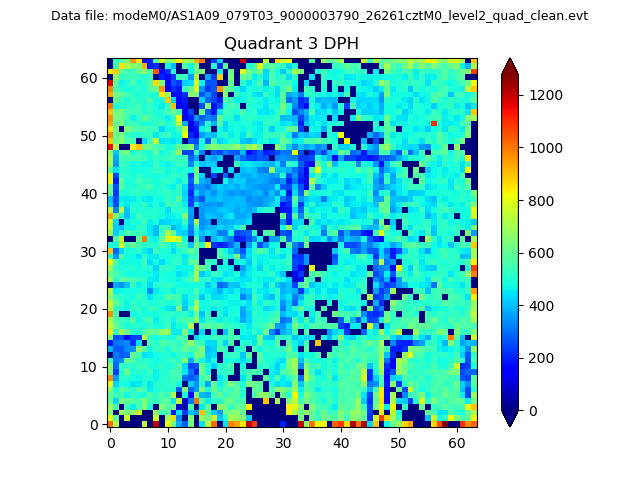 |
 |
Quadrant C |
| Plot type | Count rate plots | Images |
|---|---|---|
| Comparison with Poisson distribution Blue bars denote a histogram of data divided into 1 sec bins. Red curve is a Poisson curve with rate = median count rate of data. |
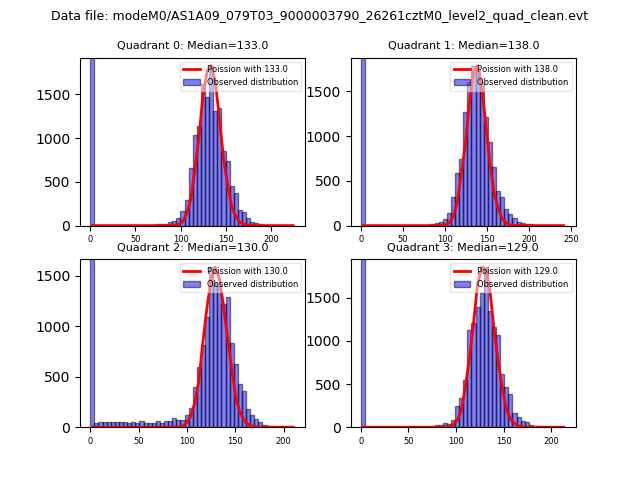 |
 |
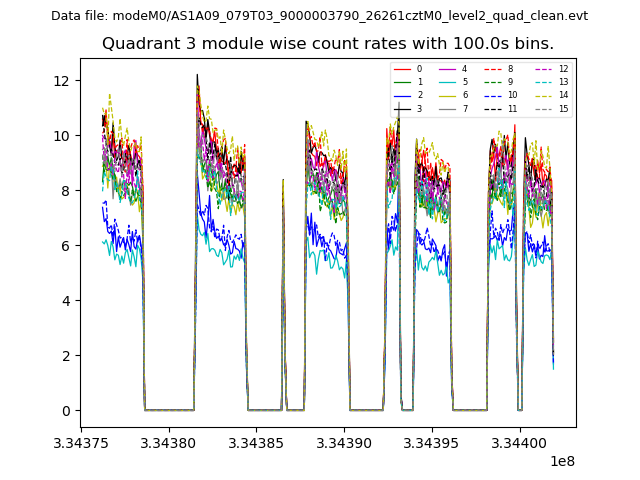
| Quadrant-wise count rates Data is divided into 100 sec bins |
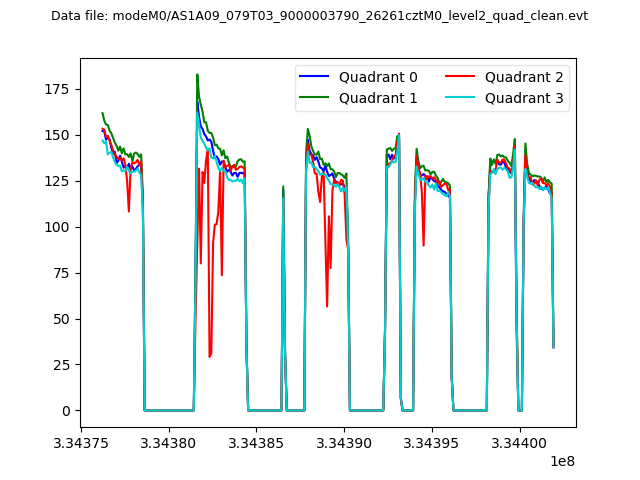 |
|
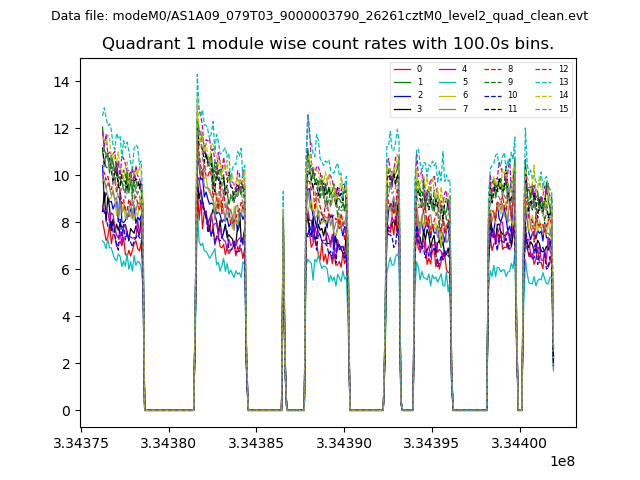
| Module-wise count rates for Quadrant A Data is divided into 100 sec bins |
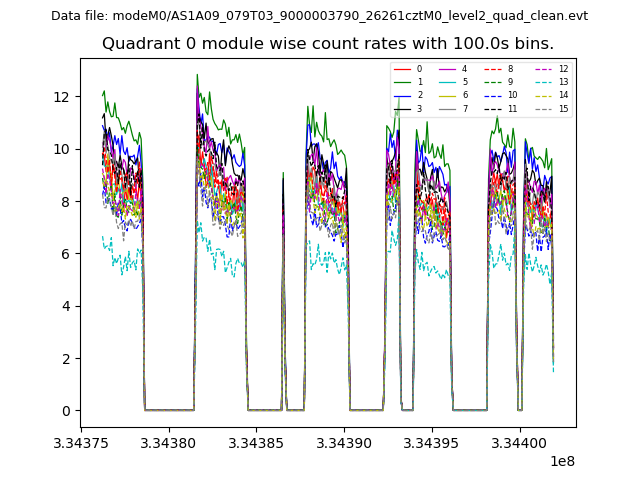 |
 |
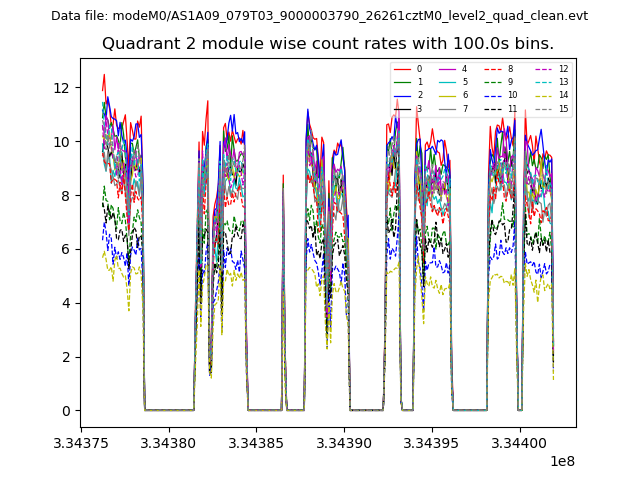
| Module-wise count rates for Quadrant B Data is divided into 100 sec bins |
 |
 |
| Module-wise count rates for Quadrant C Data is divided into 100 sec bins |
 |
 |
| Module-wise count rates for Quadrant D Data is divided into 100 sec bins |
 |
 |
| Parameter | Plot |
|---|---|
| CZT HV Monitor | 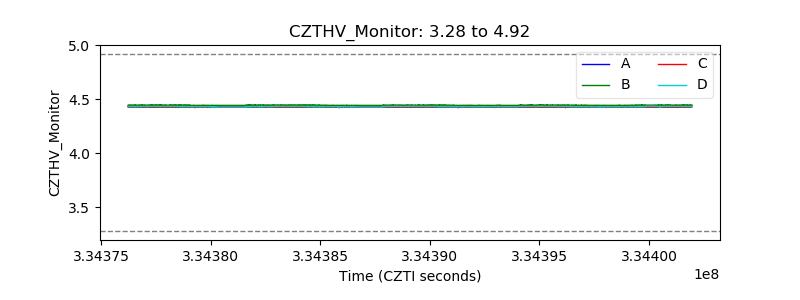 |
| D_VDD | 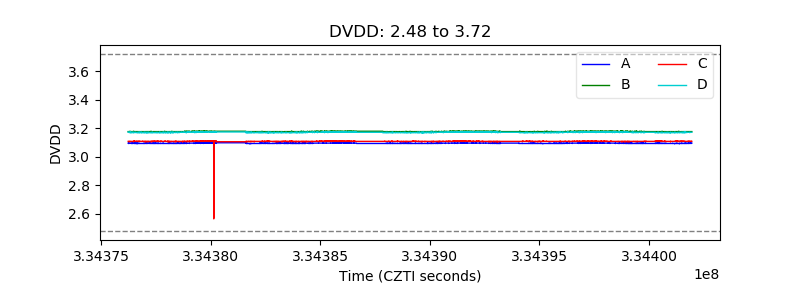 |
| Temperature 1 | 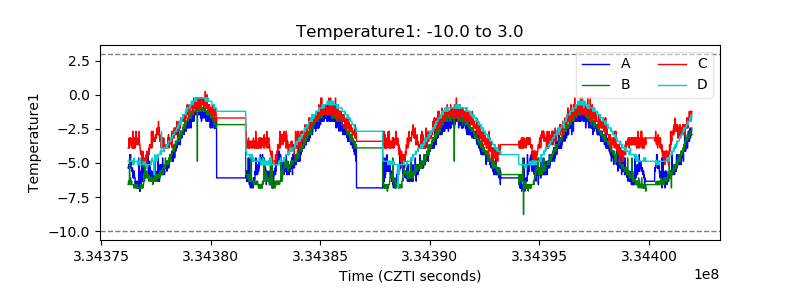 |
| Veto HV Monitor | 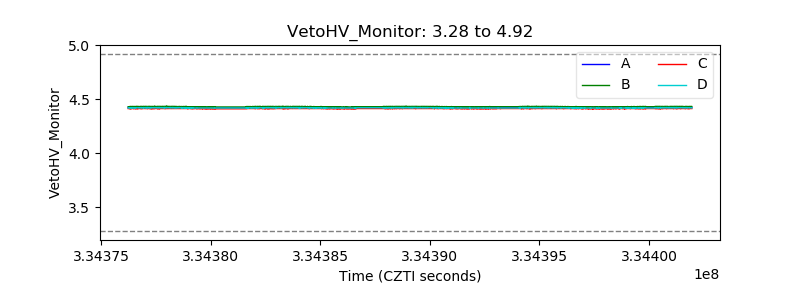 |
| Veto LLD |  |
| Alpha Counter | 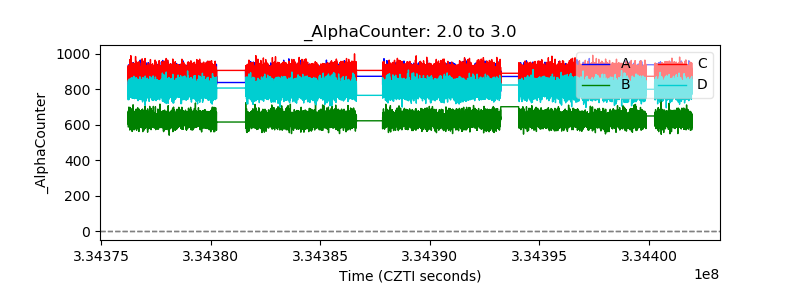 |
| _CPM_Rate | 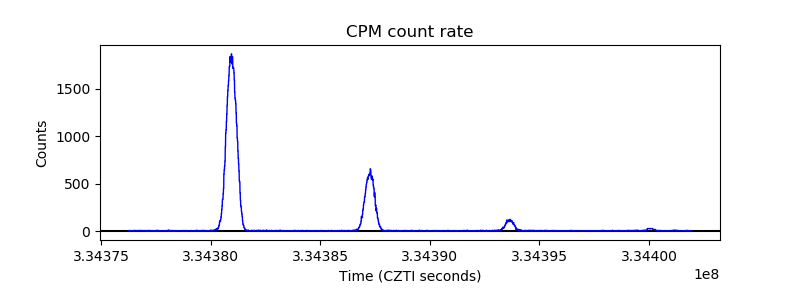 |
| CZT Counter | 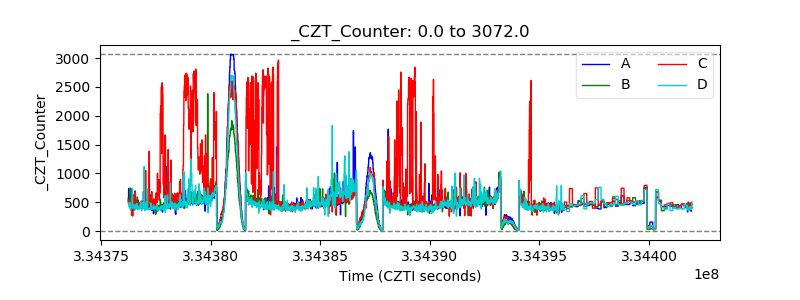 |
| +2.5 Volts monitor |  |
| +5 Volts monitor |  |
| _ROLL_ROT | 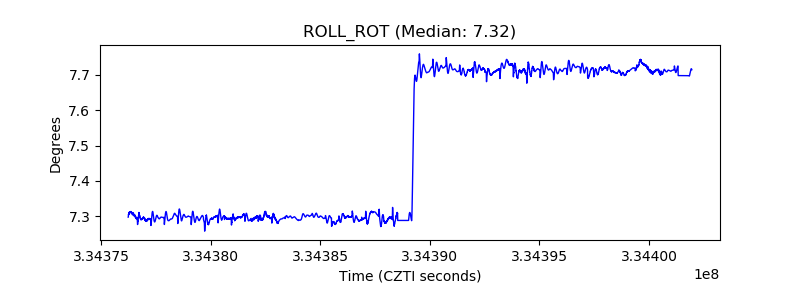 |
| _Roll_DEC | 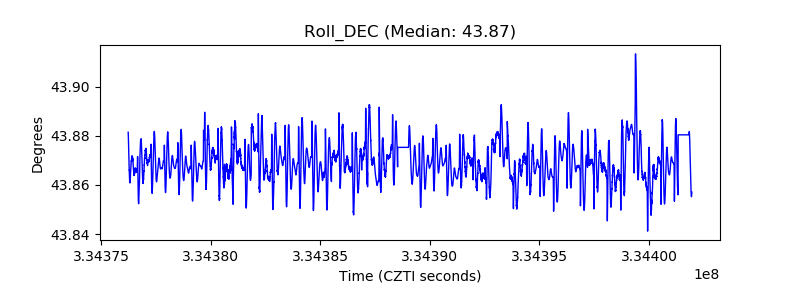 |
| _Roll_RA | 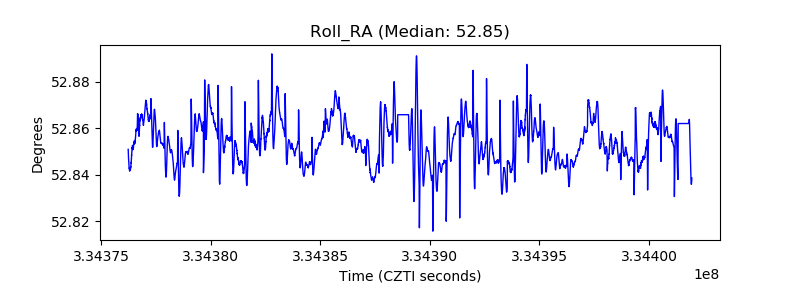 |
| Veto Counter | 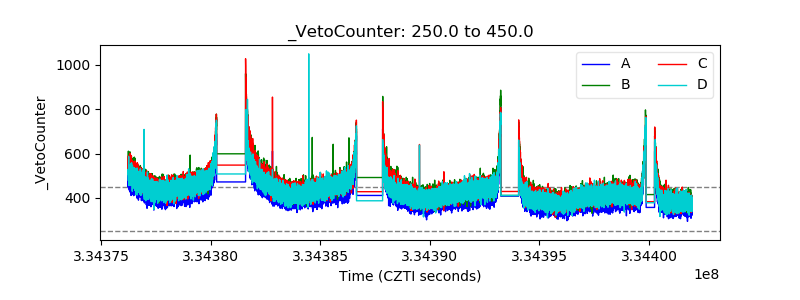 |