| Param | Original file | Final file |
|---|---|---|
| Filename | modeM0/AS1A09_079T03_9000003790_26262cztM0_level2.evt | modeM0/AS1A09_079T03_9000003790_26262cztM0_level2_quad_clean.evt |
| Size (bytes) | 459,581,760 | 95,230,080 |
| Size | 438.3 MB | 90.8 MB |
| Events in quadrant A | 3,348,273 | 594,599 |
| Events in quadrant B | 3,301,223 | 615,760 |
| Events in quadrant C | 3,399,481 | 598,668 |
| Events in quadrant D | 3,392,392 | 586,173 |
| Mode M0 | |||
|---|---|---|---|
| Quadrant | BADHDUFLAG | Total packets | Discarded packets |
| A | 0 | 14533 | 0 |
| B | 0 | 14334 | 0 |
| C | 0 | 14539 | 0 |
| D | 0 | 14974 | 0 |
| Mode M9 | |||
|---|---|---|---|
| Quadrant | BADHDUFLAG | Total packets | Discarded packets |
| A | 0 | 2 | 0 |
| B | 0 | 2 | 0 |
| C | 0 | 2 | 0 |
| D | 0 | 2 | 0 |
| Quadrant | Total seconds | Saturated seconds | Saturation percentage |
|---|---|---|---|
| A | 7007 | 152 | 2.169259% |
| B | 7008 | 149 | 2.126142% |
| C | 7008 | 174 | 2.482877% |
| D | 7008 | 145 | 2.069064% |
Noise dominated data is calculated using 1-second bins in cleaned event files. If a bin has >2000 counts, and if more than 50% of those come from <1% of pixels, then it is considered to be noise-dominated and hence unusable.
| Quadrant | # 1 sec bins | Bins with >0 counts | Bins with >2000 counts | High rate bins dominated by noise | Noise dominated (total time) | Noise dominated (detector-on time) | Marked lightcurve |
|---|---|---|---|---|---|---|---|
| A | 7242 | 7009 | 6 | 6 | 0.08% | 0.09% | 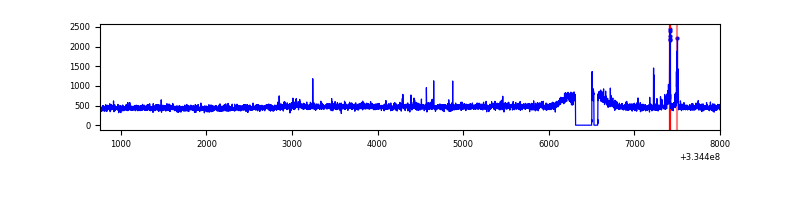 |
| B | 7243 | 7010 | 0 | 0 | 0.00% | 0.00% | 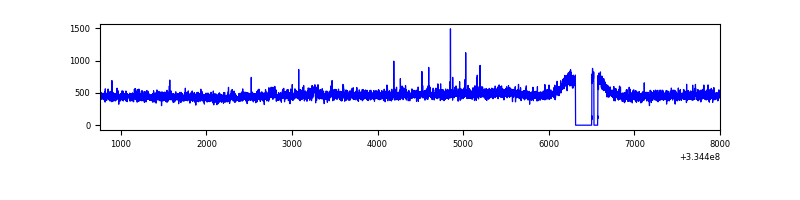 |
| C | 7243 | 7010 | 4 | 4 | 0.06% | 0.06% | 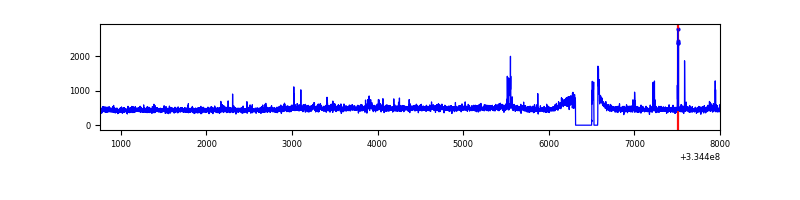 |
| D | 7243 | 7010 | 15 | 15 | 0.21% | 0.21% | 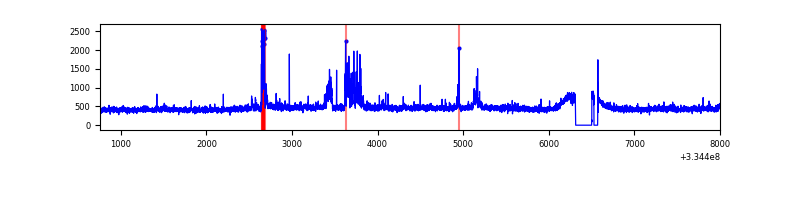 |
Top three noisy pixels from each quadrant. If the there are fewer than three noisy pixels in the level2.evt file, extra rows are filled as -1
| Pixel properties | Quadrant properties | ||||||
|---|---|---|---|---|---|---|---|
| Quadrant | DetID | PixID | Counts | Sigma | Mean | Median | Sigma |
| A | 0 | 13 | 69636 | 406.93 | 838 | 819 | 169.1 |
| A | 12 | 16 | 31585 | 181.92 | 838 | 819 | 169.1 |
| A | 13 | 254 | 11282 | 61.87 | 838 | 819 | 169.1 |
| B | 12 | 111 | 20139 | 120.01 | 837 | 815 | 161.0 |
| B | 11 | 111 | 17762 | 105.25 | 837 | 815 | 161.0 |
| B | 14 | 111 | 15286 | 89.87 | 837 | 815 | 161.0 |
| C | 14 | 238 | 128789 | 677.22 | 805 | 809 | 189.0 |
| C | 3 | 233 | 128529 | 675.84 | 805 | 809 | 189.0 |
| C | 13 | 61 | 5457 | 24.6 | 805 | 809 | 189.0 |
| D | 12 | 227 | 122190 | 621.23 | 814 | 793 | 195.4 |
| D | 6 | 2 | 102888 | 522.45 | 814 | 793 | 195.4 |
| D | 1 | 52 | 50390 | 253.8 | 814 | 793 | 195.4 |
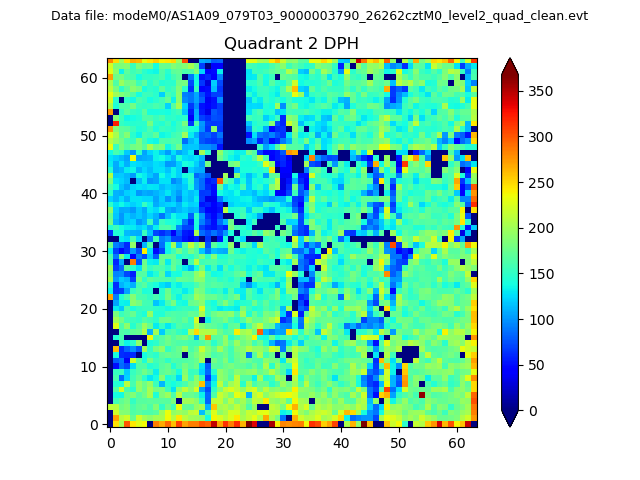
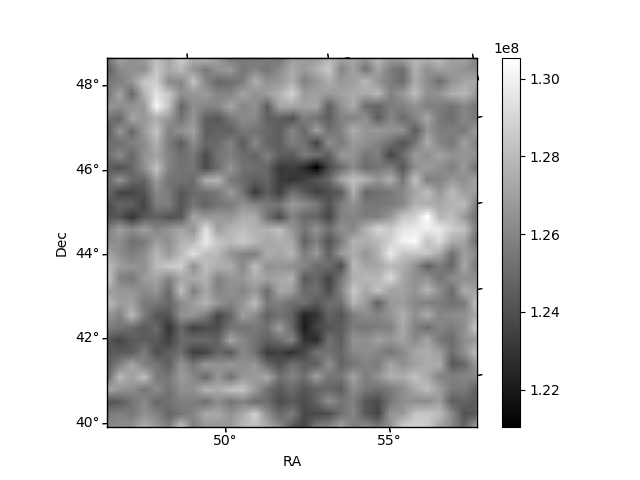
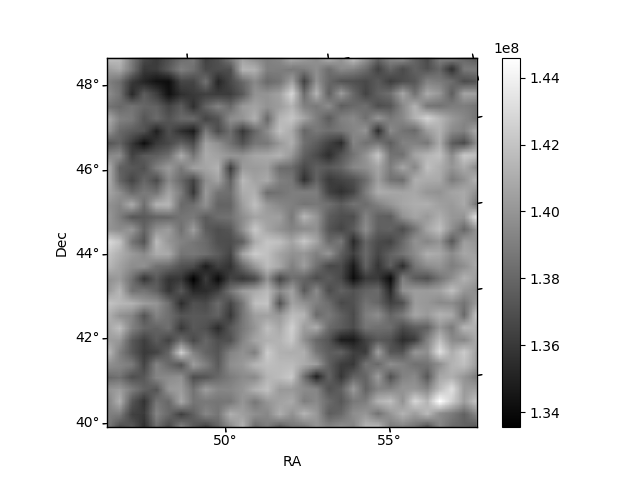
Histogram calculated using DETX and DETY for each event in the final _common_clean file
| Quadrant A |  |
 |
Quadrant B |
|---|---|---|---|
| Quadrant D | 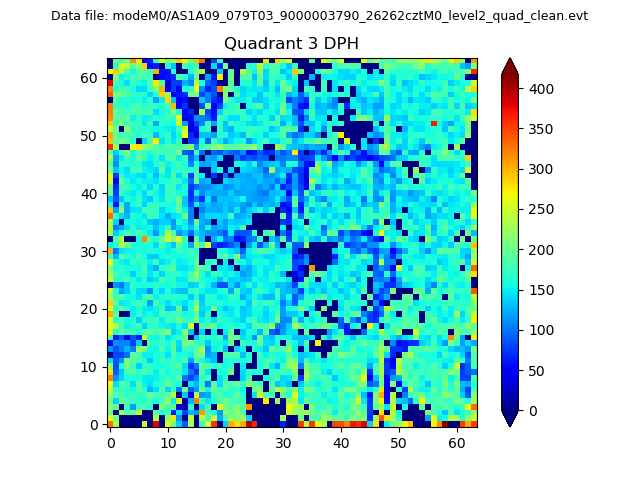 |
 |
Quadrant C |
| Plot type | Count rate plots | Images |
|---|---|---|
| Comparison with Poisson distribution Blue bars denote a histogram of data divided into 1 sec bins. Red curve is a Poisson curve with rate = median count rate of data. |
 |
 |
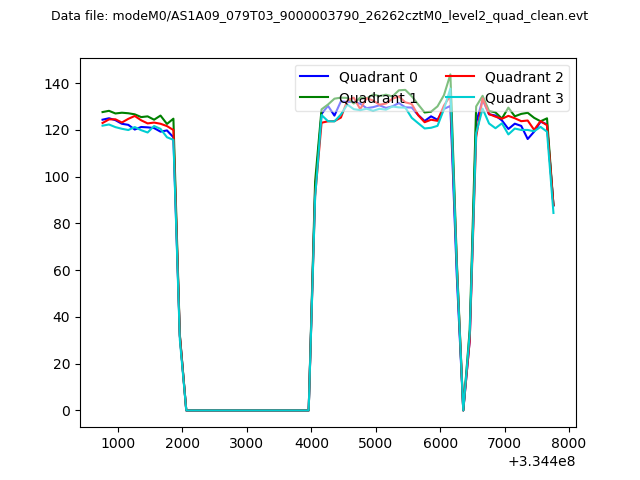
| Quadrant-wise count rates Data is divided into 100 sec bins |
 |
|
| Module-wise count rates for Quadrant A Data is divided into 100 sec bins |
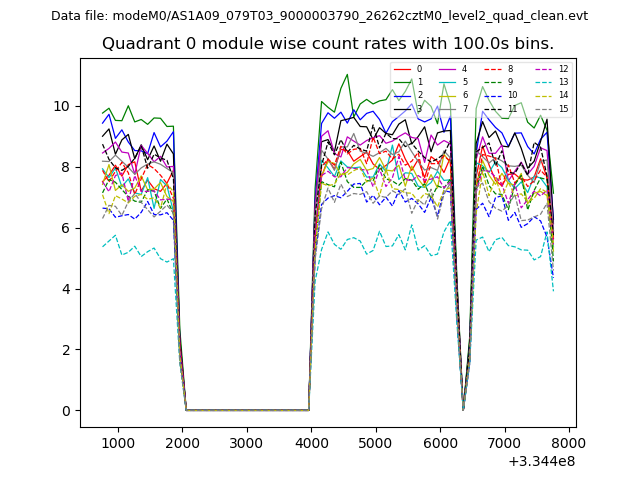 |
 |
| Module-wise count rates for Quadrant B Data is divided into 100 sec bins |
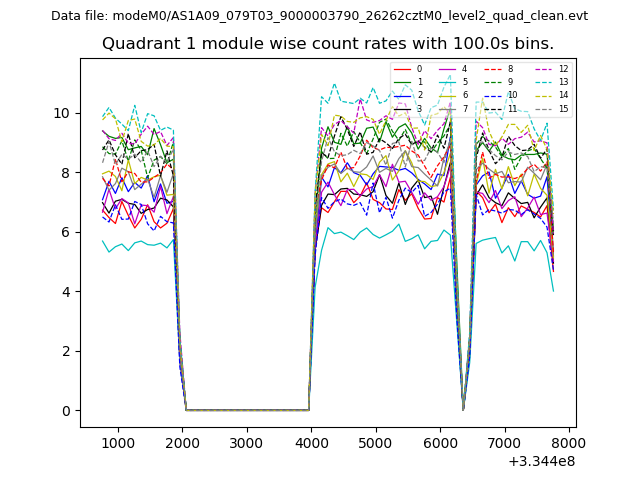 |
 |
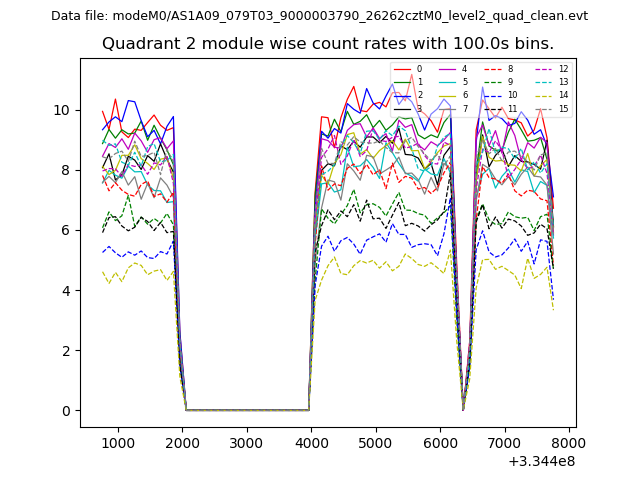
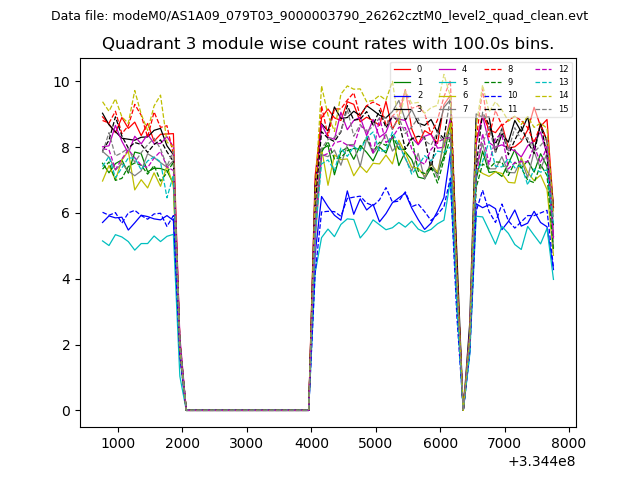
| Module-wise count rates for Quadrant C Data is divided into 100 sec bins |
 |
 |
| Module-wise count rates for Quadrant D Data is divided into 100 sec bins |
 |
 |
| Parameter | Plot |
|---|---|
| CZT HV Monitor |  |
| D_VDD | 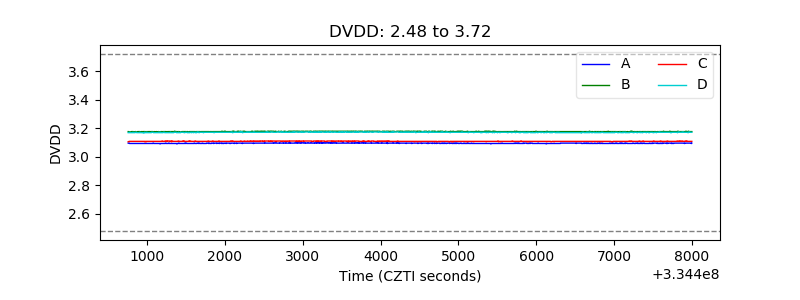 |
| Temperature 1 | 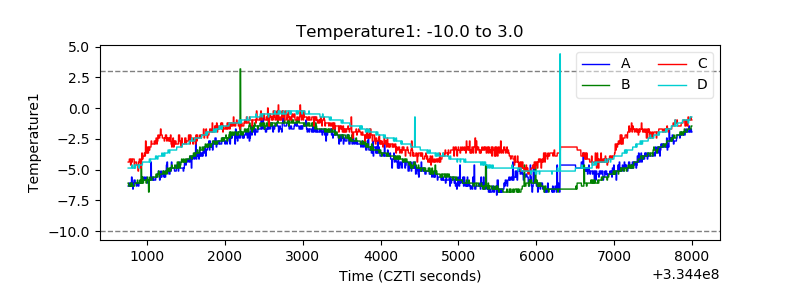 |
| Veto HV Monitor | 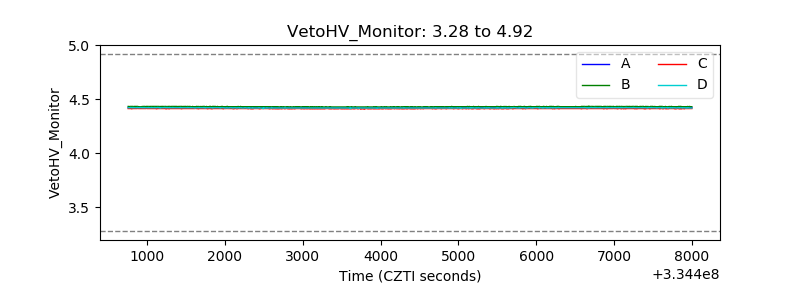 |
| Veto LLD | 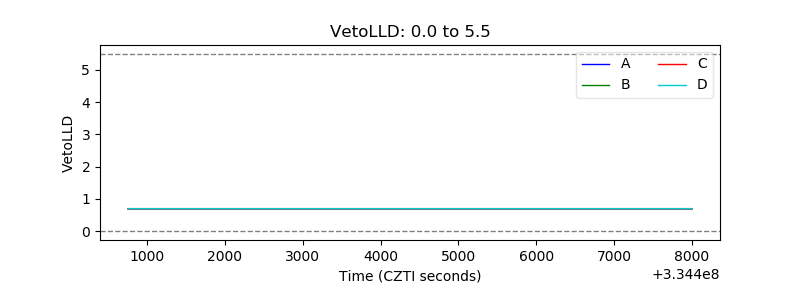 |
| Alpha Counter | 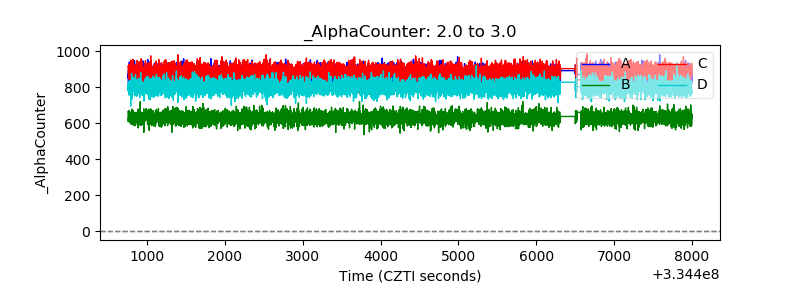 |
| _CPM_Rate | 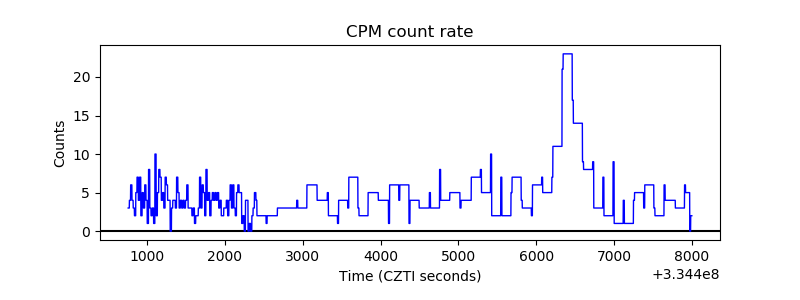 |
| CZT Counter | 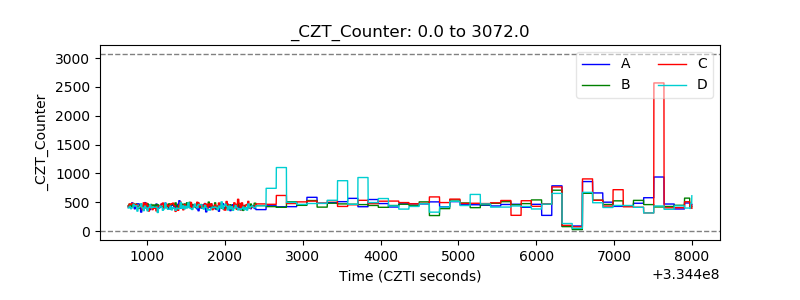 |
| +2.5 Volts monitor |  |
| +5 Volts monitor |  |
| _ROLL_ROT | 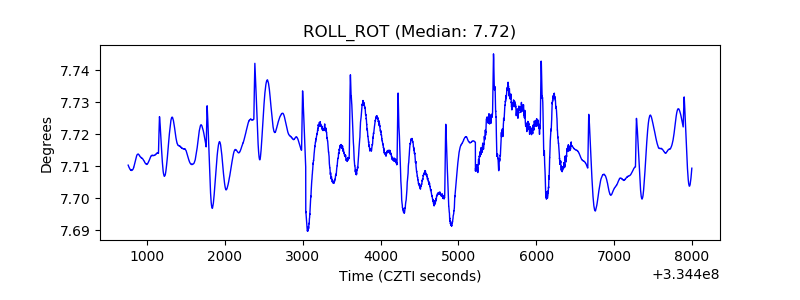 |
| _Roll_DEC | 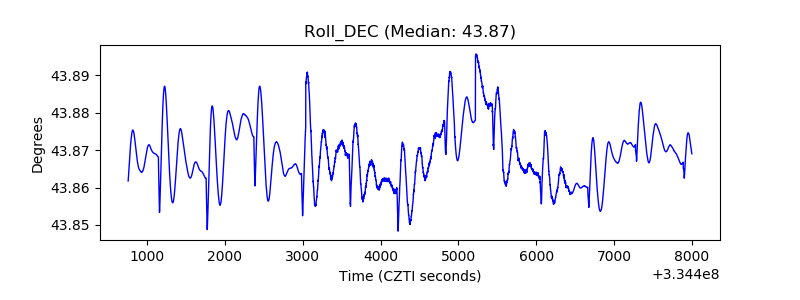 |
| _Roll_RA | 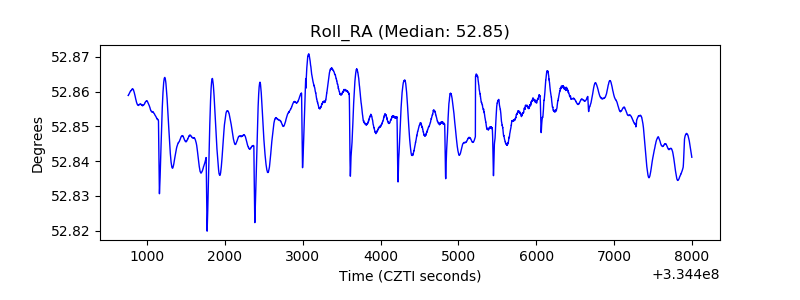 |
| Veto Counter | 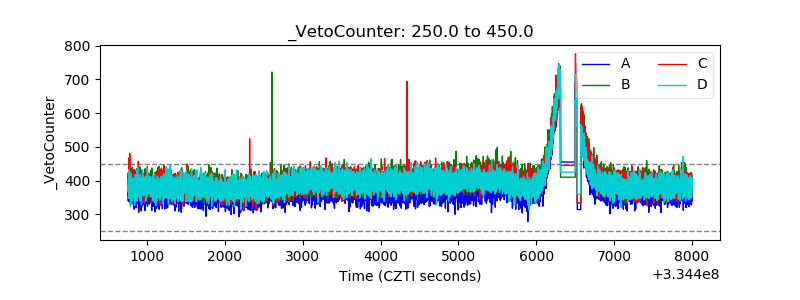 |