| Param | Original file | Final file |
|---|---|---|
| Filename | modeM0/AS1A09_079T03_9000003790_26263cztM0_level2.evt | modeM0/AS1A09_079T03_9000003790_26263cztM0_level2_quad_clean.evt |
| Size (bytes) | 494,683,200 | 90,774,720 |
| Size | 471.8 MB | 86.6 MB |
| Events in quadrant A | 3,726,699 | 555,160 |
| Events in quadrant B | 3,640,130 | 573,002 |
| Events in quadrant C | 3,713,191 | 559,868 |
| Events in quadrant D | 3,400,147 | 547,376 |
| Mode M0 | |||
|---|---|---|---|
| Quadrant | BADHDUFLAG | Total packets | Discarded packets |
| A | 0 | 15877 | 0 |
| B | 0 | 15443 | 0 |
| C | 0 | 15621 | 0 |
| D | 0 | 15220 | 0 |
| Mode M9 | |||
|---|---|---|---|
| Quadrant | BADHDUFLAG | Total packets | Discarded packets |
| A | 0 | 4 | 0 |
| B | 0 | 4 | 0 |
| C | 0 | 4 | 0 |
| D | 0 | 4 | 0 |
| Quadrant | Total seconds | Saturated seconds | Saturation percentage |
|---|---|---|---|
| A | 7374 | 154 | 2.088419% |
| B | 7374 | 144 | 1.952807% |
| C | 7374 | 146 | 1.979929% |
| D | 7375 | 68 | 0.922034% |
Noise dominated data is calculated using 1-second bins in cleaned event files. If a bin has >2000 counts, and if more than 50% of those come from <1% of pixels, then it is considered to be noise-dominated and hence unusable.
| Quadrant | # 1 sec bins | Bins with >0 counts | Bins with >2000 counts | High rate bins dominated by noise | Noise dominated (total time) | Noise dominated (detector-on time) | Marked lightcurve |
|---|---|---|---|---|---|---|---|
| A | 7754 | 7375 | 46 | 46 | 0.59% | 0.62% | 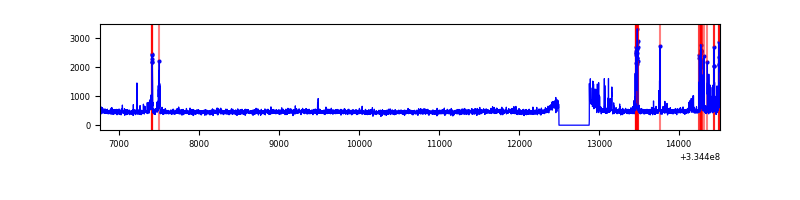 |
| B | 7754 | 7375 | 38 | 38 | 0.49% | 0.52% | 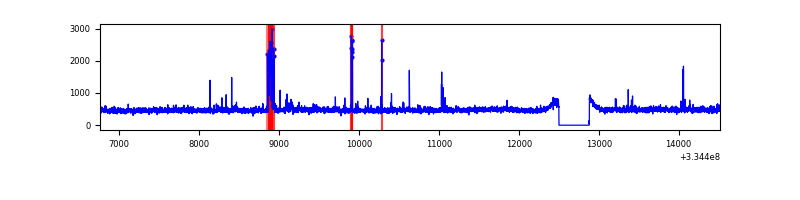 |
| C | 7754 | 7375 | 21 | 21 | 0.27% | 0.28% | 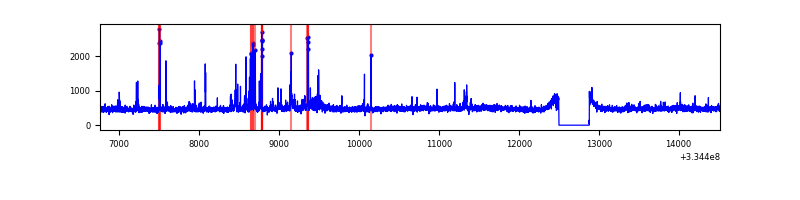 |
| D | 7755 | 7376 | 3 | 3 | 0.04% | 0.04% | 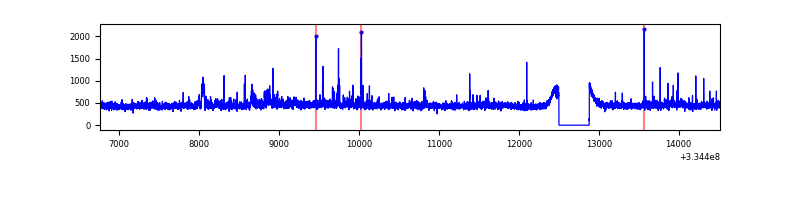 |
Top three noisy pixels from each quadrant. If the there are fewer than three noisy pixels in the level2.evt file, extra rows are filled as -1
| Pixel properties | Quadrant properties | ||||||
|---|---|---|---|---|---|---|---|
| Quadrant | DetID | PixID | Counts | Sigma | Mean | Median | Sigma |
| A | 0 | 13 | 316669 | 1767.14 | 881 | 860 | 178.7 |
| A | 13 | 254 | 11832 | 61.39 | 881 | 860 | 178.7 |
| A | 3 | 137 | 8582 | 43.21 | 881 | 860 | 178.7 |
| B | 5 | 172 | 146828 | 855.37 | 879 | 854 | 170.7 |
| B | 0 | 230 | 27132 | 153.98 | 879 | 854 | 170.7 |
| B | 12 | 111 | 20598 | 115.69 | 879 | 854 | 170.7 |
| C | 3 | 233 | 220223 | 1100.67 | 846 | 851 | 199.3 |
| C | 14 | 238 | 134232 | 669.22 | 846 | 851 | 199.3 |
| C | 4 | 254 | 58415 | 288.82 | 846 | 851 | 199.3 |
| D | 1 | 52 | 67454 | 322.04 | 857 | 834 | 206.9 |
| D | 12 | 233 | 41096 | 194.63 | 857 | 834 | 206.9 |
| D | 2 | 234 | 34633 | 163.39 | 857 | 834 | 206.9 |
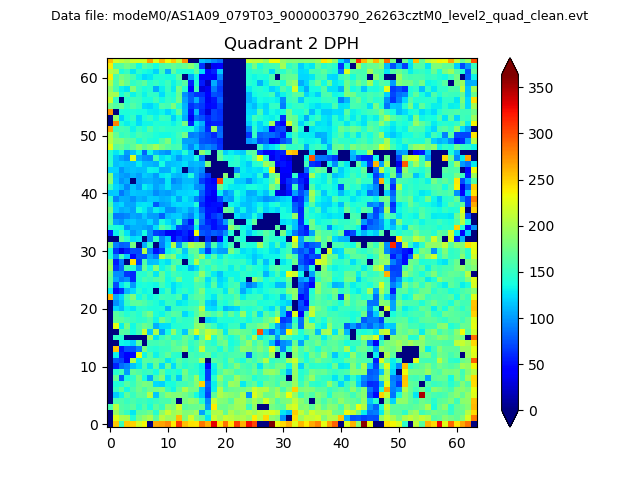
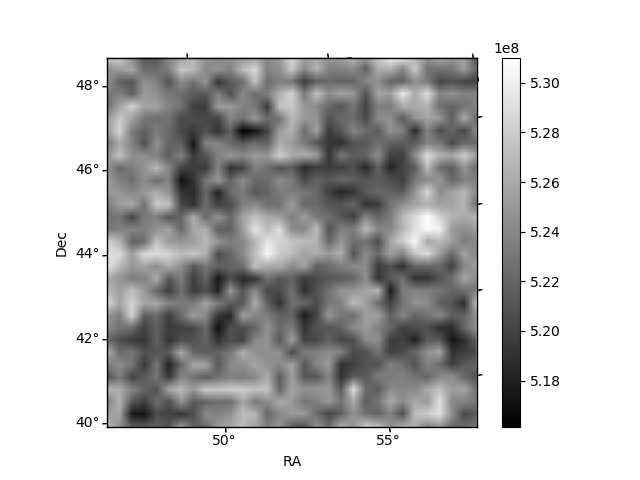
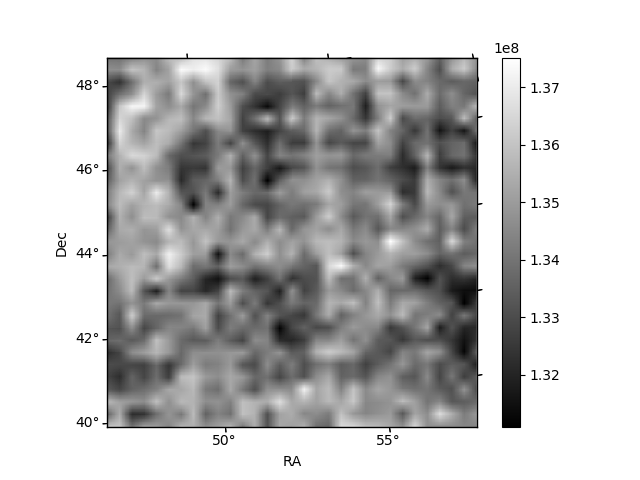
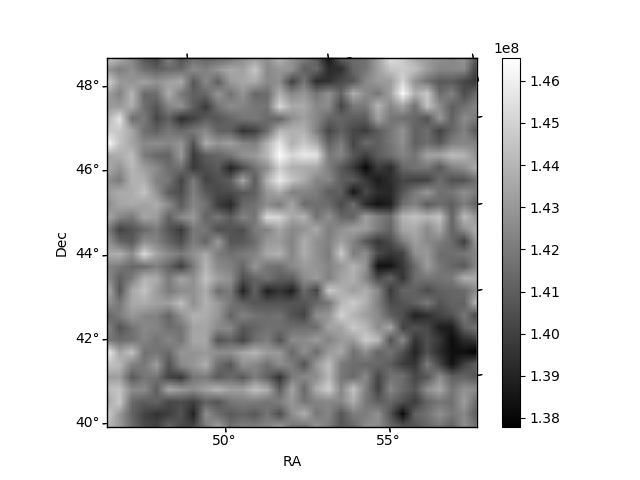
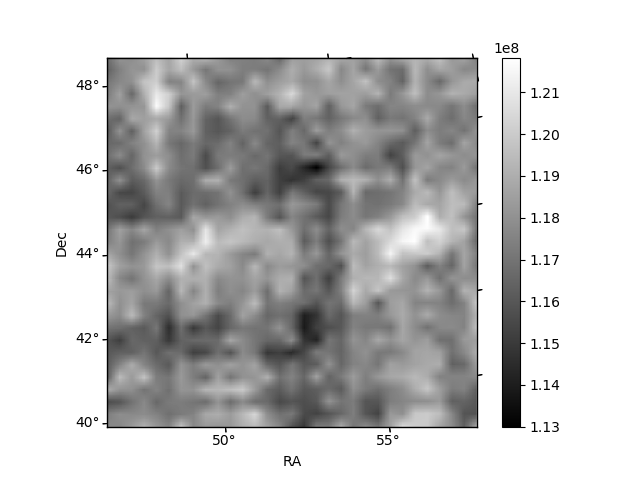
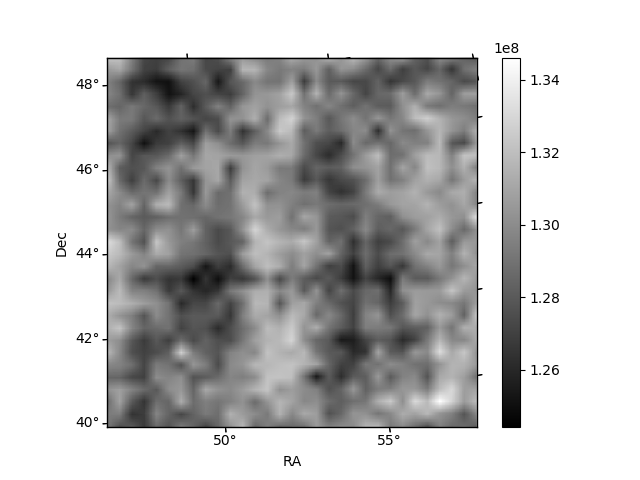
Histogram calculated using DETX and DETY for each event in the final _common_clean file
| Quadrant A | 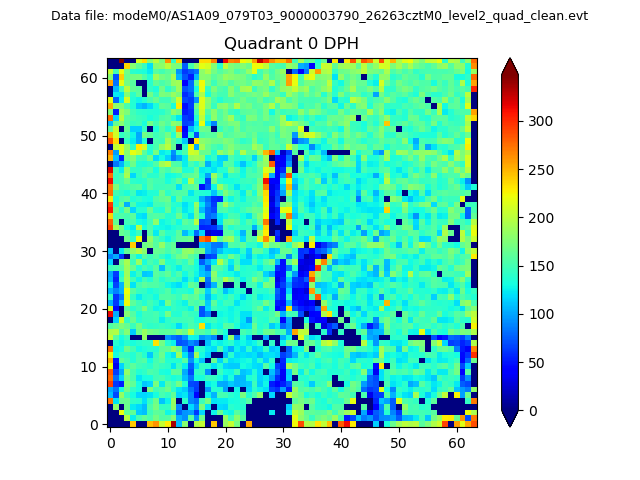 |
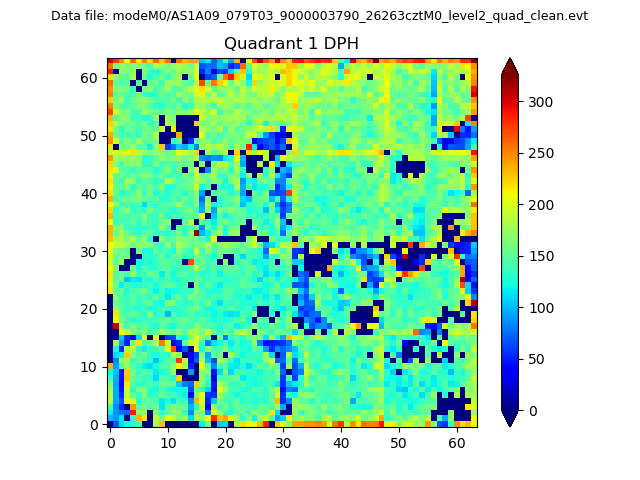 |
Quadrant B |
|---|---|---|---|
| Quadrant D | 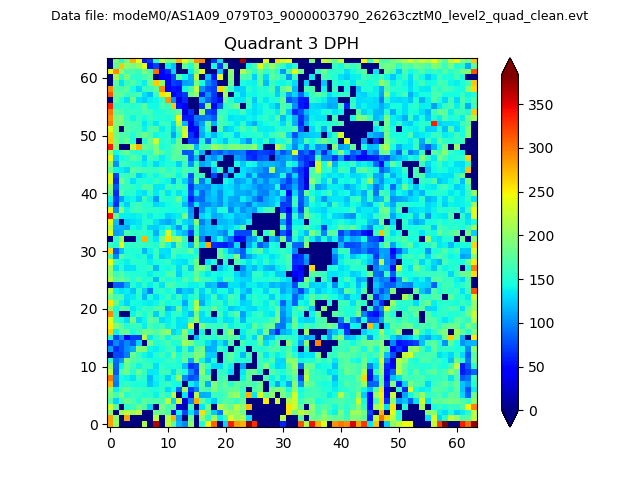 |
 |
Quadrant C |
| Plot type | Count rate plots | Images |
|---|---|---|
| Comparison with Poisson distribution Blue bars denote a histogram of data divided into 1 sec bins. Red curve is a Poisson curve with rate = median count rate of data. |
 |
 |
| Quadrant-wise count rates Data is divided into 100 sec bins |
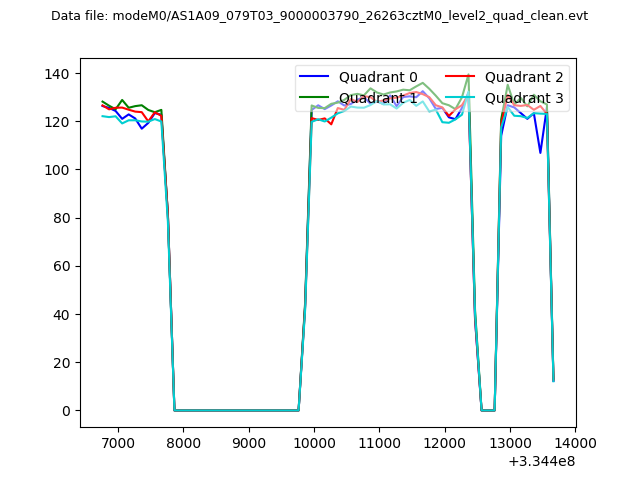 |
|
| Module-wise count rates for Quadrant A Data is divided into 100 sec bins |
 |
 |
| Module-wise count rates for Quadrant B Data is divided into 100 sec bins |
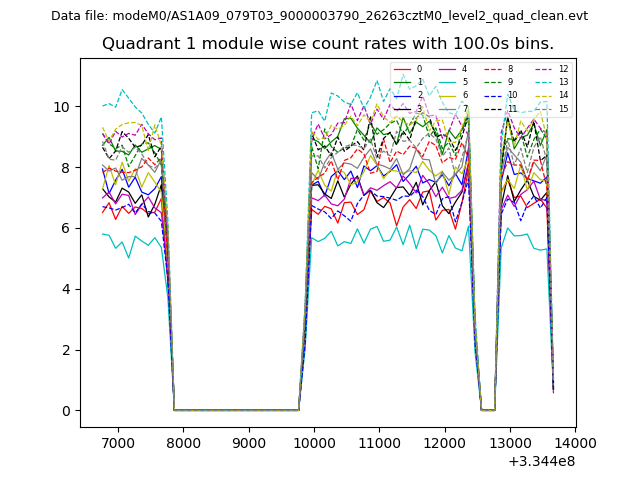 |
 |
| Module-wise count rates for Quadrant C Data is divided into 100 sec bins |
 |
 |
| Module-wise count rates for Quadrant D Data is divided into 100 sec bins |
 |
 |
| Parameter | Plot |
|---|---|
| CZT HV Monitor |  |
| D_VDD | 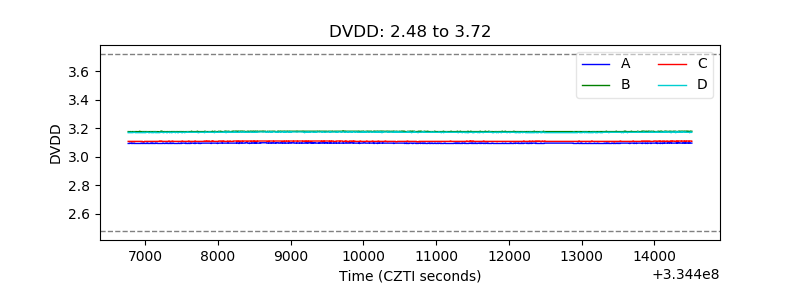 |
| Temperature 1 | 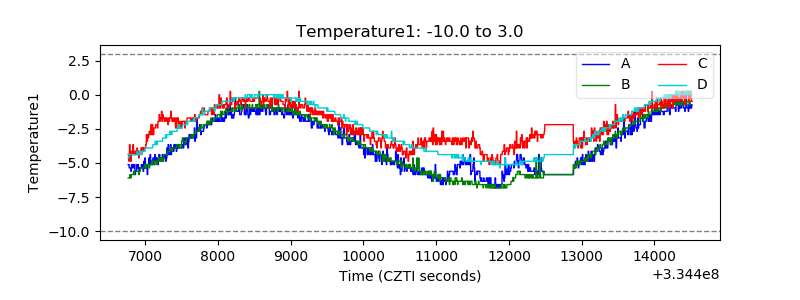 |
| Veto HV Monitor | 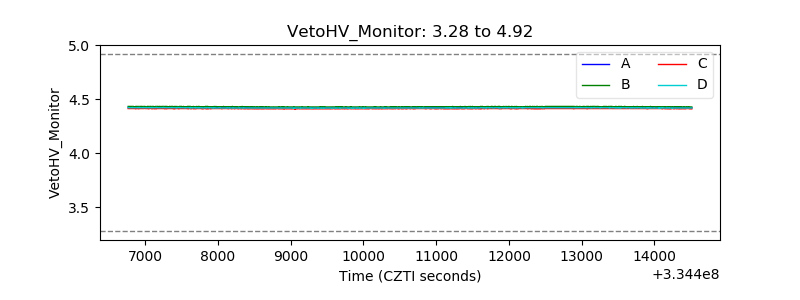 |
| Veto LLD | 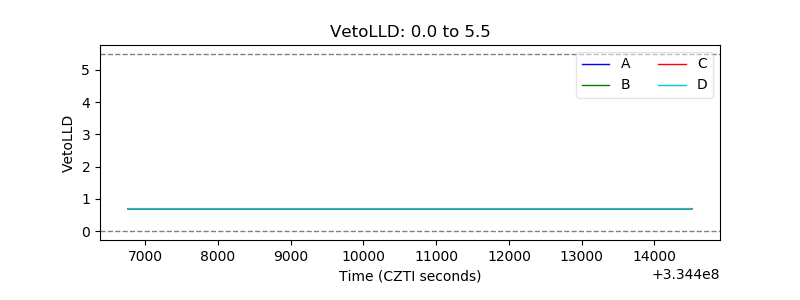 |
| Alpha Counter | 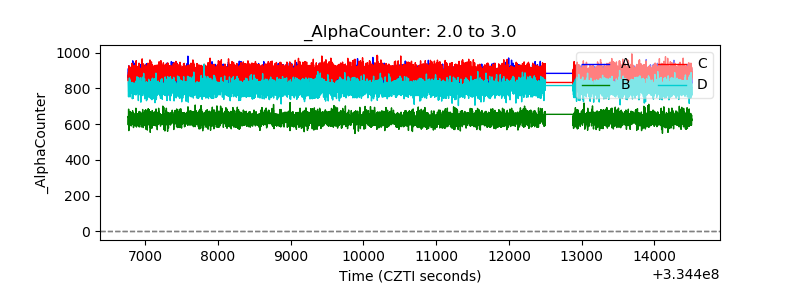 |
| _CPM_Rate | 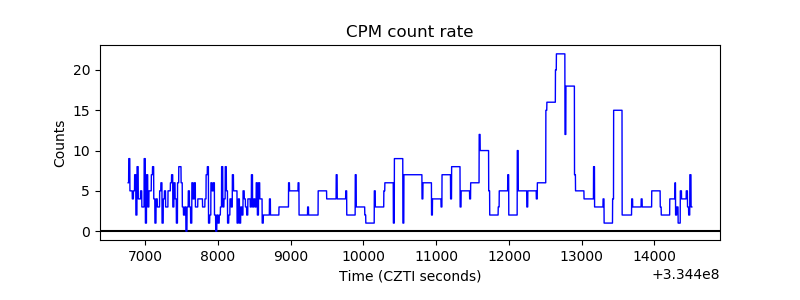 |
| CZT Counter | 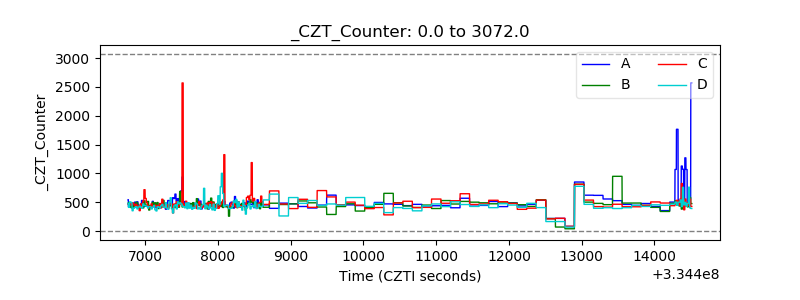 |
| +2.5 Volts monitor |  |
| +5 Volts monitor |  |
| _ROLL_ROT |  |
| _Roll_DEC | 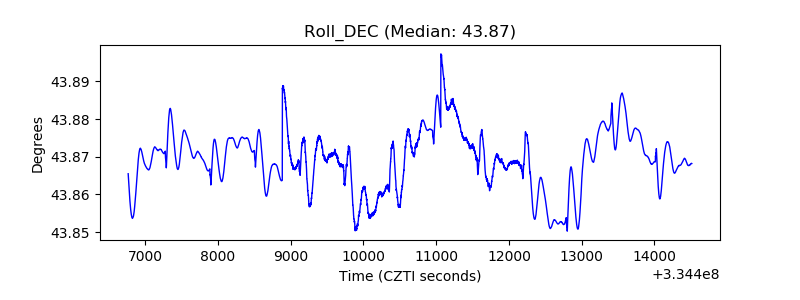 |
| _Roll_RA | 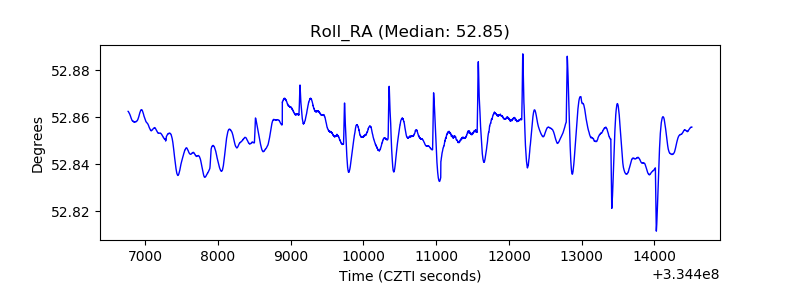 |
| Veto Counter |  |