| Param | Original file | Final file |
|---|---|---|
| Filename | modeM0/AS1A09_079T03_9000003790_26265cztM0_level2.evt | modeM0/AS1A09_079T03_9000003790_26265cztM0_level2_quad_clean.evt |
| Size (bytes) | 748,411,200 | 141,197,760 |
| Size | 713.7 MB | 134.7 MB |
| Events in quadrant A | 5,745,056 | 874,376 |
| Events in quadrant B | 5,428,942 | 896,175 |
| Events in quadrant C | 5,638,208 | 873,161 |
| Events in quadrant D | 5,096,453 | 859,483 |
| Mode M0 | |||
|---|---|---|---|
| Quadrant | BADHDUFLAG | Total packets | Discarded packets |
| A | 0 | 24336 | 0 |
| B | 0 | 23192 | 0 |
| C | 0 | 23680 | 0 |
| D | 0 | 22895 | 0 |
| Mode M9 | |||
|---|---|---|---|
| Quadrant | BADHDUFLAG | Total packets | Discarded packets |
| A | 0 | 7 | 0 |
| B | 0 | 8 | 0 |
| C | 0 | 8 | 0 |
| D | 0 | 8 | 0 |
| Quadrant | Total seconds | Saturated seconds | Saturation percentage |
|---|---|---|---|
| A | 11175 | 175 | 1.565996% |
| B | 11175 | 136 | 1.217002% |
| C | 11175 | 207 | 1.852349% |
| D | 11175 | 76 | 0.680089% |
Noise dominated data is calculated using 1-second bins in cleaned event files. If a bin has >2000 counts, and if more than 50% of those come from <1% of pixels, then it is considered to be noise-dominated and hence unusable.
| Quadrant | # 1 sec bins | Bins with >0 counts | Bins with >2000 counts | High rate bins dominated by noise | Noise dominated (total time) | Noise dominated (detector-on time) | Marked lightcurve |
|---|---|---|---|---|---|---|---|
| A | 11705 | 11176 | 56 | 56 | 0.48% | 0.50% | 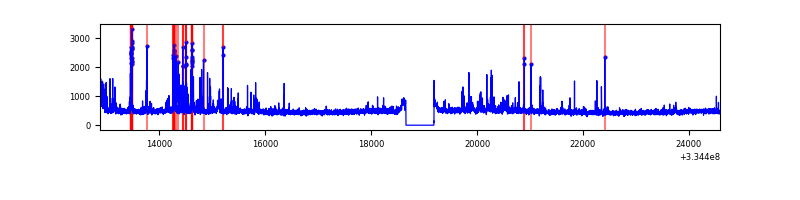 |
| B | 11705 | 11176 | 16 | 16 | 0.14% | 0.14% | 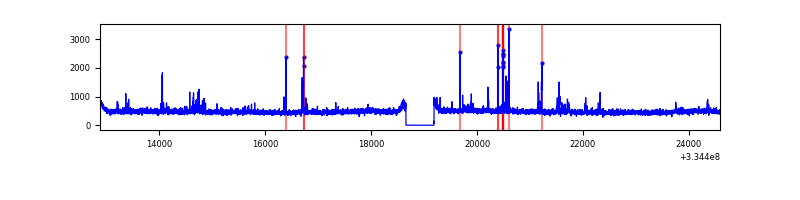 |
| C | 11705 | 11176 | 38 | 38 | 0.32% | 0.34% | 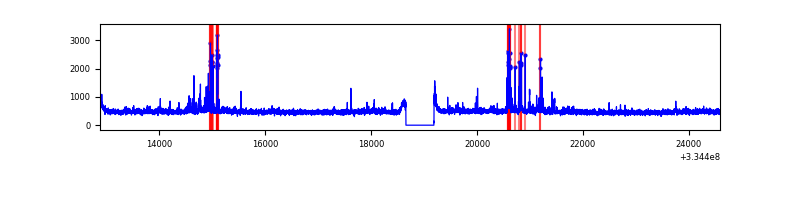 |
| D | 11705 | 11176 | 10 | 10 | 0.09% | 0.09% | 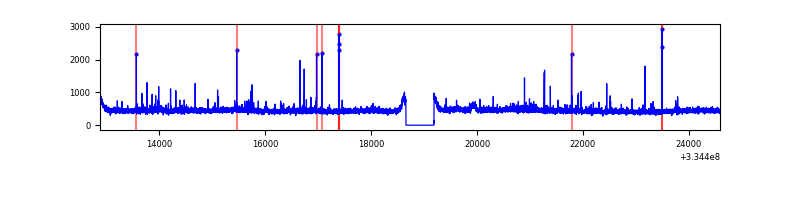 |
Top three noisy pixels from each quadrant. If the there are fewer than three noisy pixels in the level2.evt file, extra rows are filled as -1
| Pixel properties | Quadrant properties | ||||||
|---|---|---|---|---|---|---|---|
| Quadrant | DetID | PixID | Counts | Sigma | Mean | Median | Sigma |
| A | 0 | 13 | 581125 | 2147.22 | 1332 | 1300 | 270.0 |
| A | 6 | 16 | 25456 | 89.46 | 1332 | 1300 | 270.0 |
| A | 13 | 254 | 19304 | 66.67 | 1332 | 1300 | 270.0 |
| B | 5 | 172 | 137221 | 536.7 | 1334 | 1300 | 253.3 |
| B | 12 | 111 | 31154 | 117.88 | 1334 | 1300 | 253.3 |
| B | 11 | 111 | 27392 | 103.03 | 1334 | 1300 | 253.3 |
| C | 4 | 254 | 218951 | 718.56 | 1280 | 1287 | 302.9 |
| C | 3 | 233 | 213956 | 702.07 | 1280 | 1287 | 302.9 |
| C | 14 | 238 | 201965 | 662.48 | 1280 | 1287 | 302.9 |
| D | 2 | 234 | 56901 | 178.14 | 1298 | 1263 | 312.3 |
| D | 1 | 52 | 37322 | 115.45 | 1298 | 1263 | 312.3 |
| D | 12 | 233 | 36097 | 111.53 | 1298 | 1263 | 312.3 |
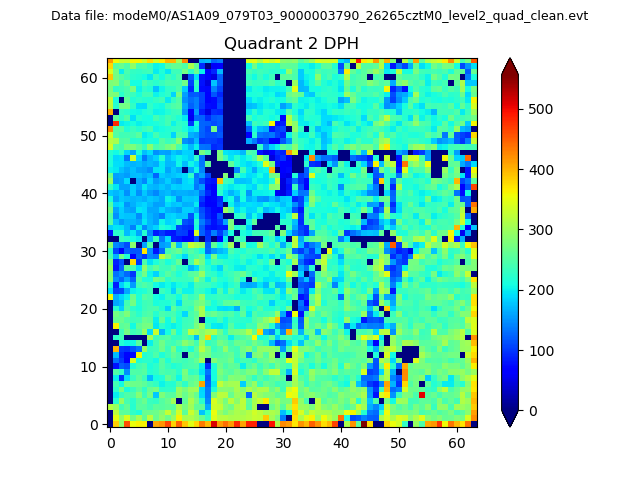
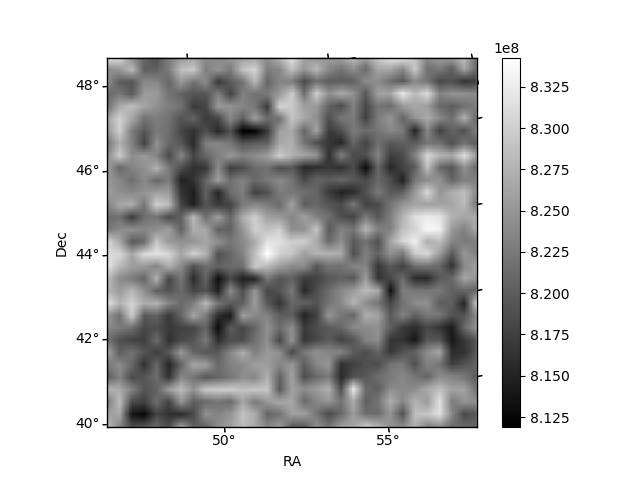
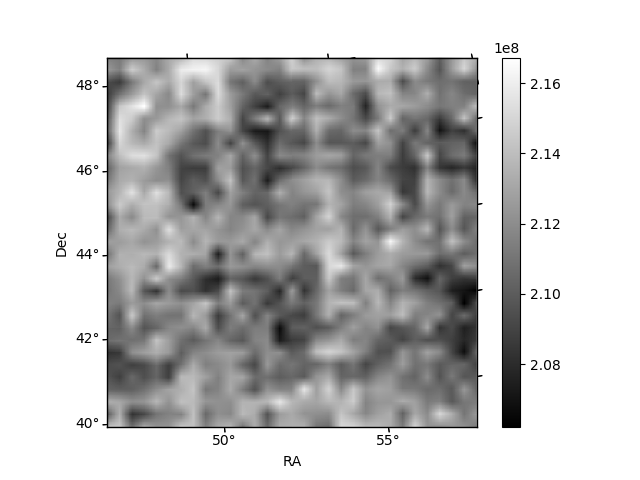
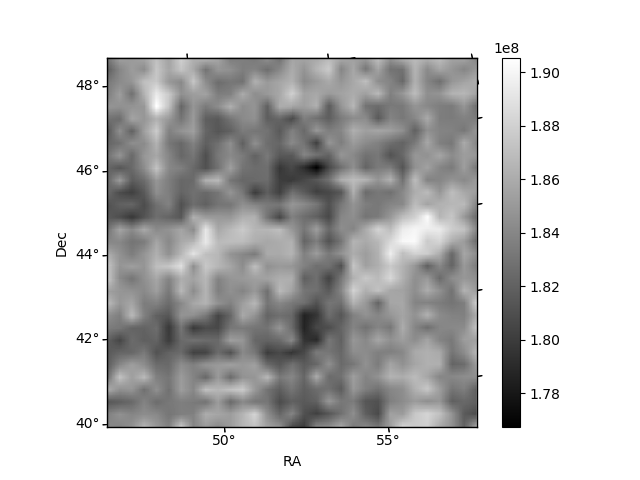
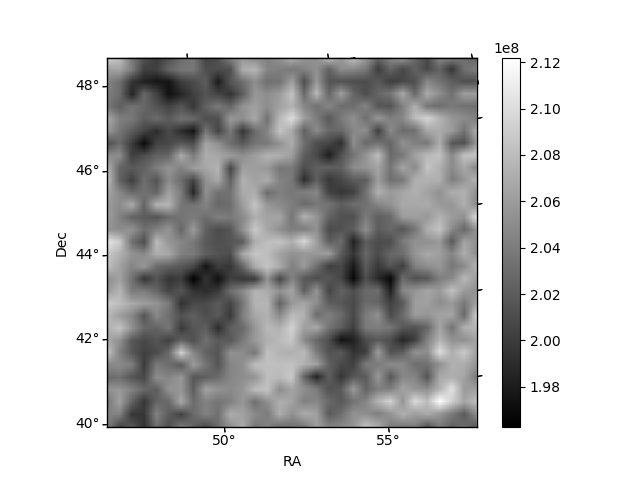
Histogram calculated using DETX and DETY for each event in the final _common_clean file
| Quadrant A | 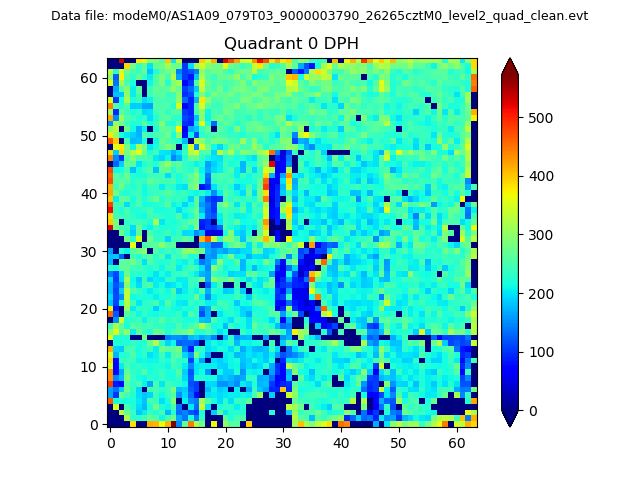 |
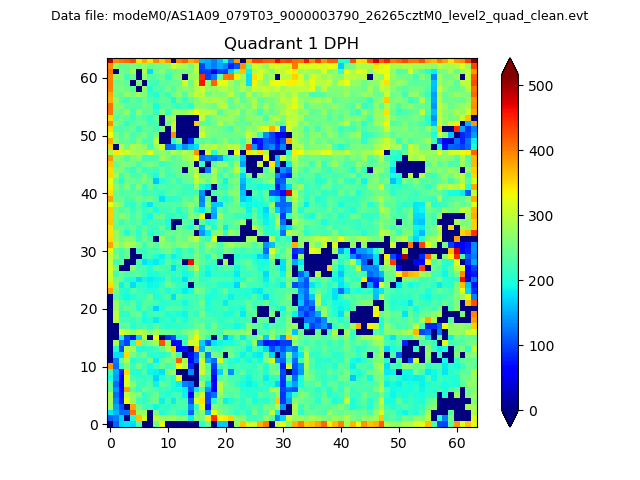 |
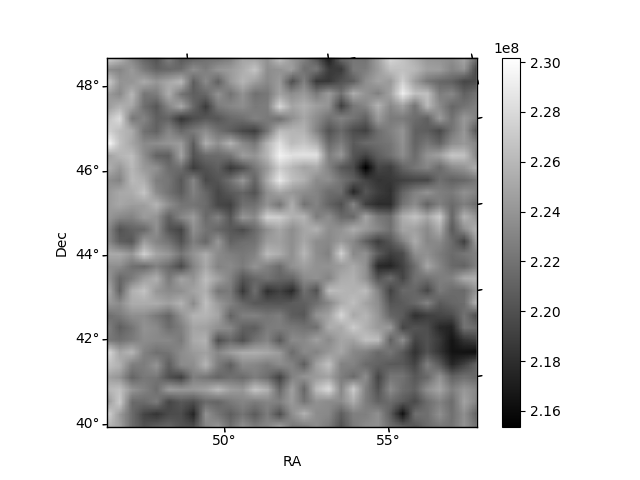
Quadrant B |
|---|---|---|---|
| Quadrant D | 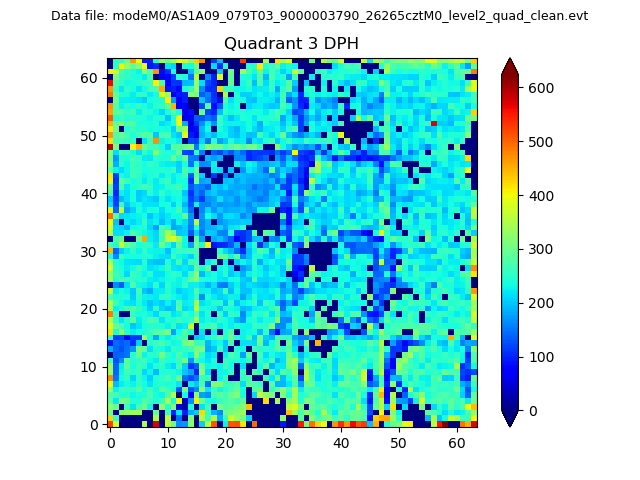 |
 |
Quadrant C |
| Plot type | Count rate plots | Images |
|---|---|---|
| Comparison with Poisson distribution Blue bars denote a histogram of data divided into 1 sec bins. Red curve is a Poisson curve with rate = median count rate of data. |
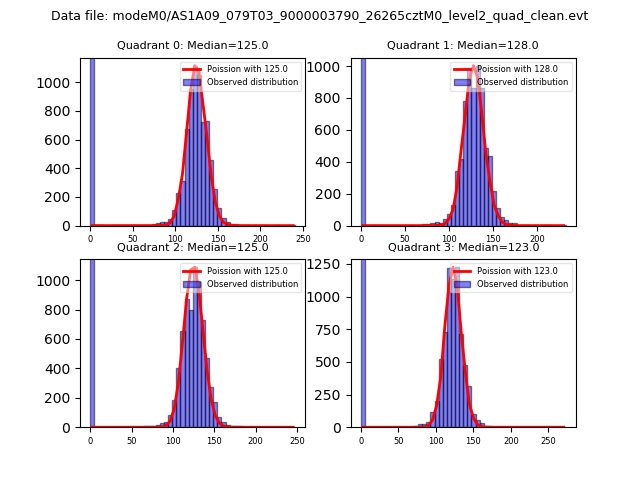 |
 |
| Quadrant-wise count rates Data is divided into 100 sec bins |
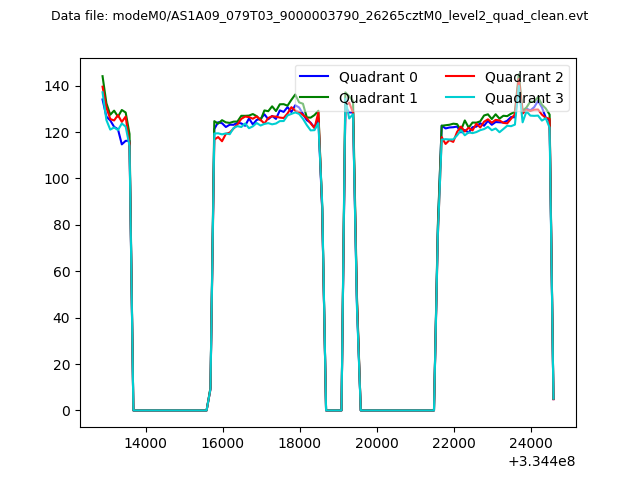 |
|
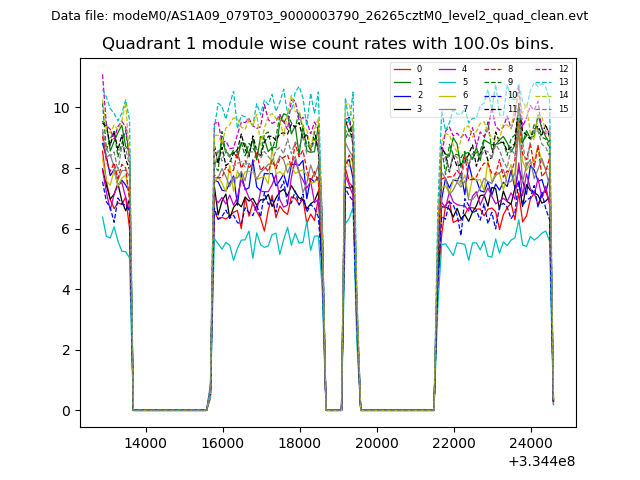
| Module-wise count rates for Quadrant A Data is divided into 100 sec bins |
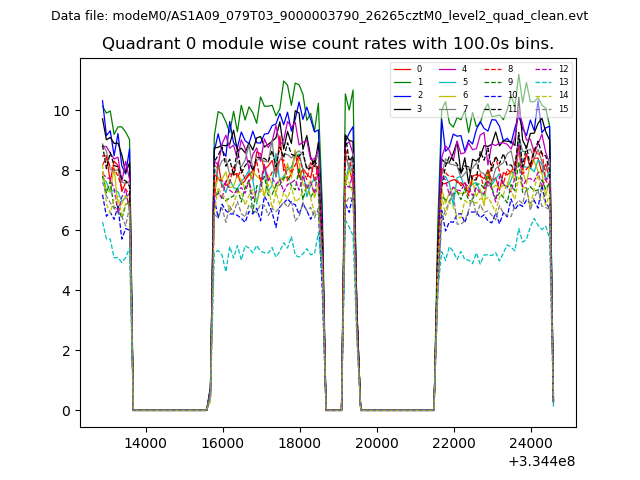 |
 |
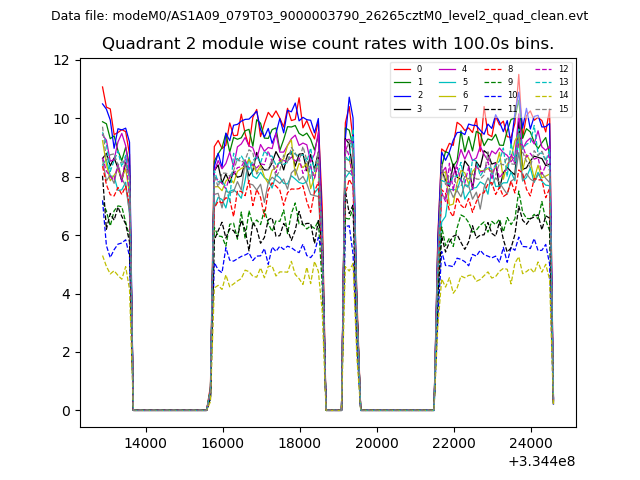
| Module-wise count rates for Quadrant B Data is divided into 100 sec bins |
 |
 |
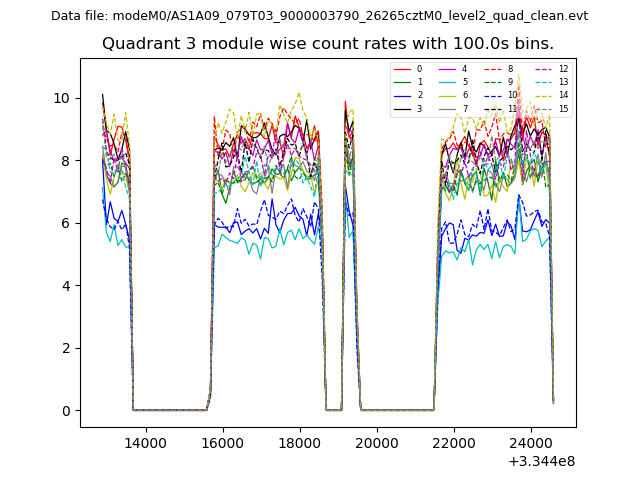
| Module-wise count rates for Quadrant C Data is divided into 100 sec bins |
 |
 |
| Module-wise count rates for Quadrant D Data is divided into 100 sec bins |
 |
 |
| Parameter | Plot |
|---|---|
| CZT HV Monitor | 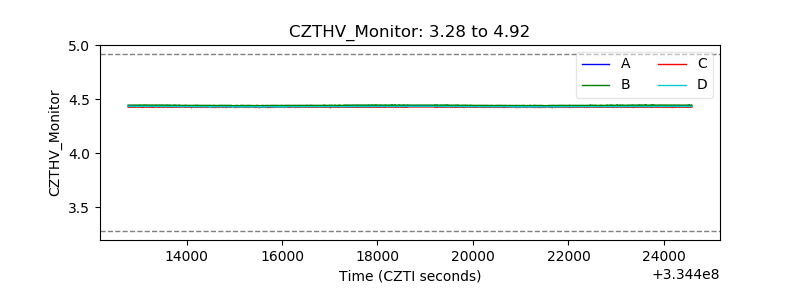 |
| D_VDD | 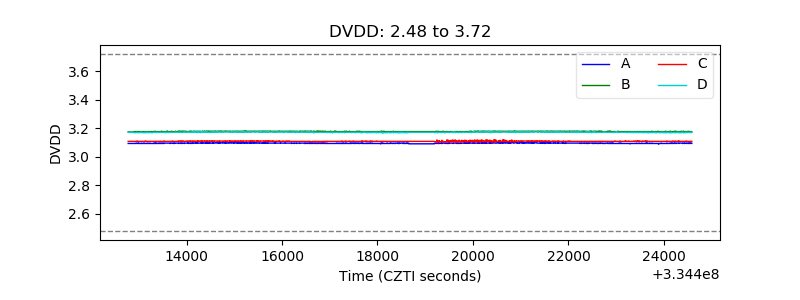 |
| Temperature 1 | 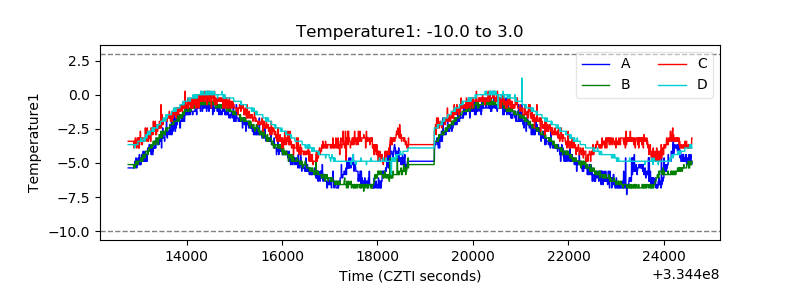 |
| Veto HV Monitor | 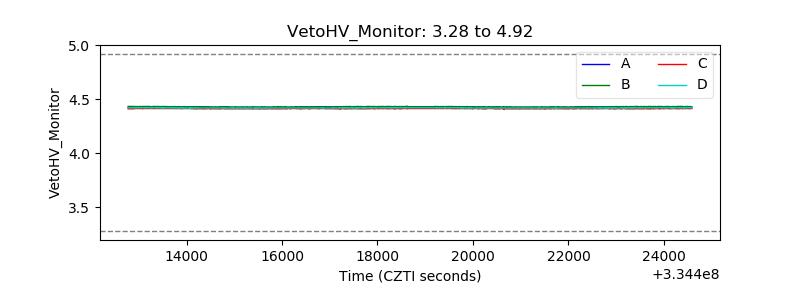 |
| Veto LLD | 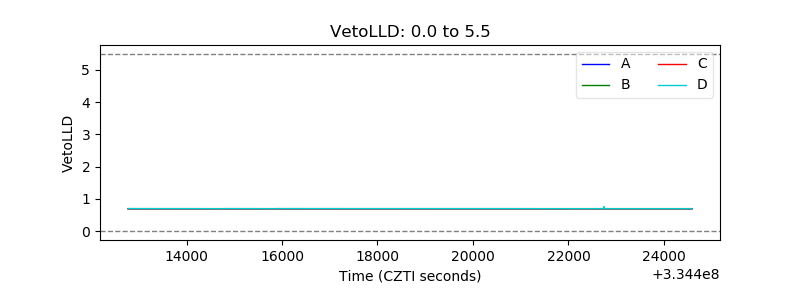 |
| Alpha Counter | 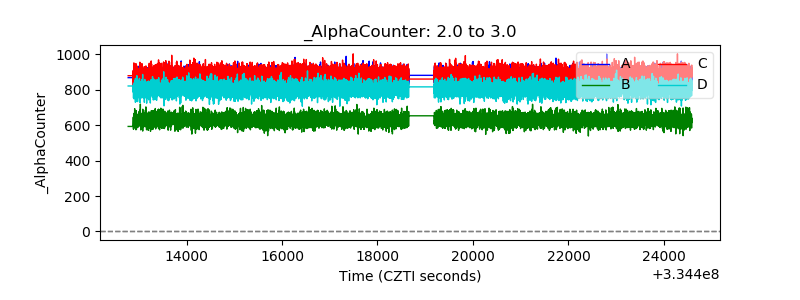 |
| _CPM_Rate | 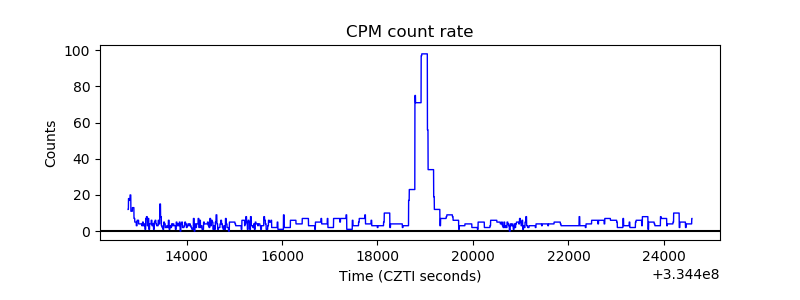 |
| CZT Counter | 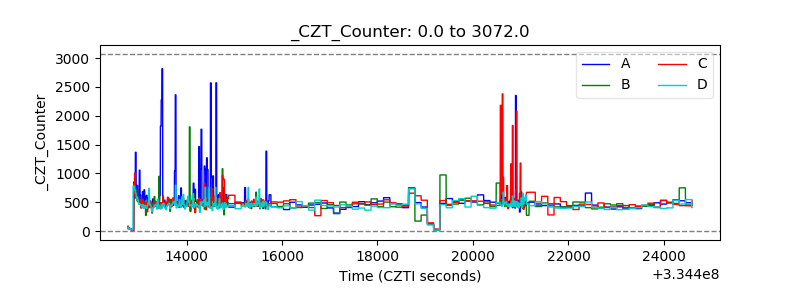 |
| +2.5 Volts monitor |  |
| +5 Volts monitor |  |
| _ROLL_ROT | 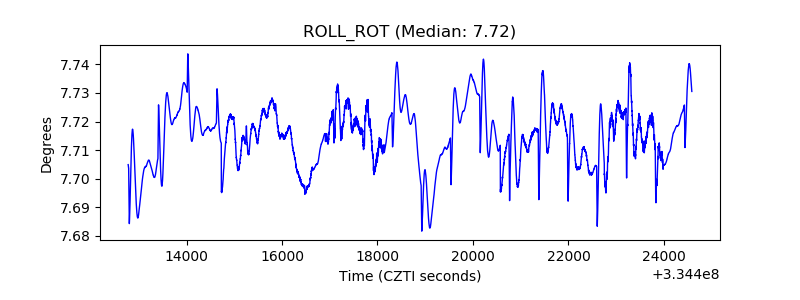 |
| _Roll_DEC | 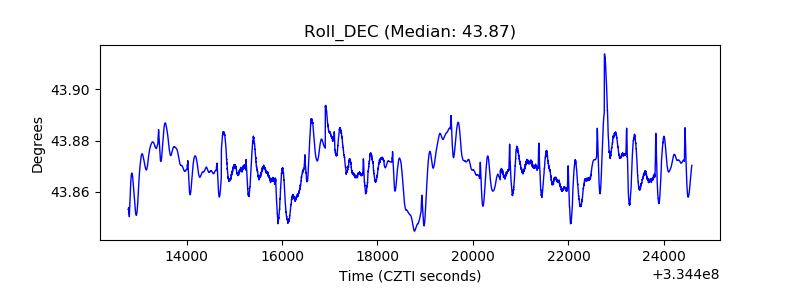 |
| _Roll_RA | 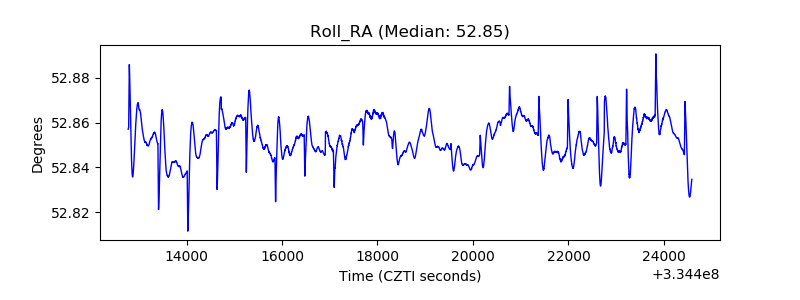 |
| Veto Counter | 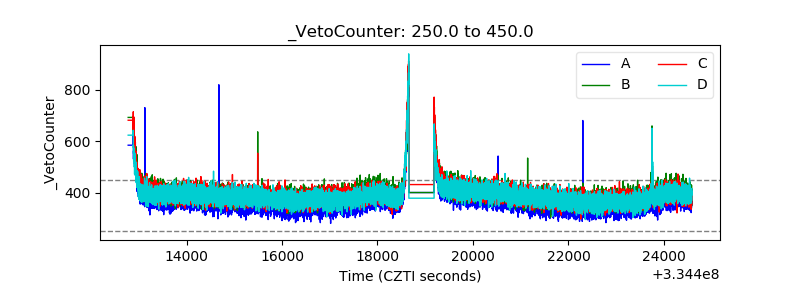 |