| Param | Original file | Final file |
|---|---|---|
| Filename | modeM0/AS1A09_079T03_9000003790_26266cztM0_level2.evt | modeM0/AS1A09_079T03_9000003790_26266cztM0_level2_quad_clean.evt |
| Size (bytes) | 556,640,640 | 85,993,920 |
| Size | 530.9 MB | 82.0 MB |
| Events in quadrant A | 3,889,740 | 521,310 |
| Events in quadrant B | 3,881,891 | 532,554 |
| Events in quadrant C | 4,876,136 | 515,062 |
| Events in quadrant D | 3,700,749 | 512,898 |
| Mode M0 | |||
|---|---|---|---|
| Quadrant | BADHDUFLAG | Total packets | Discarded packets |
| A | 0 | 16381 | 0 |
| B | 0 | 16267 | 0 |
| C | 0 | 19320 | 0 |
| D | 0 | 15927 | 0 |
| Mode M9 | |||
|---|---|---|---|
| Quadrant | BADHDUFLAG | Total packets | Discarded packets |
| A | 0 | 16 | 0 |
| B | 0 | 16 | 0 |
| C | 0 | 16 | 0 |
| D | 0 | 16 | 0 |
| Quadrant | Total seconds | Saturated seconds | Saturation percentage |
|---|---|---|---|
| A | 7503 | 124 | 1.652672% |
| B | 7504 | 167 | 2.225480% |
| C | 7504 | 621 | 8.275586% |
| D | 7504 | 101 | 1.345949% |
Noise dominated data is calculated using 1-second bins in cleaned event files. If a bin has >2000 counts, and if more than 50% of those come from <1% of pixels, then it is considered to be noise-dominated and hence unusable.
| Quadrant | # 1 sec bins | Bins with >0 counts | Bins with >2000 counts | High rate bins dominated by noise | Noise dominated (total time) | Noise dominated (detector-on time) | Marked lightcurve |
|---|---|---|---|---|---|---|---|
| A | 9118 | 7505 | 20 | 20 | 0.22% | 0.27% | 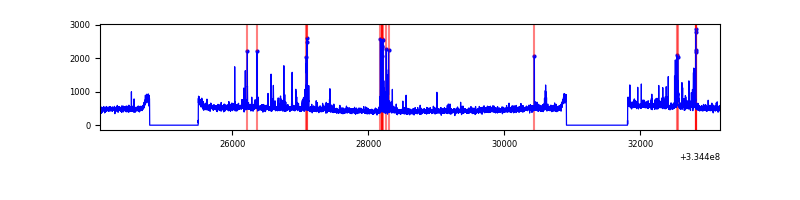 |
| B | 9119 | 7506 | 41 | 41 | 0.45% | 0.55% | 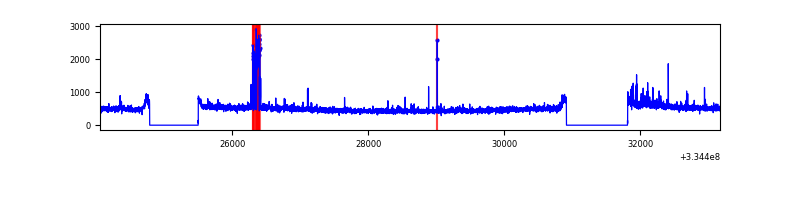 |
| C | 9119 | 7506 | 263 | 263 | 2.88% | 3.50% | 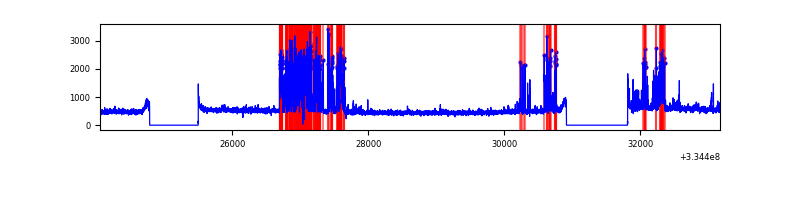 |
| D | 9119 | 7506 | 8 | 8 | 0.09% | 0.11% | 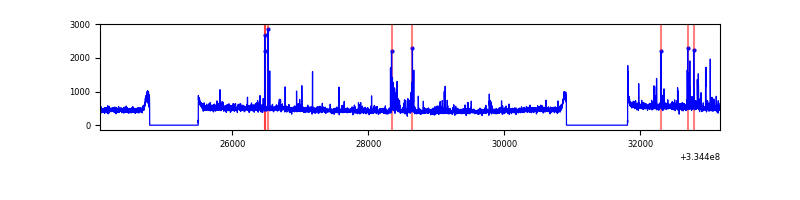 |
Top three noisy pixels from each quadrant. If the there are fewer than three noisy pixels in the level2.evt file, extra rows are filled as -1
| Pixel properties | Quadrant properties | ||||||
|---|---|---|---|---|---|---|---|
| Quadrant | DetID | PixID | Counts | Sigma | Mean | Median | Sigma |
| A | 0 | 13 | 248626 | 1304.37 | 939 | 919 | 189.9 |
| A | 13 | 254 | 13042 | 63.84 | 939 | 919 | 189.9 |
| A | 3 | 137 | 8700 | 40.97 | 939 | 919 | 189.9 |
| B | 5 | 172 | 182832 | 1020.04 | 935 | 912 | 178.3 |
| B | 12 | 111 | 21371 | 114.72 | 935 | 912 | 178.3 |
| B | 11 | 111 | 18780 | 100.19 | 935 | 912 | 178.3 |
| C | 4 | 254 | 1170125 | 5666.25 | 881 | 886 | 206.4 |
| C | 14 | 238 | 138607 | 667.41 | 881 | 886 | 206.4 |
| C | 3 | 233 | 93827 | 450.4 | 881 | 886 | 206.4 |
| D | 12 | 33 | 83406 | 375.08 | 919 | 896 | 220.0 |
| D | 12 | 233 | 48820 | 217.86 | 919 | 896 | 220.0 |
| D | 1 | 52 | 47922 | 213.78 | 919 | 896 | 220.0 |
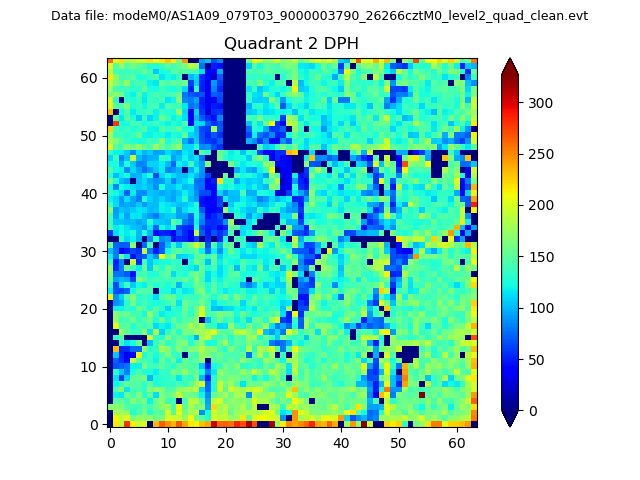
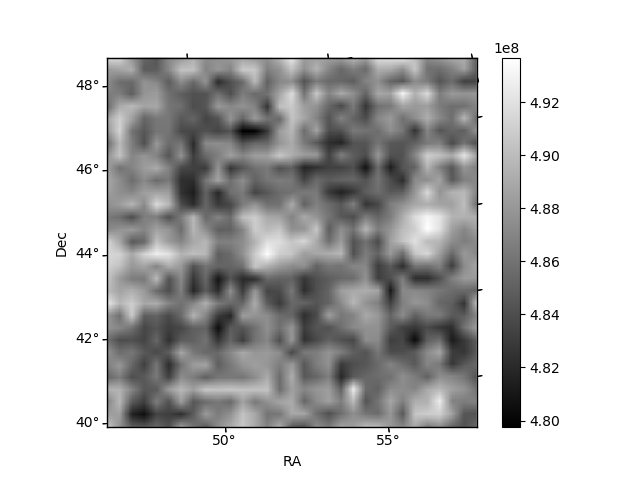
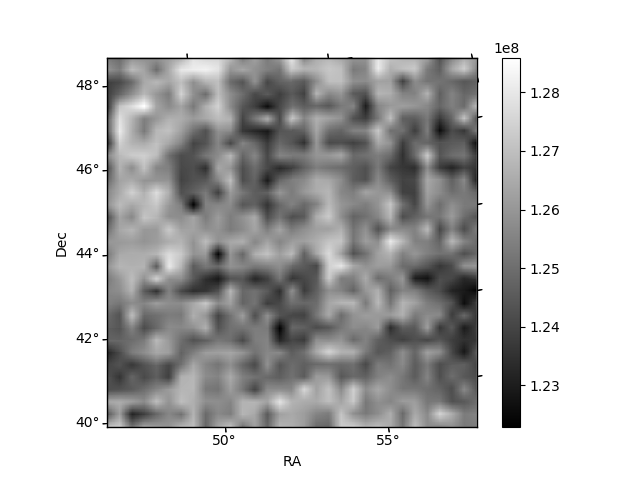
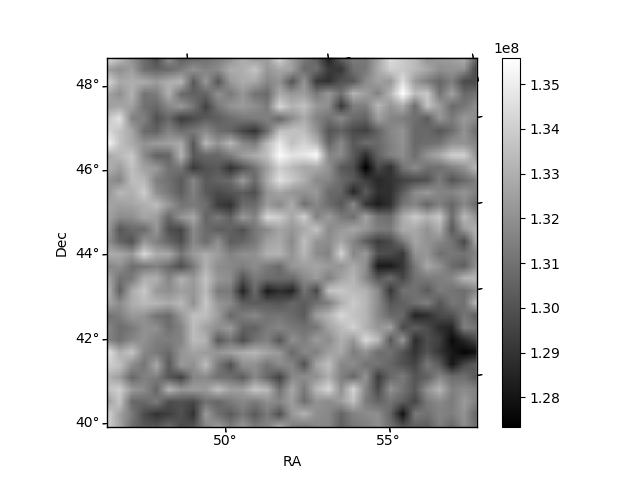
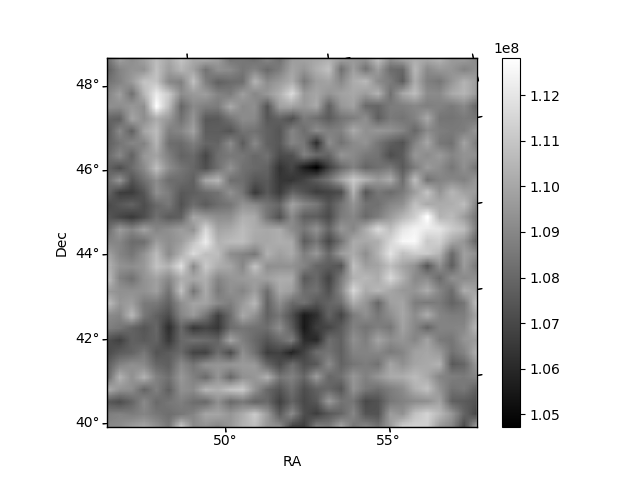
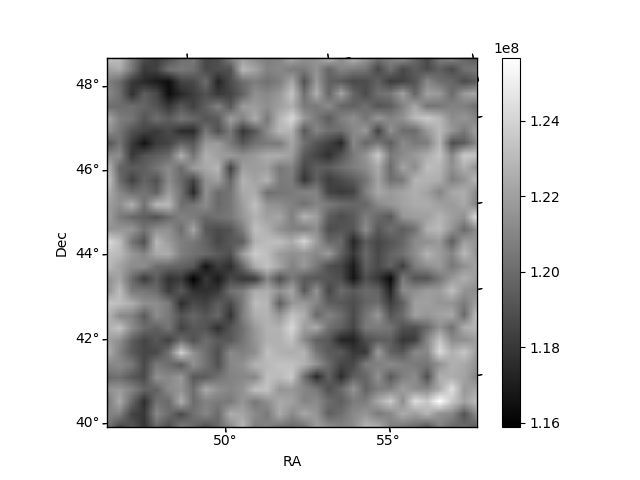
Histogram calculated using DETX and DETY for each event in the final _common_clean file
| Quadrant A | 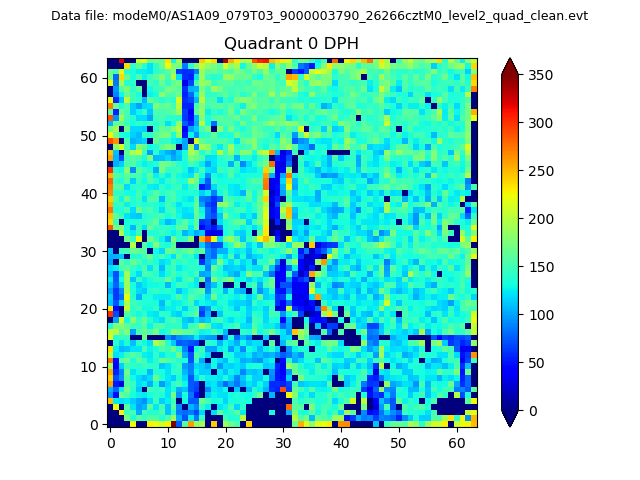 |
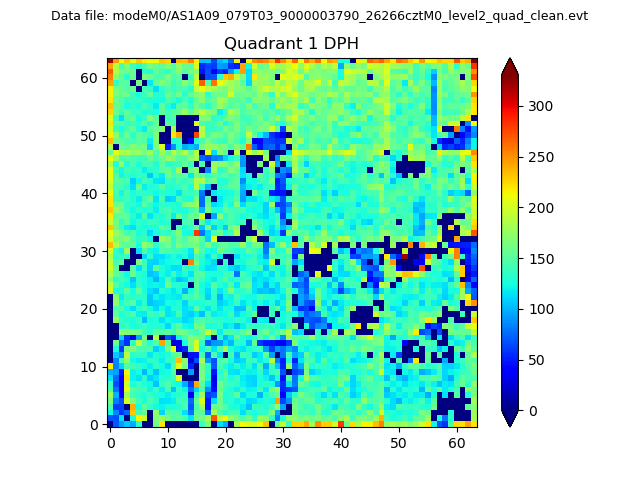 |
Quadrant B |
|---|---|---|---|
| Quadrant D | 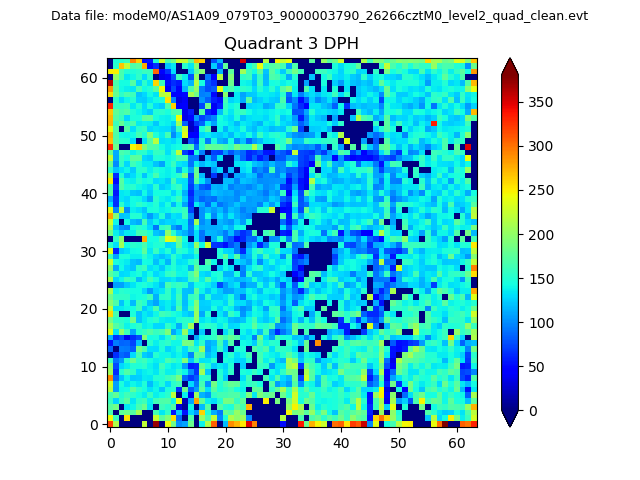 |
 |
Quadrant C |
| Plot type | Count rate plots | Images |
|---|---|---|
| Comparison with Poisson distribution Blue bars denote a histogram of data divided into 1 sec bins. Red curve is a Poisson curve with rate = median count rate of data. |
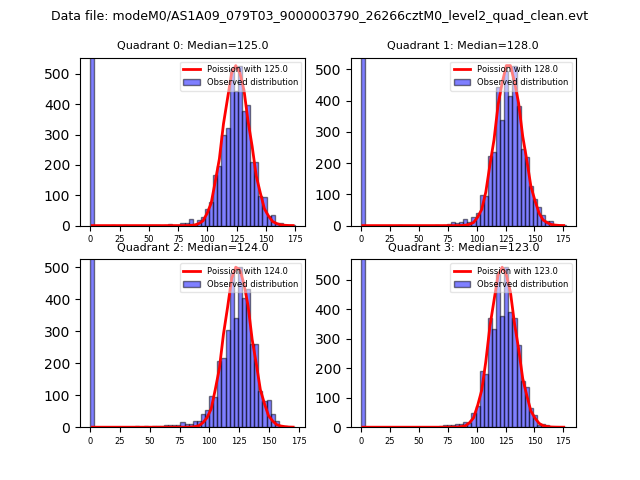 |
 |
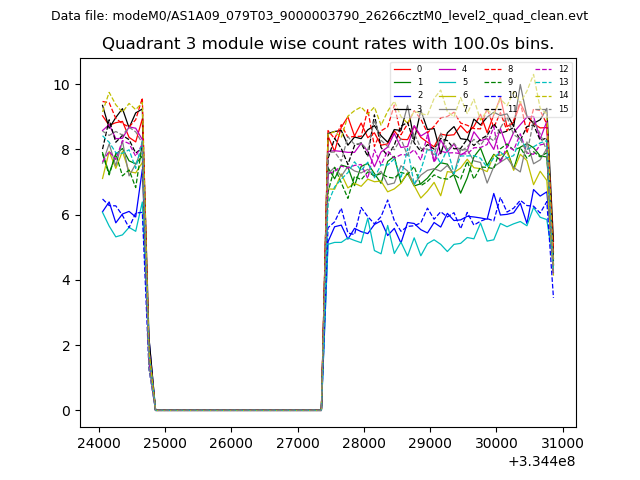
| Quadrant-wise count rates Data is divided into 100 sec bins |
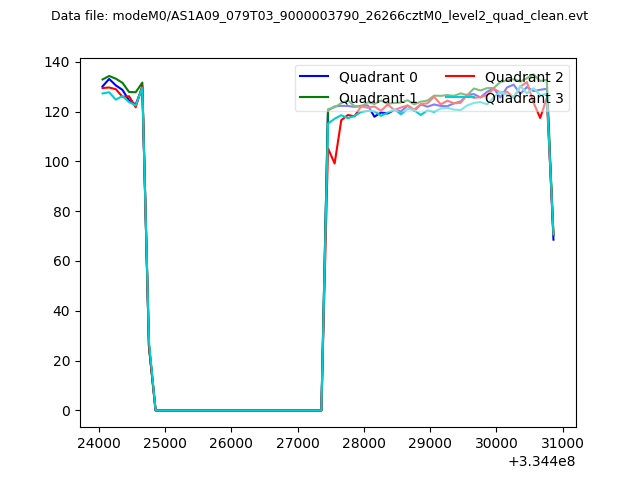 |
|
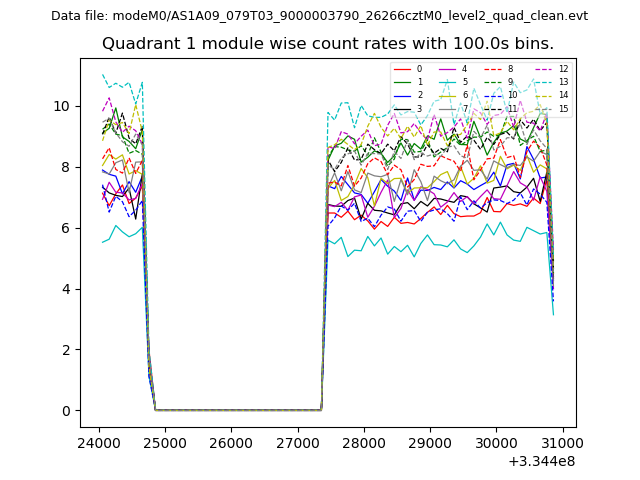
| Module-wise count rates for Quadrant A Data is divided into 100 sec bins |
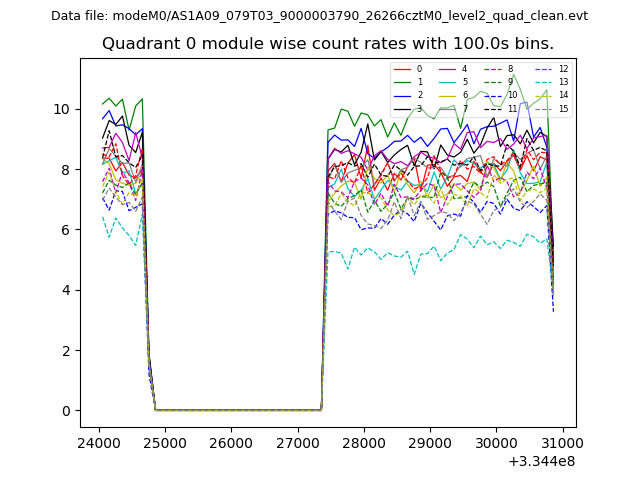 |
 |
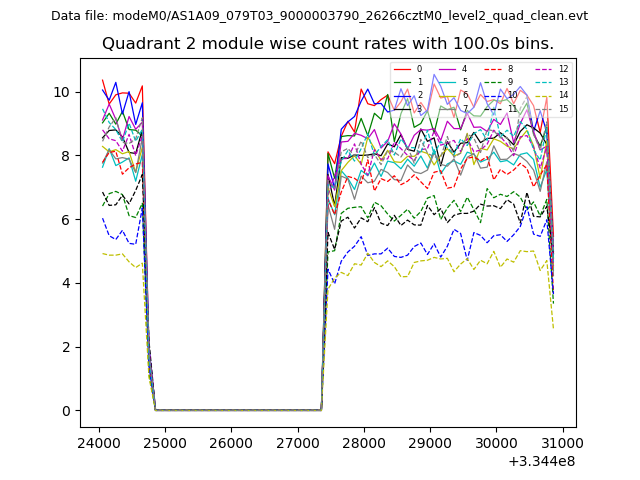
| Module-wise count rates for Quadrant B Data is divided into 100 sec bins |
 |
 |
| Module-wise count rates for Quadrant C Data is divided into 100 sec bins |
 |
 |
| Module-wise count rates for Quadrant D Data is divided into 100 sec bins |
 |
 |
| Parameter | Plot |
|---|---|
| CZT HV Monitor | 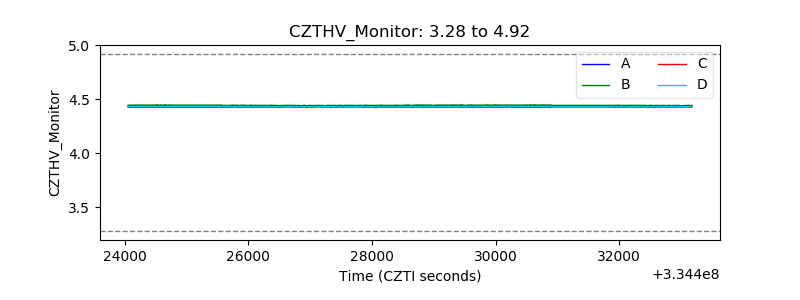 |
| D_VDD | 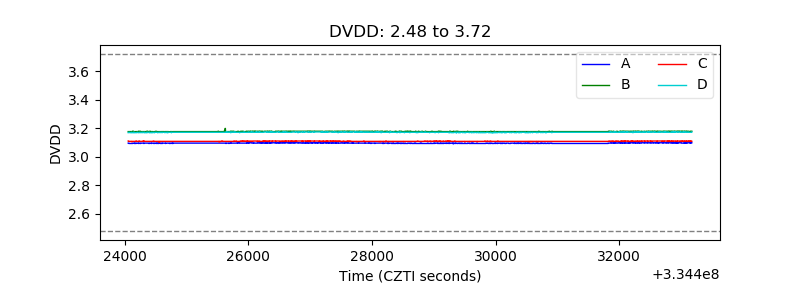 |
| Temperature 1 | 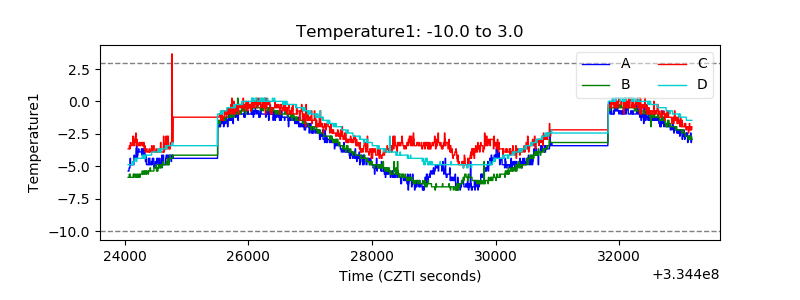 |
| Veto HV Monitor | 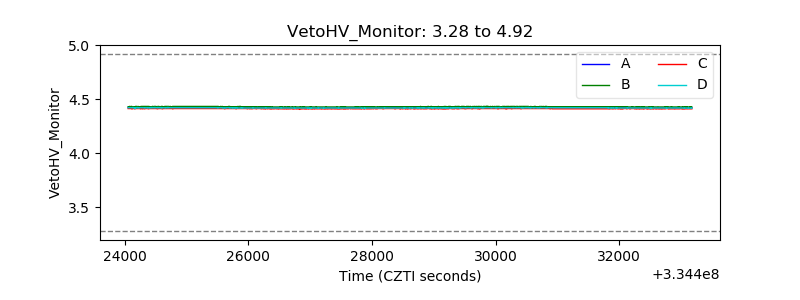 |
| Veto LLD | 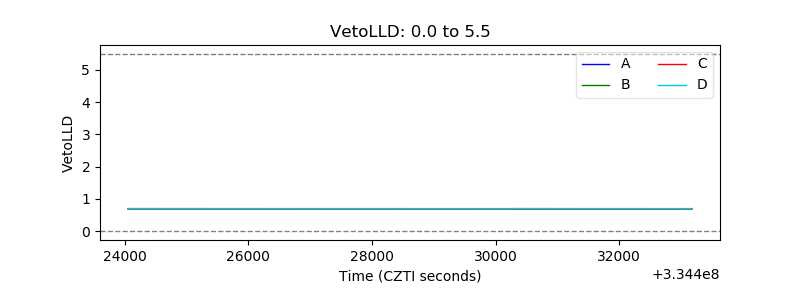 |
| Alpha Counter | 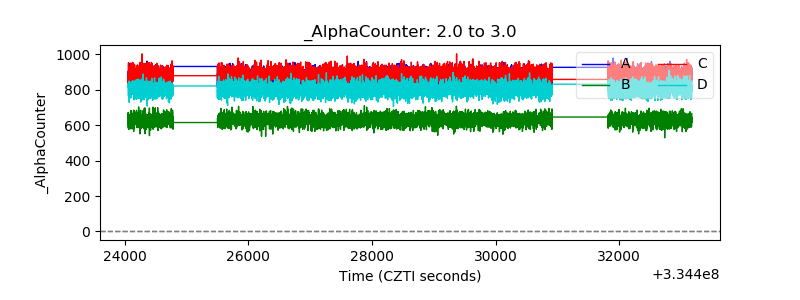 |
| _CPM_Rate | 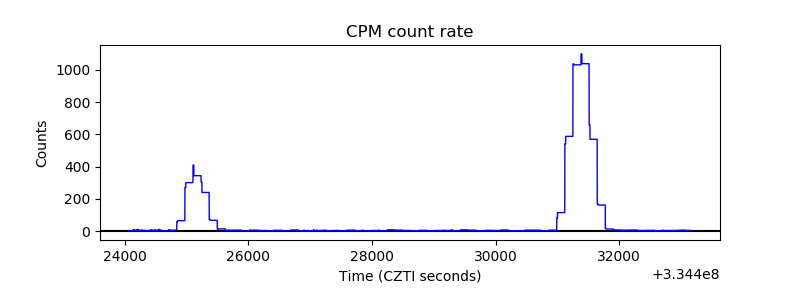 |
| CZT Counter | 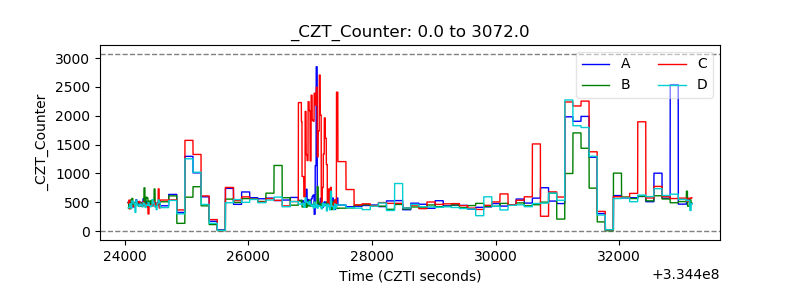 |
| +2.5 Volts monitor | 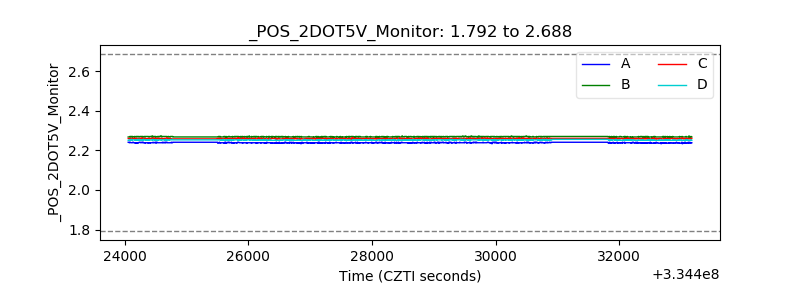 |
| +5 Volts monitor | 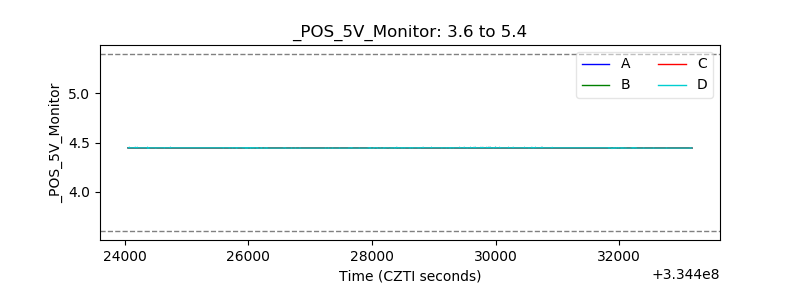 |
| _ROLL_ROT | 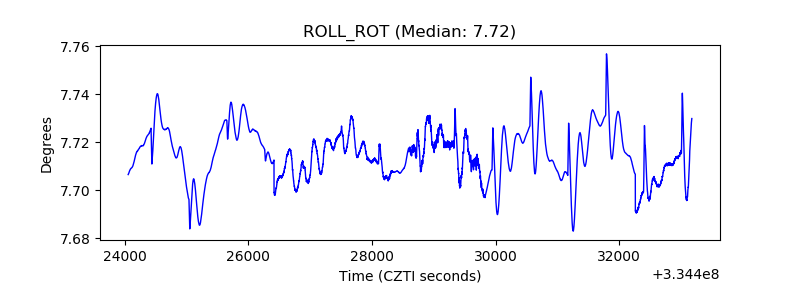 |
| _Roll_DEC | 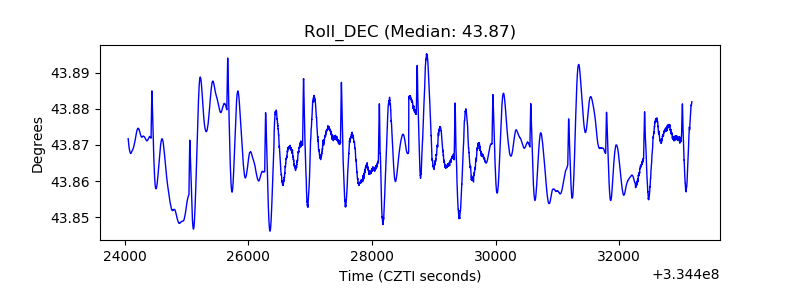 |
| _Roll_RA | 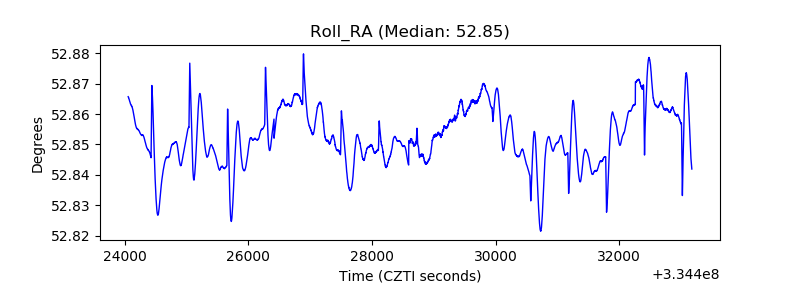 |
| Veto Counter | 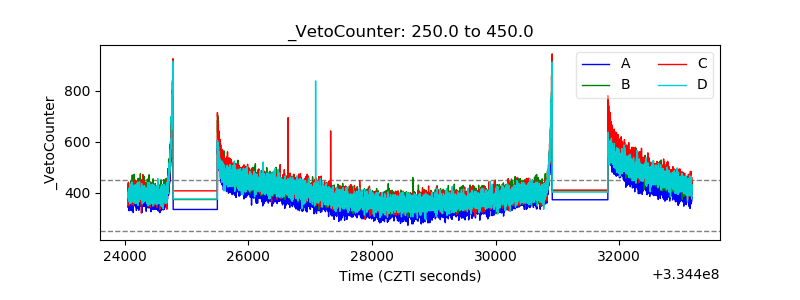 |