| Param | Original file | Final file |
|---|---|---|
| Filename | modeM0/AS1A09_079T03_9000003790_26267cztM0_level2.evt | modeM0/AS1A09_079T03_9000003790_26267cztM0_level2_quad_clean.evt |
| Size (bytes) | 505,805,760 | 84,657,600 |
| Size | 482.4 MB | 80.7 MB |
| Events in quadrant A | 3,494,098 | 526,852 |
| Events in quadrant B | 3,512,381 | 537,769 |
| Events in quadrant C | 4,403,091 | 514,498 |
| Events in quadrant D | 3,453,865 | 517,345 |
| Mode M0 | |||
|---|---|---|---|
| Quadrant | BADHDUFLAG | Total packets | Discarded packets |
| A | 0 | 14878 | 0 |
| B | 0 | 14851 | 0 |
| C | 0 | 17627 | 0 |
| D | 0 | 14850 | 0 |
| Mode M9 | |||
|---|---|---|---|
| Quadrant | BADHDUFLAG | Total packets | Discarded packets |
| A | 0 | 20 | 0 |
| B | 0 | 20 | 0 |
| C | 0 | 20 | 0 |
| D | 0 | 20 | 0 |
| Quadrant | Total seconds | Saturated seconds | Saturation percentage |
|---|---|---|---|
| A | 6701 | 109 | 1.626623% |
| B | 6701 | 104 | 1.552007% |
| C | 6701 | 452 | 6.745262% |
| D | 6701 | 104 | 1.552007% |
Noise dominated data is calculated using 1-second bins in cleaned event files. If a bin has >2000 counts, and if more than 50% of those come from <1% of pixels, then it is considered to be noise-dominated and hence unusable.
| Quadrant | # 1 sec bins | Bins with >0 counts | Bins with >2000 counts | High rate bins dominated by noise | Noise dominated (total time) | Noise dominated (detector-on time) | Marked lightcurve |
|---|---|---|---|---|---|---|---|
| A | 8641 | 6703 | 17 | 17 | 0.20% | 0.25% | 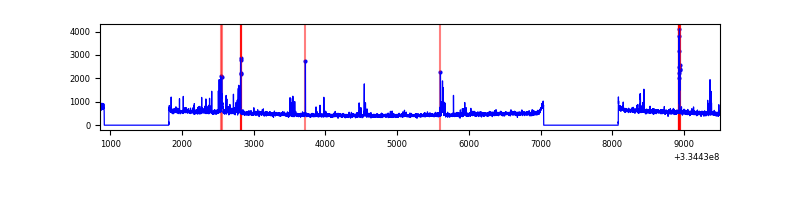 |
| B | 8641 | 6703 | 11 | 11 | 0.13% | 0.16% | 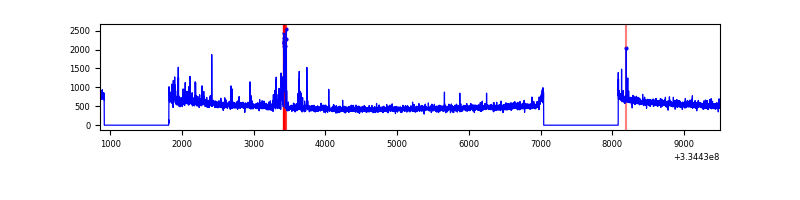 |
| C | 8641 | 6703 | 162 | 162 | 1.87% | 2.42% | 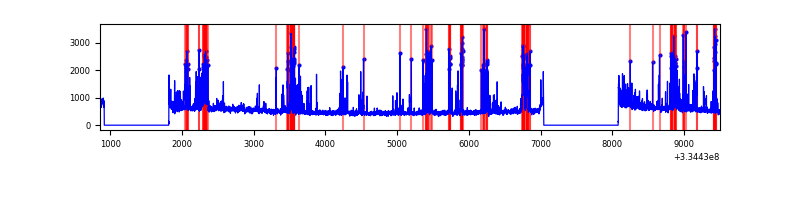 |
| D | 8641 | 6703 | 24 | 24 | 0.28% | 0.36% | 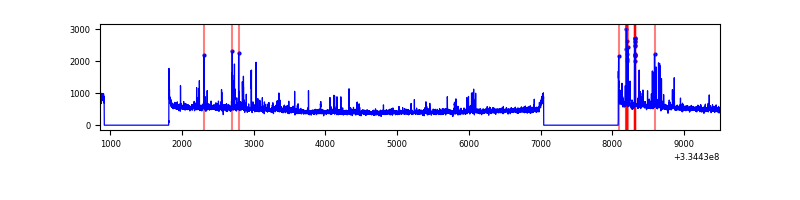 |
Top three noisy pixels from each quadrant. If the there are fewer than three noisy pixels in the level2.evt file, extra rows are filled as -1
| Pixel properties | Quadrant properties | ||||||
|---|---|---|---|---|---|---|---|
| Quadrant | DetID | PixID | Counts | Sigma | Mean | Median | Sigma |
| A | 0 | 13 | 175917 | 1022.55 | 852 | 835 | 171.2 |
| A | 13 | 248 | 28119 | 159.35 | 852 | 835 | 171.2 |
| A | 13 | 254 | 11048 | 59.65 | 852 | 835 | 171.2 |
| B | 5 | 172 | 151512 | 932.41 | 856 | 836 | 161.6 |
| B | 12 | 111 | 18970 | 112.22 | 856 | 836 | 161.6 |
| B | 11 | 111 | 16493 | 96.89 | 856 | 836 | 161.6 |
| C | 4 | 254 | 923645 | 4853.4 | 816 | 822 | 190.1 |
| C | 3 | 233 | 139669 | 730.24 | 816 | 822 | 190.1 |
| C | 14 | 238 | 129600 | 677.28 | 816 | 822 | 190.1 |
| D | 12 | 233 | 157427 | 779.94 | 839 | 820 | 200.8 |
| D | 1 | 52 | 47279 | 231.38 | 839 | 820 | 200.8 |
| D | 13 | 168 | 32878 | 159.66 | 839 | 820 | 200.8 |
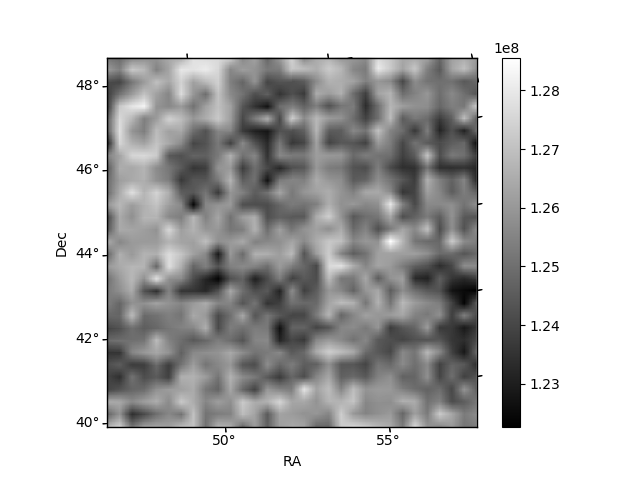
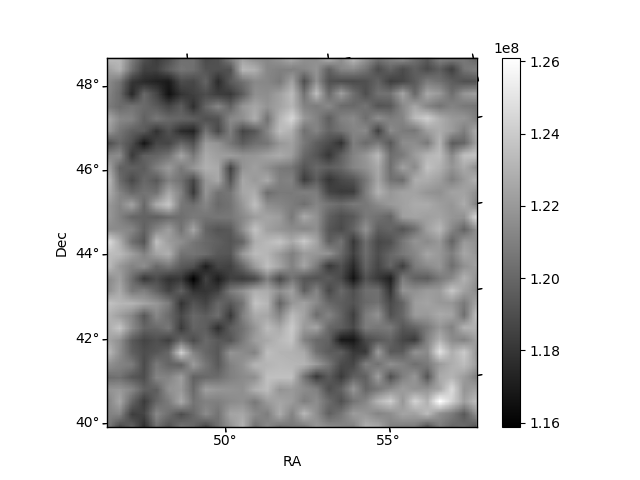
Histogram calculated using DETX and DETY for each event in the final _common_clean file
| Quadrant A | 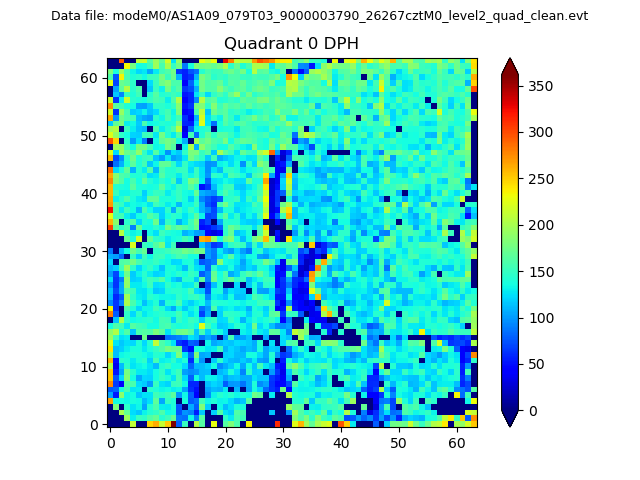 |
 |
Quadrant B |
|---|---|---|---|
| Quadrant D | 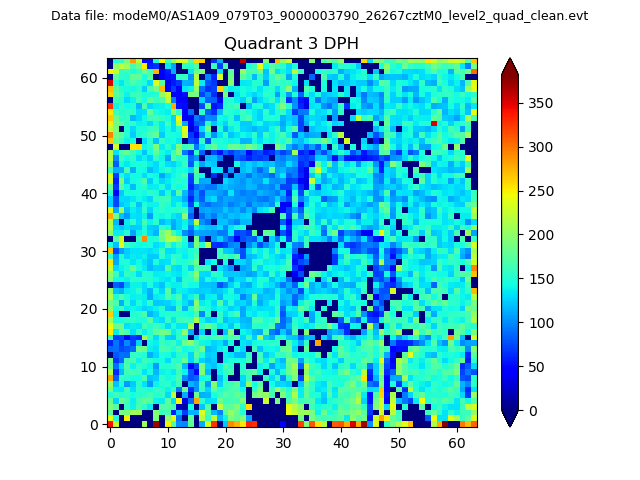 |
 |
Quadrant C |
| Plot type | Count rate plots | Images |
|---|---|---|
| Comparison with Poisson distribution Blue bars denote a histogram of data divided into 1 sec bins. Red curve is a Poisson curve with rate = median count rate of data. |
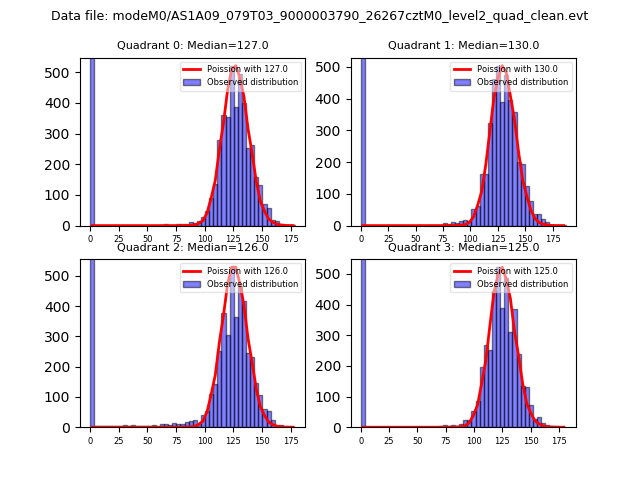 |
 |
| Quadrant-wise count rates Data is divided into 100 sec bins |
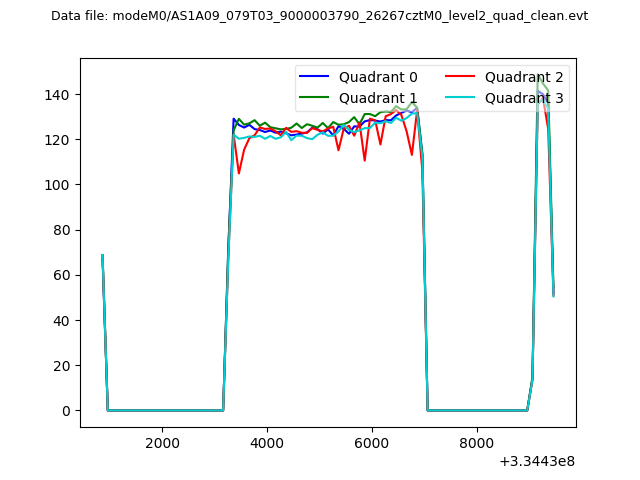 |
|
| Module-wise count rates for Quadrant A Data is divided into 100 sec bins |
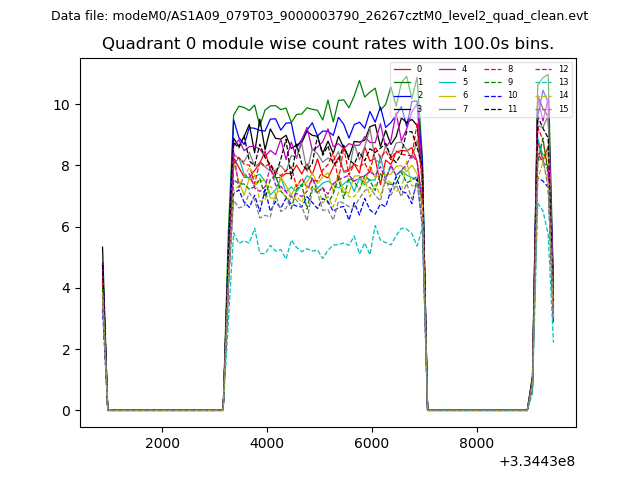 |
 |
| Module-wise count rates for Quadrant B Data is divided into 100 sec bins |
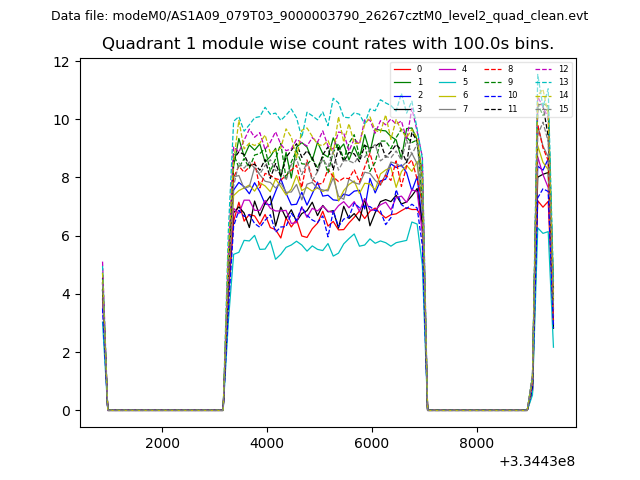 |
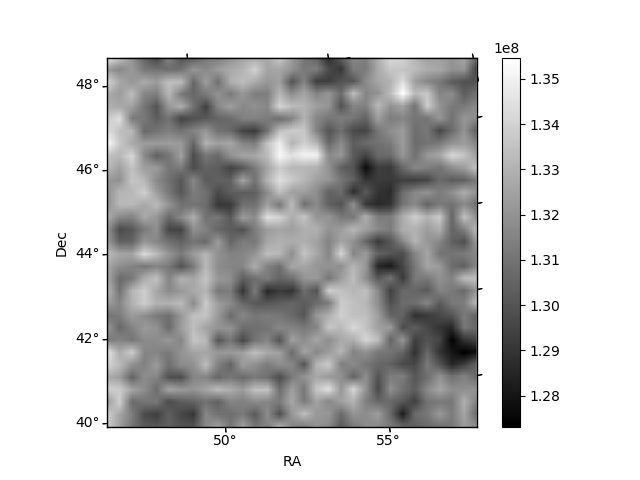 |
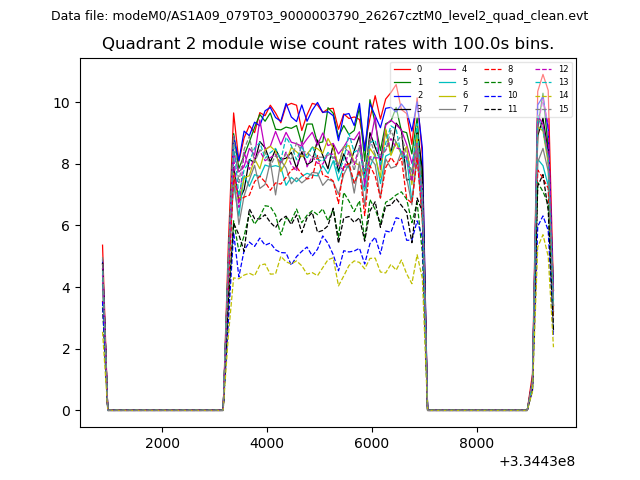
| Module-wise count rates for Quadrant C Data is divided into 100 sec bins |
 |
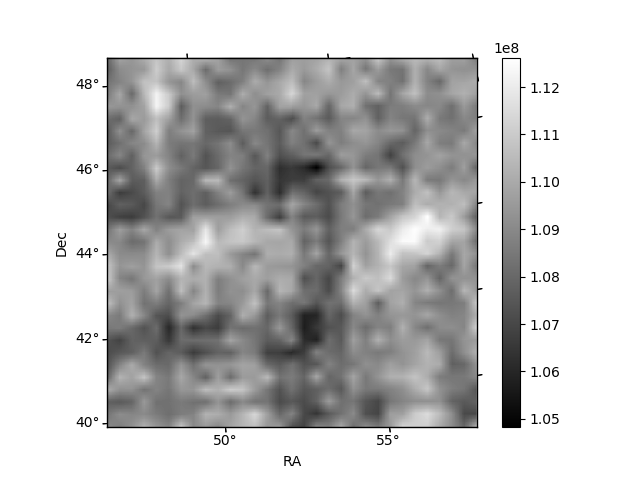 |
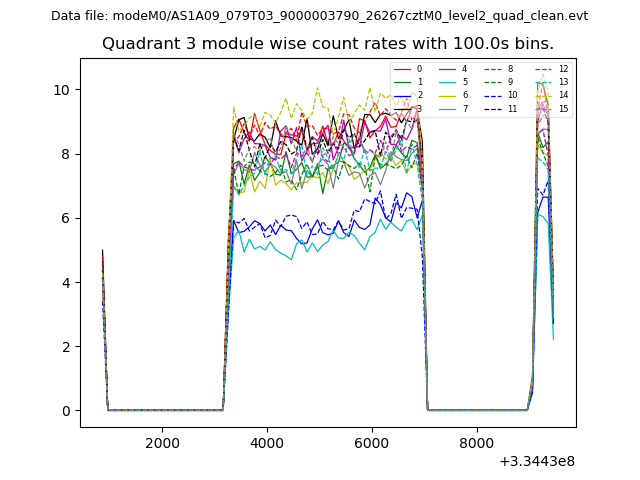
| Module-wise count rates for Quadrant D Data is divided into 100 sec bins |
 |
 |
| Parameter | Plot |
|---|---|
| CZT HV Monitor | 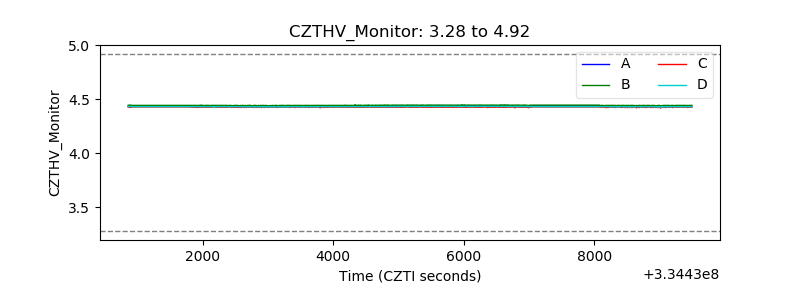 |
| D_VDD | 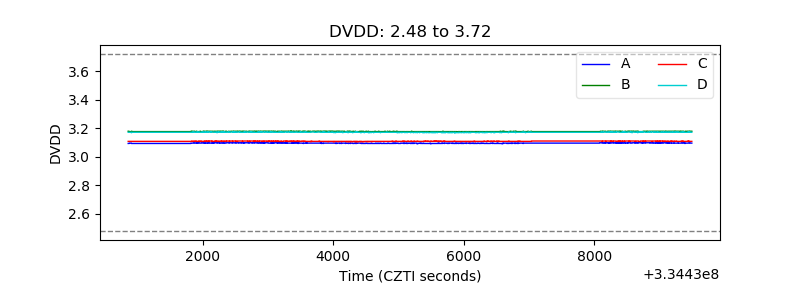 |
| Temperature 1 | 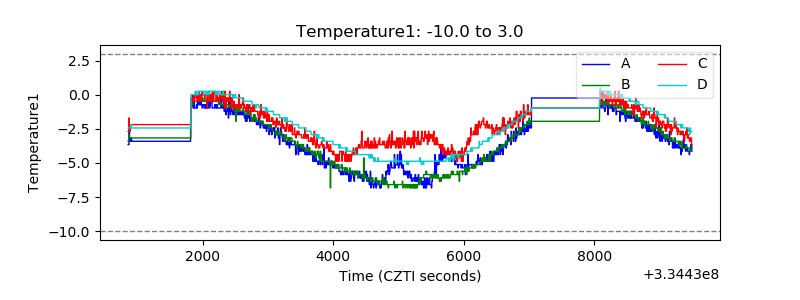 |
| Veto HV Monitor | 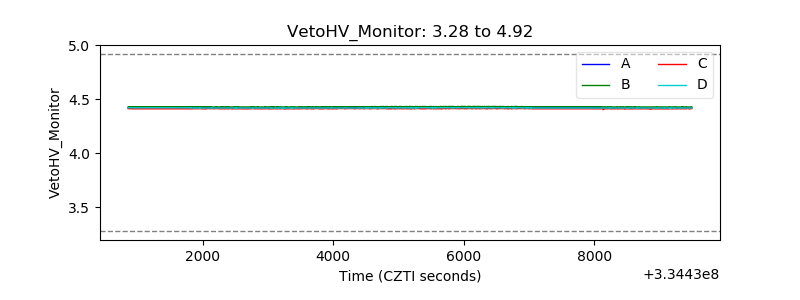 |
| Veto LLD |  |
| Alpha Counter |  |
| _CPM_Rate | 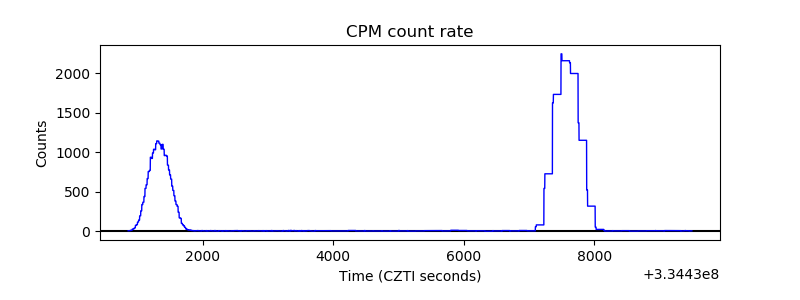 |
| CZT Counter | 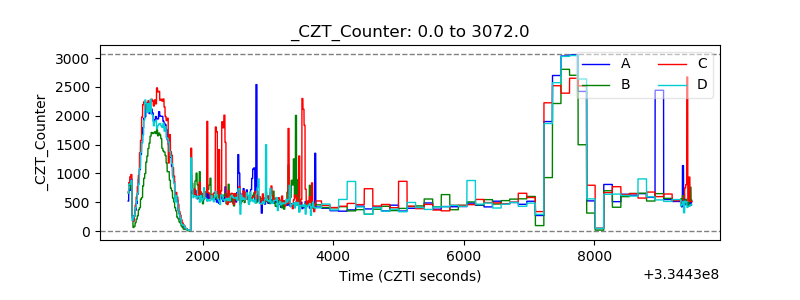 |
| +2.5 Volts monitor |  |
| +5 Volts monitor |  |
| _ROLL_ROT | 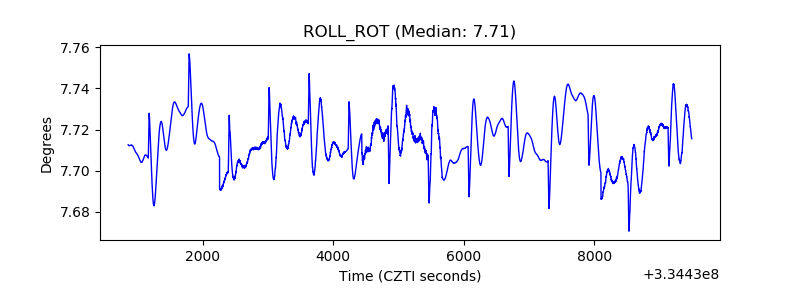 |
| _Roll_DEC | 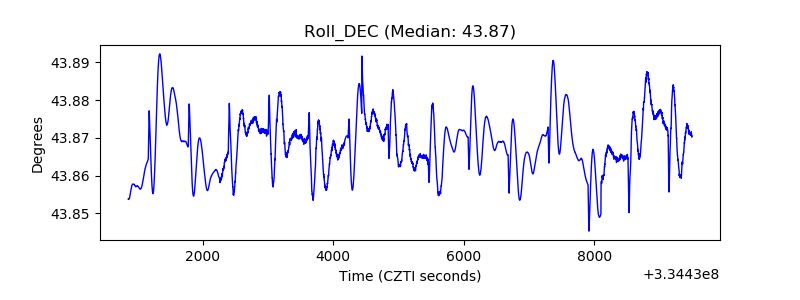 |
| _Roll_RA | 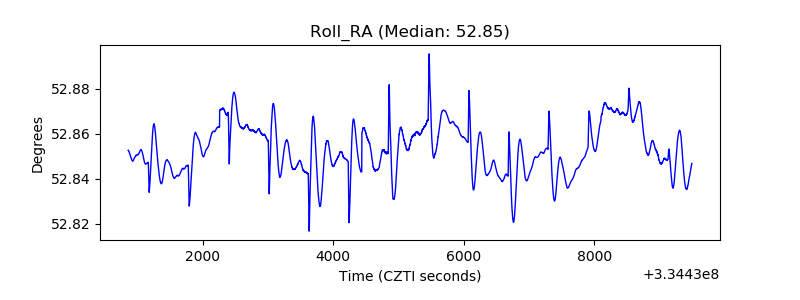 |
| Veto Counter | 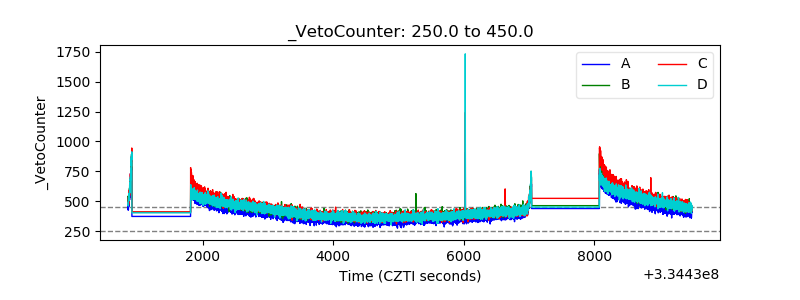 |