| Param | Original file | Final file |
|---|---|---|
| Filename | modeM0/AS1A09_079T03_9000003790_26270cztM0_level2.evt | modeM0/AS1A09_079T03_9000003790_26270cztM0_level2_quad_clean.evt |
| Size (bytes) | 489,254,400 | 103,262,400 |
| Size | 466.6 MB | 98.5 MB |
| Events in quadrant A | 3,348,512 | 672,010 |
| Events in quadrant B | 3,316,633 | 699,558 |
| Events in quadrant C | 4,598,842 | 658,955 |
| Events in quadrant D | 3,133,923 | 665,665 |
| Mode M0 | |||
|---|---|---|---|
| Quadrant | BADHDUFLAG | Total packets | Discarded packets |
| A | 0 | 14076 | 0 |
| B | 0 | 13943 | 0 |
| C | 0 | 17844 | 0 |
| D | 0 | 13511 | 0 |
| Mode M9 | |||
|---|---|---|---|
| Quadrant | BADHDUFLAG | Total packets | Discarded packets |
| A | 0 | 22 | 0 |
| B | 0 | 23 | 0 |
| C | 0 | 23 | 0 |
| D | 0 | 23 | 0 |
| Quadrant | Total seconds | Saturated seconds | Saturation percentage |
|---|---|---|---|
| A | 6173 | 61 | 0.988174% |
| B | 6173 | 60 | 0.971975% |
| C | 6173 | 567 | 9.185161% |
| D | 6173 | 32 | 0.518387% |
Noise dominated data is calculated using 1-second bins in cleaned event files. If a bin has >2000 counts, and if more than 50% of those come from <1% of pixels, then it is considered to be noise-dominated and hence unusable.
| Quadrant | # 1 sec bins | Bins with >0 counts | Bins with >2000 counts | High rate bins dominated by noise | Noise dominated (total time) | Noise dominated (detector-on time) | Marked lightcurve |
|---|---|---|---|---|---|---|---|
| A | 7433 | 6174 | 19 | 19 | 0.26% | 0.31% | 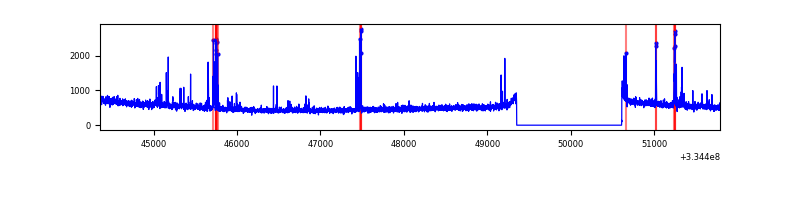 |
| B | 7433 | 6174 | 2 | 2 | 0.03% | 0.03% | 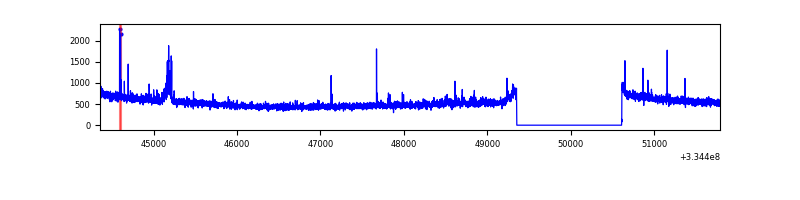 |
| C | 7433 | 6174 | 305 | 305 | 4.10% | 4.94% | 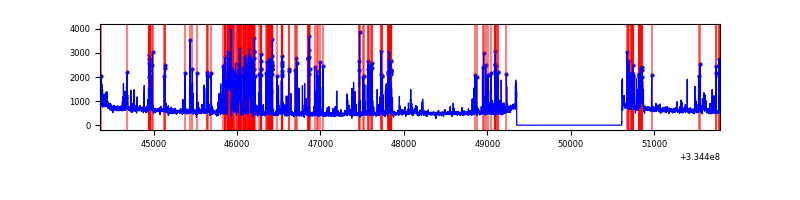 |
| D | 7433 | 6174 | 1 | 1 | 0.01% | 0.02% | 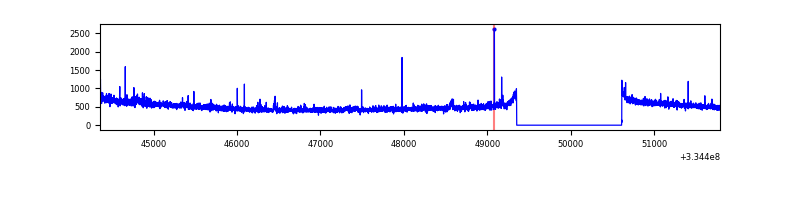 |
Top three noisy pixels from each quadrant. If the there are fewer than three noisy pixels in the level2.evt file, extra rows are filled as -1
| Pixel properties | Quadrant properties | ||||||
|---|---|---|---|---|---|---|---|
| Quadrant | DetID | PixID | Counts | Sigma | Mean | Median | Sigma |
| A | 0 | 13 | 194298 | 1178.52 | 817 | 803 | 164.2 |
| A | 13 | 254 | 11328 | 64.1 | 817 | 803 | 164.2 |
| A | 3 | 137 | 7080 | 38.23 | 817 | 803 | 164.2 |
| B | 7 | 219 | 26621 | 168.29 | 825 | 806 | 153.4 |
| B | 5 | 172 | 20020 | 125.26 | 825 | 806 | 153.4 |
| B | 0 | 230 | 17716 | 110.24 | 825 | 806 | 153.4 |
| C | 4 | 254 | 1289041 | 7127.79 | 781 | 788 | 180.7 |
| C | 14 | 238 | 125830 | 691.85 | 781 | 788 | 180.7 |
| C | 3 | 233 | 81154 | 444.66 | 781 | 788 | 180.7 |
| D | 2 | 234 | 30583 | 156.34 | 805 | 788 | 190.6 |
| D | 11 | 176 | 23402 | 118.66 | 805 | 788 | 190.6 |
| D | 1 | 52 | 13656 | 67.52 | 805 | 788 | 190.6 |
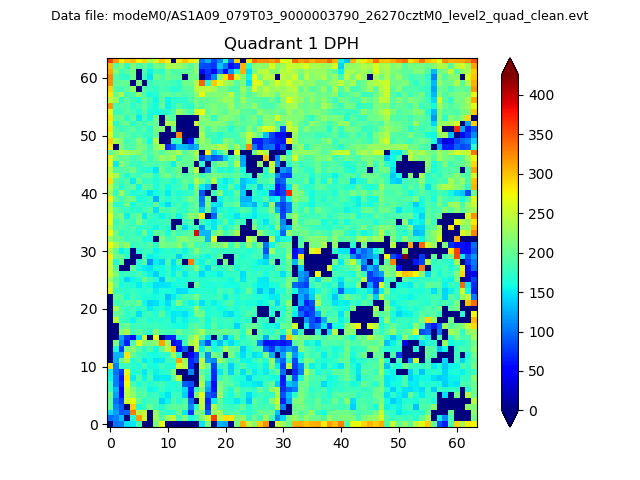
Histogram calculated using DETX and DETY for each event in the final _common_clean file
| Quadrant A |  |
 |
Quadrant B |
|---|---|---|---|
| Quadrant D | 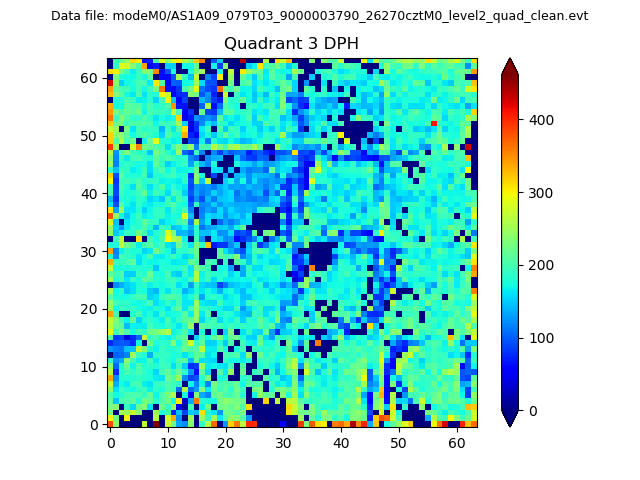 |
 |
Quadrant C |
| Plot type | Count rate plots | Images |
|---|---|---|
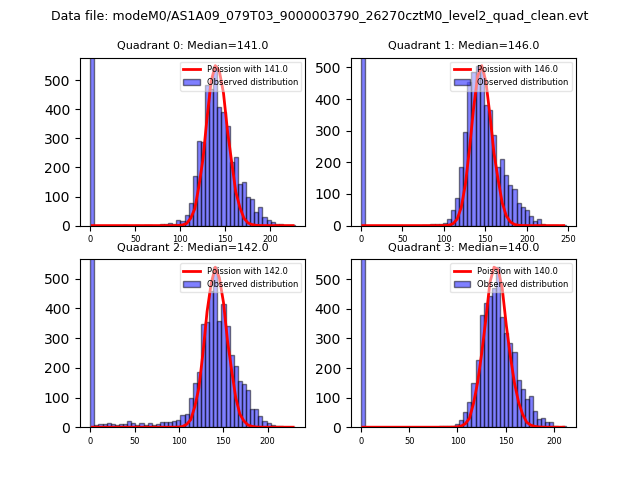
| Comparison with Poisson distribution Blue bars denote a histogram of data divided into 1 sec bins. Red curve is a Poisson curve with rate = median count rate of data. |
 |
 |
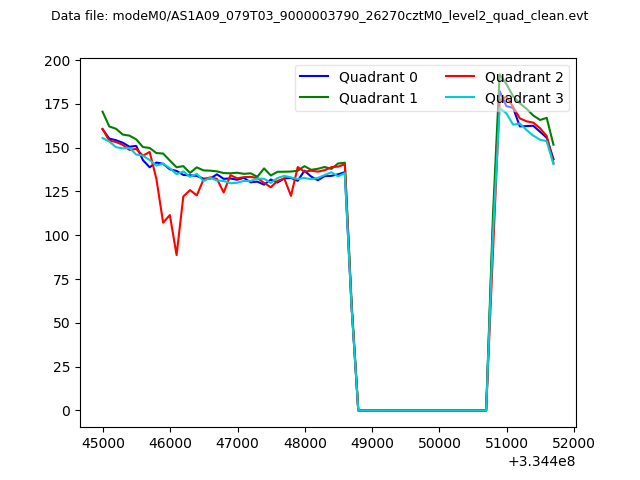
| Quadrant-wise count rates Data is divided into 100 sec bins |
 |
|
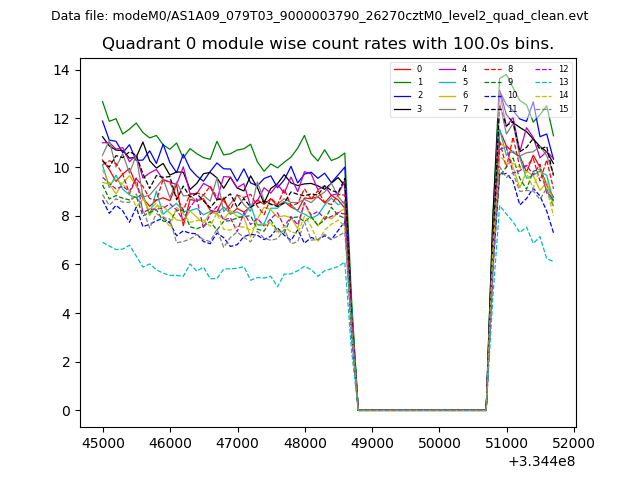
| Module-wise count rates for Quadrant A Data is divided into 100 sec bins |
 |
 |
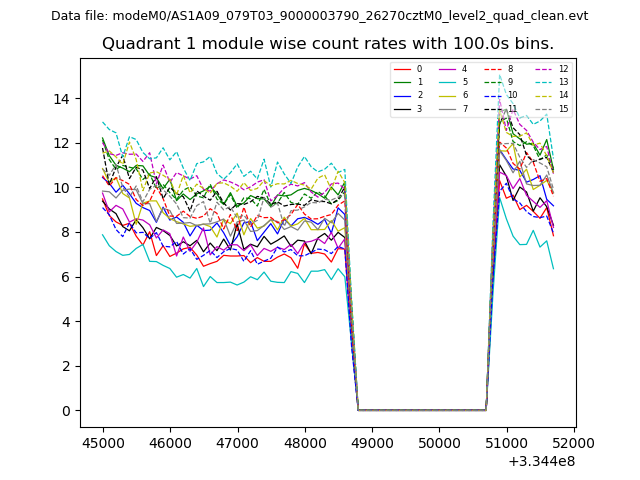
| Module-wise count rates for Quadrant B Data is divided into 100 sec bins |
 |
 |
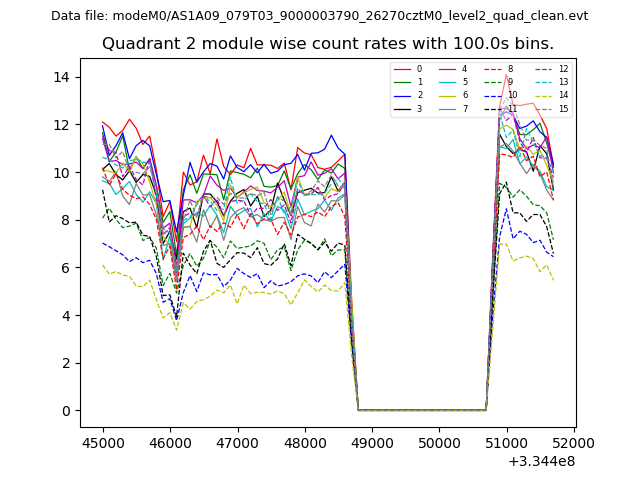
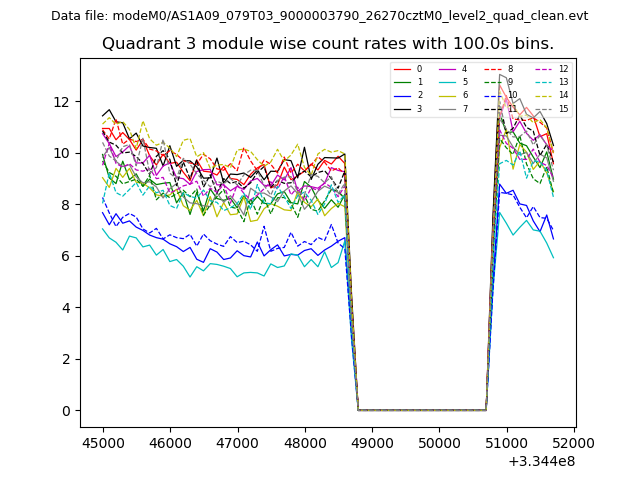
| Module-wise count rates for Quadrant C Data is divided into 100 sec bins |
 |
 |
| Module-wise count rates for Quadrant D Data is divided into 100 sec bins |
 |
 |
| Parameter | Plot |
|---|---|
| CZT HV Monitor | 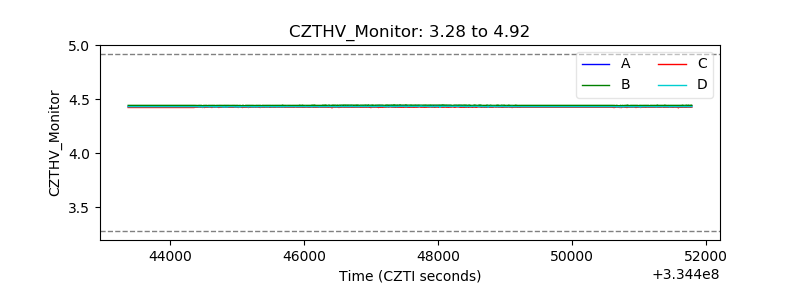 |
| D_VDD | 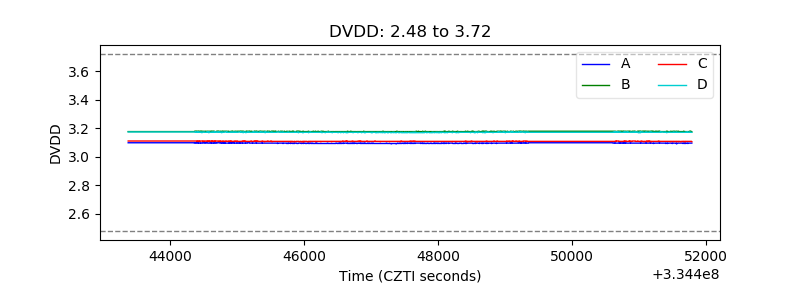 |
| Temperature 1 | 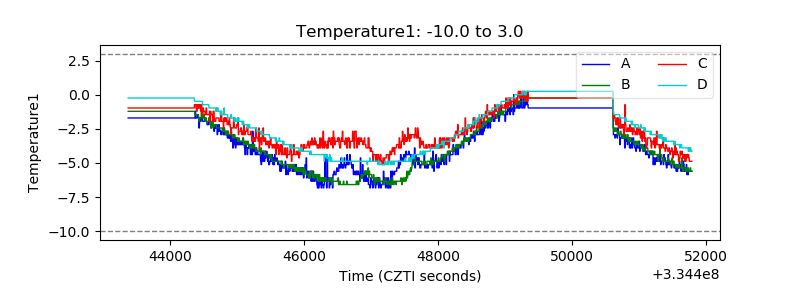 |
| Veto HV Monitor |  |
| Veto LLD | 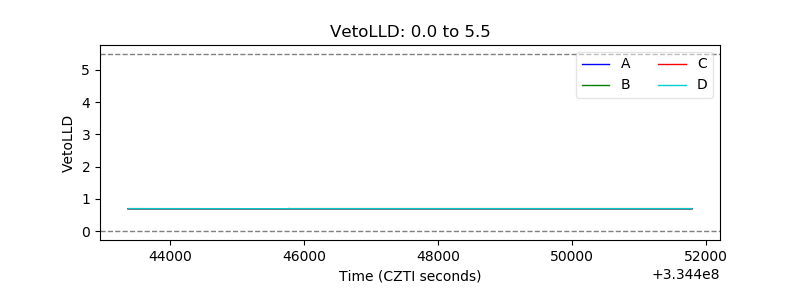 |
| Alpha Counter | 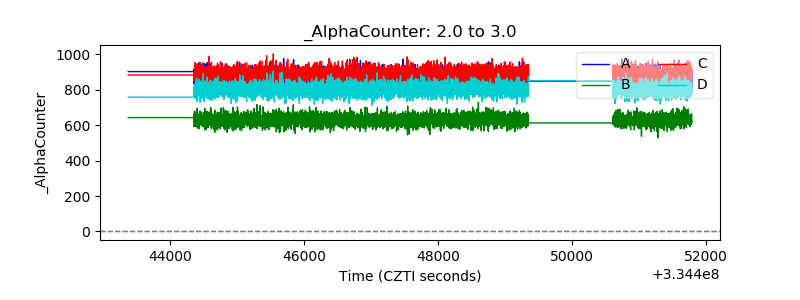 |
| _CPM_Rate | 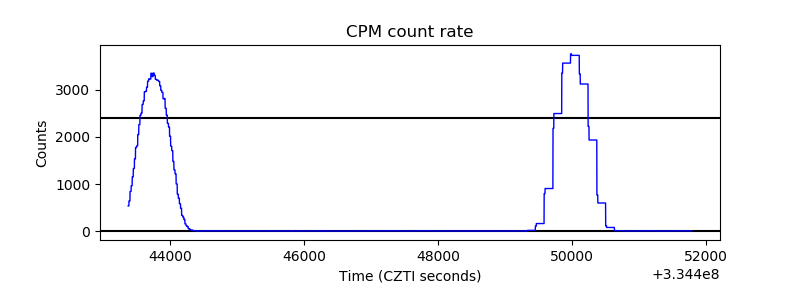 |
| CZT Counter |  |
| +2.5 Volts monitor |  |
| +5 Volts monitor |  |
| _ROLL_ROT | 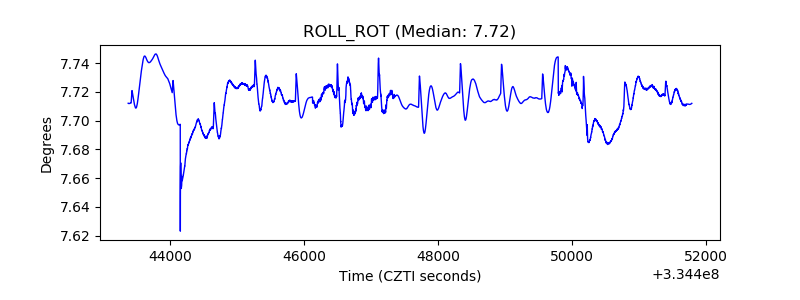 |
| _Roll_DEC | 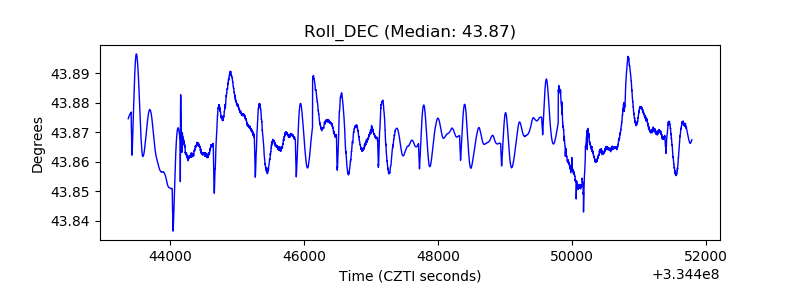 |
| _Roll_RA |  |
| Veto Counter | 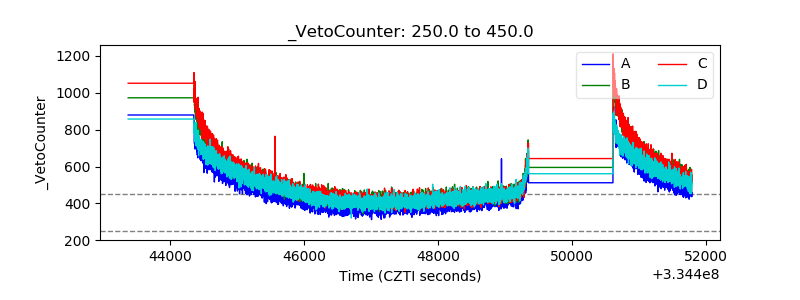 |