| Param | Original file | Final file |
|---|---|---|
| Filename | modeM0/AS1A09_079T03_9000003790_26271cztM0_level2.evt | modeM0/AS1A09_079T03_9000003790_26271cztM0_level2_quad_clean.evt |
| Size (bytes) | 490,426,560 | 116,521,920 |
| Size | 467.7 MB | 111.1 MB |
| Events in quadrant A | 3,942,555 | 763,690 |
| Events in quadrant B | 3,381,210 | 804,679 |
| Events in quadrant C | 3,953,499 | 771,240 |
| Events in quadrant D | 3,149,719 | 751,803 |
| Mode M0 | |||
|---|---|---|---|
| Quadrant | BADHDUFLAG | Total packets | Discarded packets |
| A | 0 | 15731 | 0 |
| B | 0 | 14054 | 0 |
| C | 0 | 15876 | 0 |
| D | 0 | 13506 | 0 |
| Mode M9 | |||
|---|---|---|---|
| Quadrant | BADHDUFLAG | Total packets | Discarded packets |
| A | 0 | 22 | 0 |
| B | 0 | 23 | 0 |
| C | 0 | 23 | 0 |
| D | 0 | 23 | 0 |
| Quadrant | Total seconds | Saturated seconds | Saturation percentage |
|---|---|---|---|
| A | 6268 | 66 | 1.052967% |
| B | 6268 | 68 | 1.084876% |
| C | 6268 | 332 | 5.296745% |
| D | 6268 | 22 | 0.350989% |
Noise dominated data is calculated using 1-second bins in cleaned event files. If a bin has >2000 counts, and if more than 50% of those come from <1% of pixels, then it is considered to be noise-dominated and hence unusable.
| Quadrant | # 1 sec bins | Bins with >0 counts | Bins with >2000 counts | High rate bins dominated by noise | Noise dominated (total time) | Noise dominated (detector-on time) | Marked lightcurve |
|---|---|---|---|---|---|---|---|
| A | 7593 | 6269 | 38 | 38 | 0.50% | 0.61% | 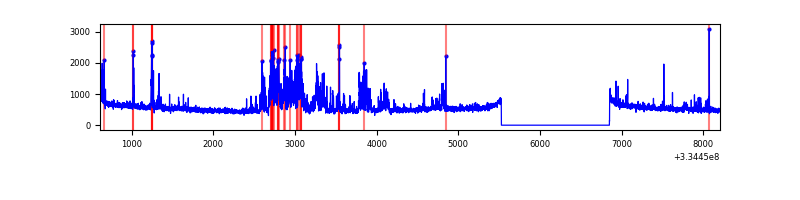 |
| B | 7593 | 6269 | 11 | 11 | 0.14% | 0.18% | 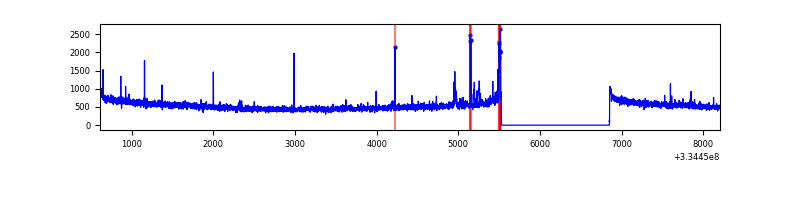 |
| C | 7593 | 6269 | 111 | 111 | 1.46% | 1.77% | 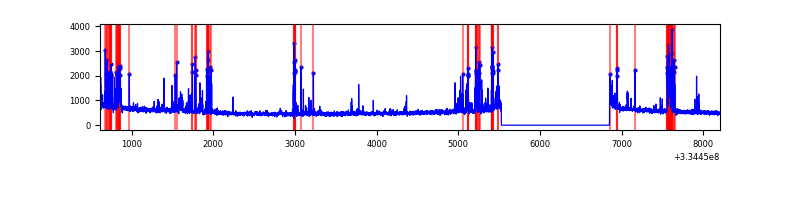 |
| D | 7593 | 6269 | 2 | 2 | 0.03% | 0.03% | 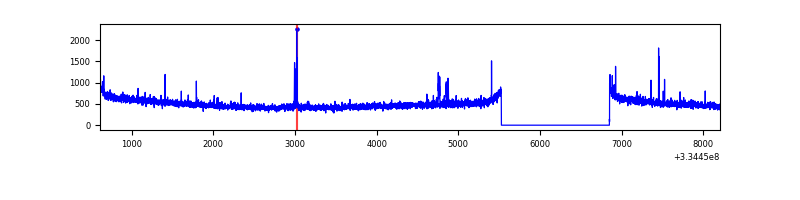 |
Top three noisy pixels from each quadrant. If the there are fewer than three noisy pixels in the level2.evt file, extra rows are filled as -1
| Pixel properties | Quadrant properties | ||||||
|---|---|---|---|---|---|---|---|
| Quadrant | DetID | PixID | Counts | Sigma | Mean | Median | Sigma |
| A | 0 | 13 | 742934 | 4527.07 | 829 | 815 | 163.9 |
| A | 13 | 254 | 11215 | 63.44 | 829 | 815 | 163.9 |
| A | 0 | 226 | 7269 | 39.37 | 829 | 815 | 163.9 |
| B | 5 | 172 | 53506 | 338.55 | 840 | 822 | 155.6 |
| B | 7 | 219 | 21307 | 131.64 | 840 | 822 | 155.6 |
| B | 12 | 111 | 17853 | 109.44 | 840 | 822 | 155.6 |
| C | 4 | 254 | 607926 | 3285.84 | 804 | 814 | 184.8 |
| C | 14 | 238 | 130916 | 704.14 | 804 | 814 | 184.8 |
| C | 3 | 233 | 45131 | 239.85 | 804 | 814 | 184.8 |
| D | 2 | 234 | 27616 | 138.58 | 814 | 796 | 193.5 |
| D | 11 | 176 | 24741 | 123.73 | 814 | 796 | 193.5 |
| D | 13 | 168 | 22958 | 114.51 | 814 | 796 | 193.5 |
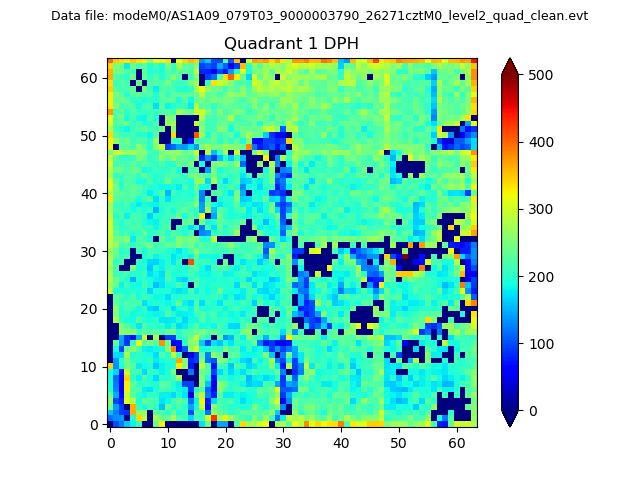
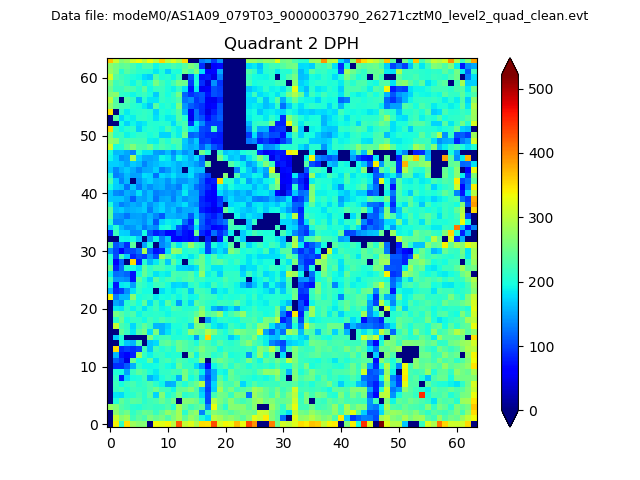
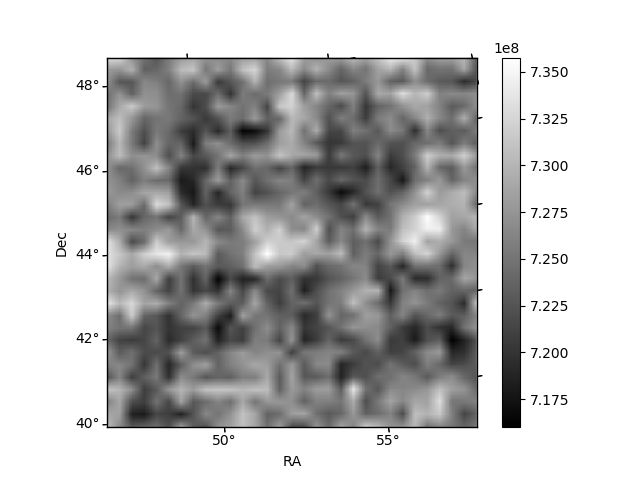
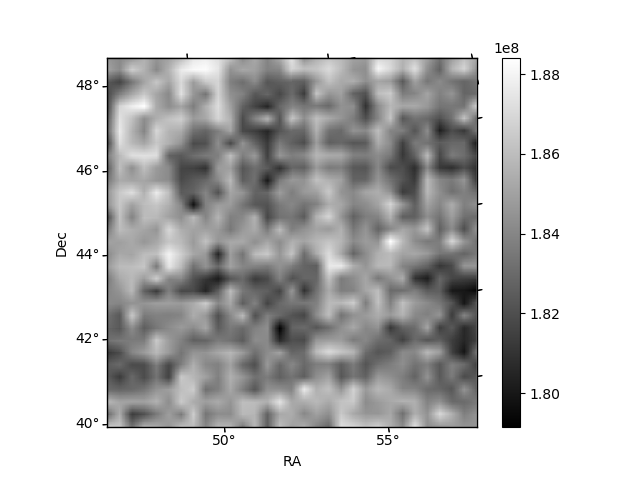
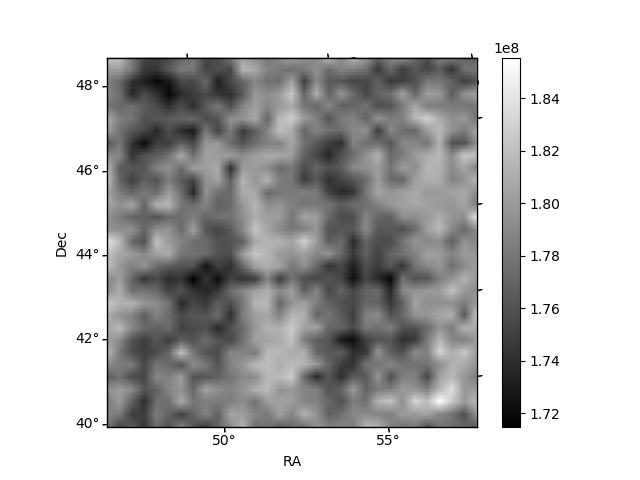
Histogram calculated using DETX and DETY for each event in the final _common_clean file
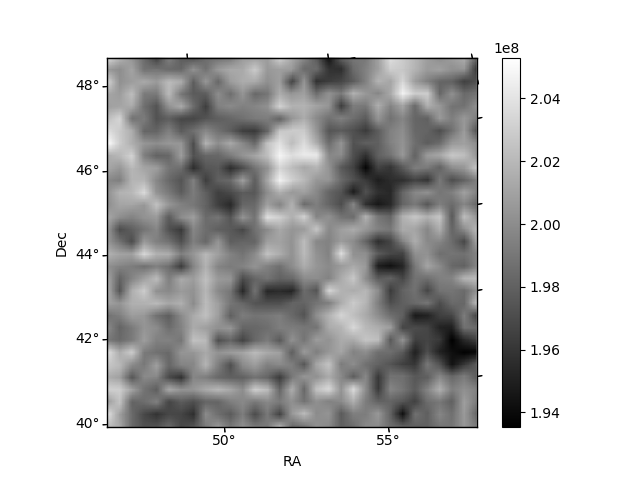
| Quadrant A |  |
 |
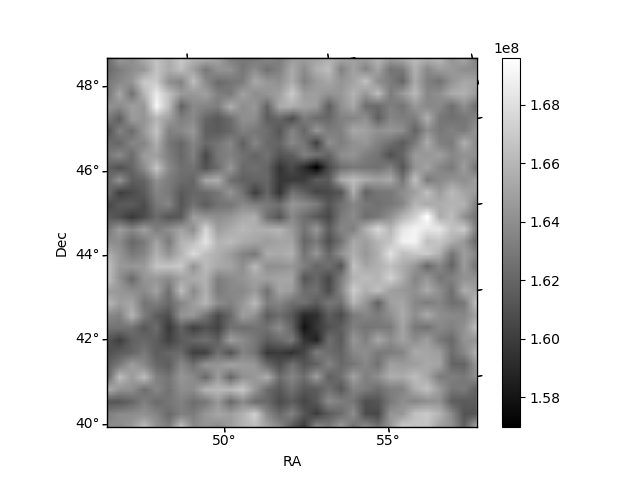
Quadrant B |
|---|---|---|---|
| Quadrant D | 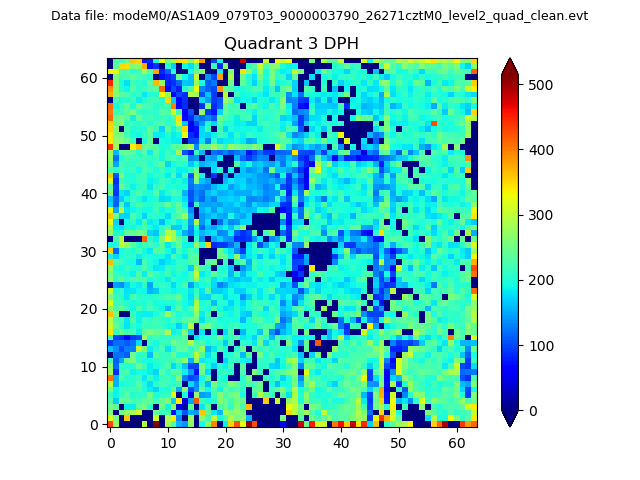 |
 |
Quadrant C |
| Plot type | Count rate plots | Images |
|---|---|---|
| Comparison with Poisson distribution Blue bars denote a histogram of data divided into 1 sec bins. Red curve is a Poisson curve with rate = median count rate of data. |
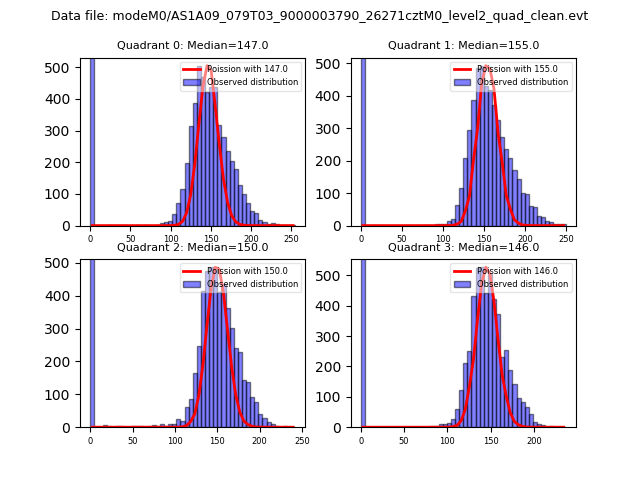 |
 |
| Quadrant-wise count rates Data is divided into 100 sec bins |
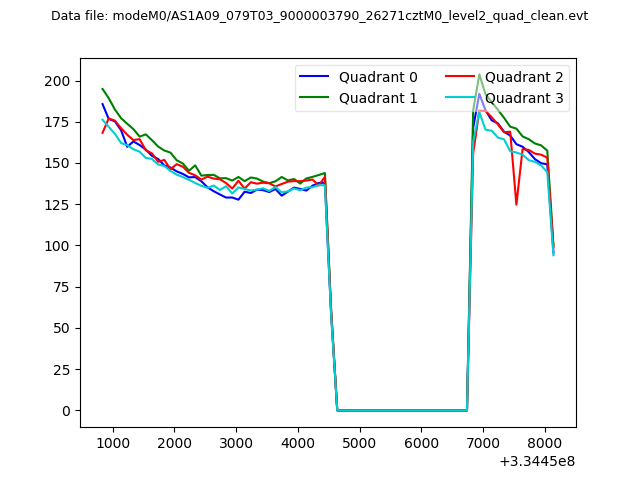 |
|
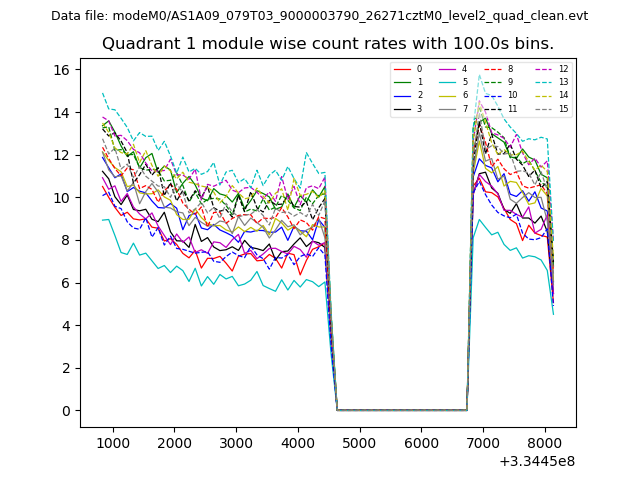
| Module-wise count rates for Quadrant A Data is divided into 100 sec bins |
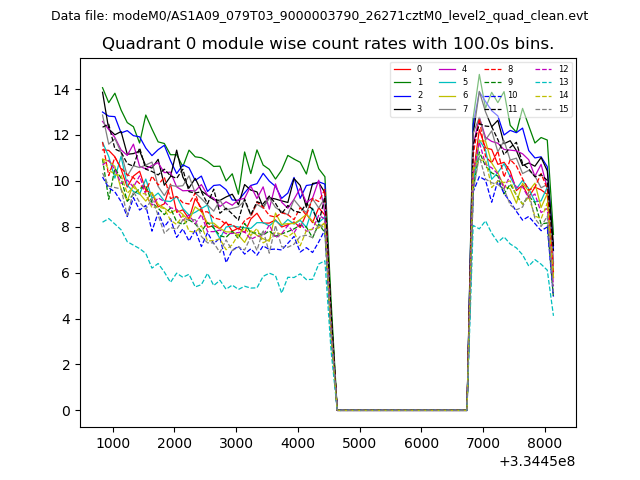 |
 |
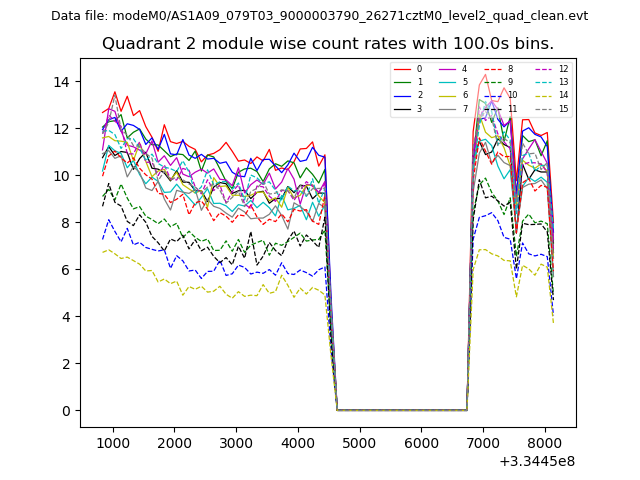
| Module-wise count rates for Quadrant B Data is divided into 100 sec bins |
 |
 |
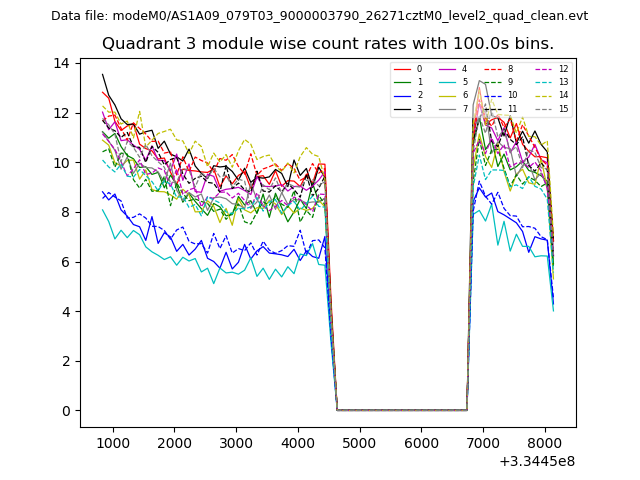
| Module-wise count rates for Quadrant C Data is divided into 100 sec bins |
 |
 |
| Module-wise count rates for Quadrant D Data is divided into 100 sec bins |
 |
 |
| Parameter | Plot |
|---|---|
| CZT HV Monitor | 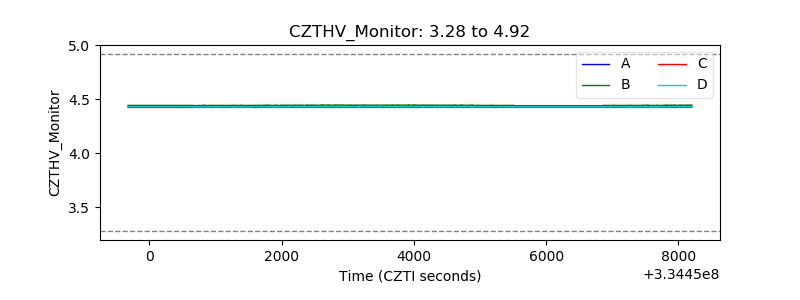 |
| D_VDD | 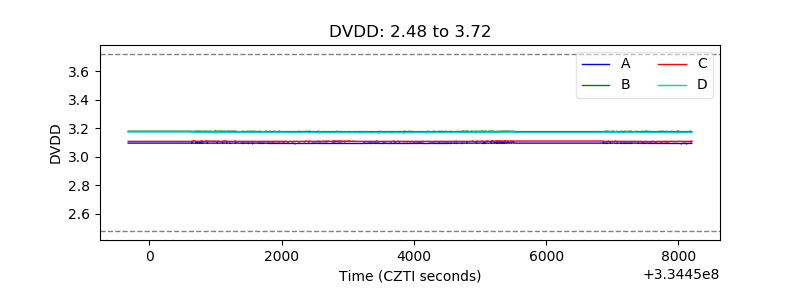 |
| Temperature 1 | 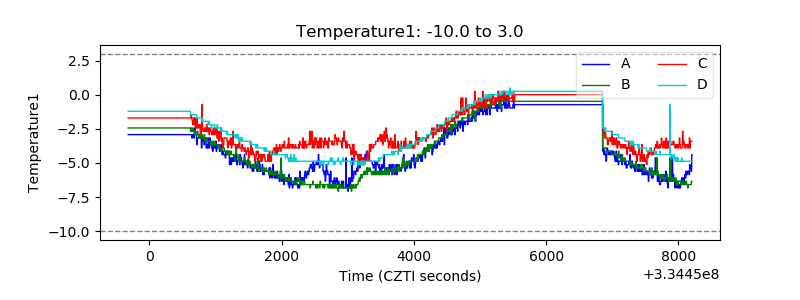 |
| Veto HV Monitor | 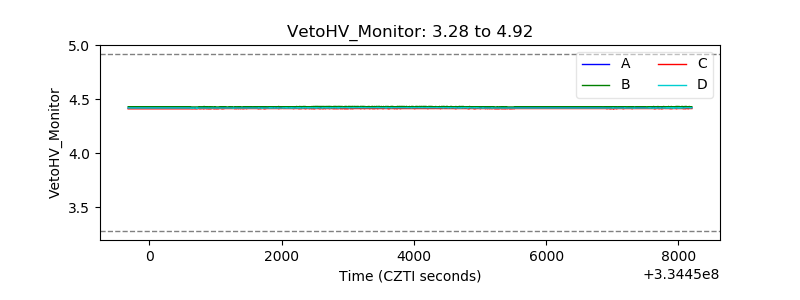 |
| Veto LLD | 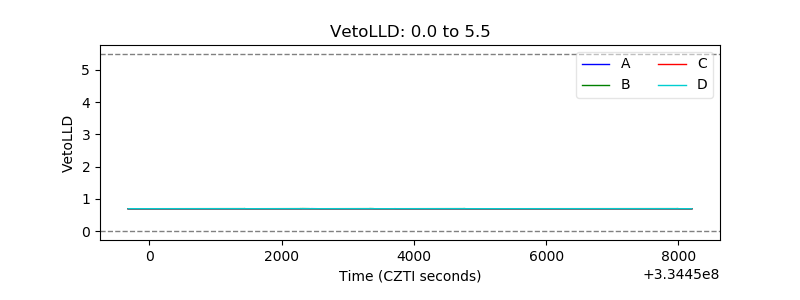 |
| Alpha Counter | 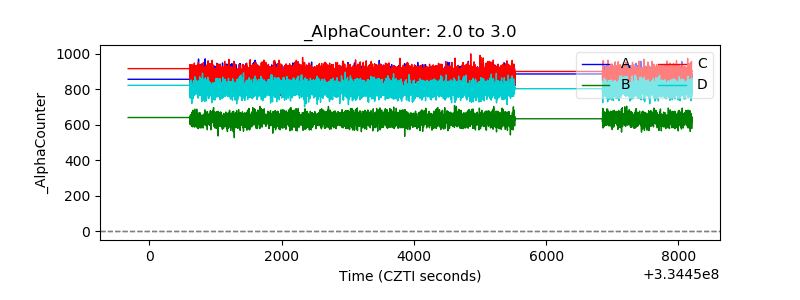 |
| _CPM_Rate | 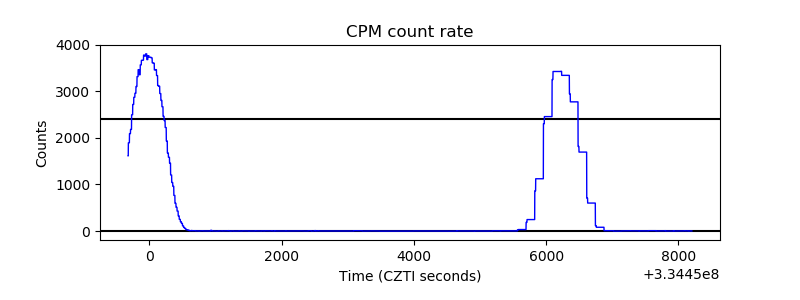 |
| CZT Counter | 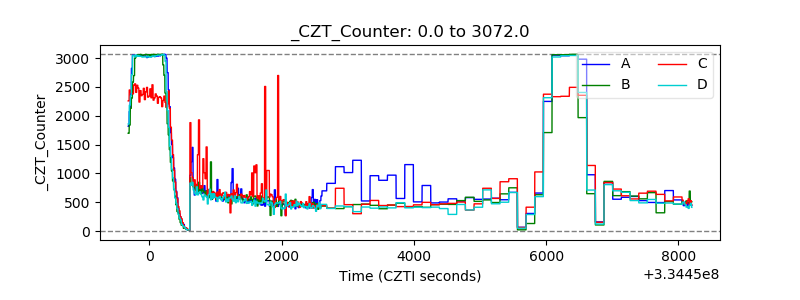 |
| +2.5 Volts monitor |  |
| +5 Volts monitor |  |
| _ROLL_ROT | 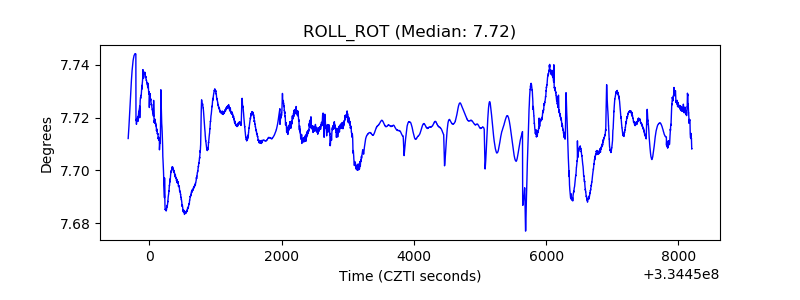 |
| _Roll_DEC | 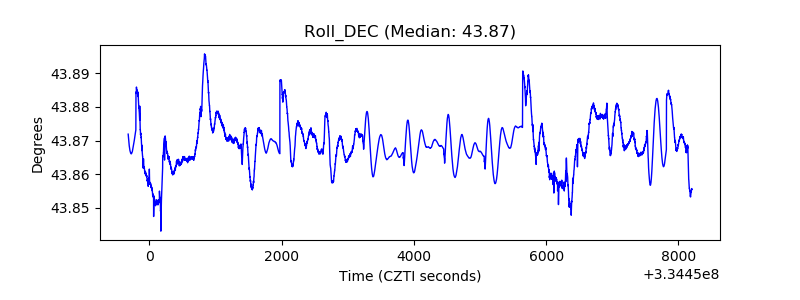 |
| _Roll_RA | 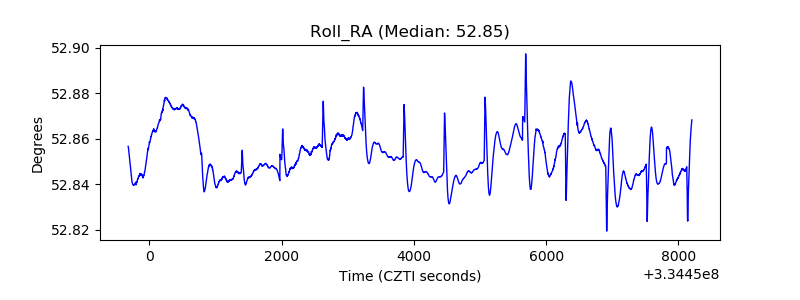 |
| Veto Counter | 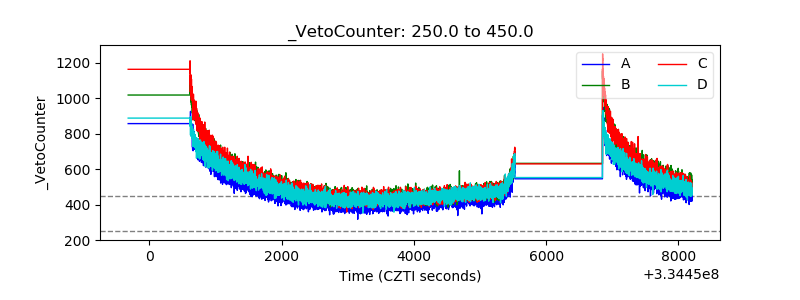 |