| Param | Original file | Final file |
|---|---|---|
| Filename | modeM0/AS1A09_079T03_9000003790_26272cztM0_level2.evt | modeM0/AS1A09_079T03_9000003790_26272cztM0_level2_quad_clean.evt |
| Size (bytes) | 457,750,080 | 111,533,760 |
| Size | 436.5 MB | 106.4 MB |
| Events in quadrant A | 3,506,111 | 725,897 |
| Events in quadrant B | 3,234,679 | 770,995 |
| Events in quadrant C | 3,693,659 | 734,717 |
| Events in quadrant D | 3,008,368 | 714,610 |
| Mode M0 | |||
|---|---|---|---|
| Quadrant | BADHDUFLAG | Total packets | Discarded packets |
| A | 0 | 14329 | 0 |
| B | 0 | 13492 | 0 |
| C | 0 | 14906 | 0 |
| D | 0 | 13063 | 0 |
| Mode M9 | |||
|---|---|---|---|
| Quadrant | BADHDUFLAG | Total packets | Discarded packets |
| A | 0 | 16 | 0 |
| B | 0 | 17 | 0 |
| C | 0 | 17 | 0 |
| D | 0 | 17 | 0 |
| Quadrant | Total seconds | Saturated seconds | Saturation percentage |
|---|---|---|---|
| A | 6185 | 116 | 1.875505% |
| B | 6184 | 40 | 0.646831% |
| C | 6184 | 276 | 4.463131% |
| D | 6184 | 15 | 0.242561% |
Noise dominated data is calculated using 1-second bins in cleaned event files. If a bin has >2000 counts, and if more than 50% of those come from <1% of pixels, then it is considered to be noise-dominated and hence unusable.
| Quadrant | # 1 sec bins | Bins with >0 counts | Bins with >2000 counts | High rate bins dominated by noise | Noise dominated (total time) | Noise dominated (detector-on time) | Marked lightcurve |
|---|---|---|---|---|---|---|---|
| A | 7565 | 6187 | 88 | 88 | 1.16% | 1.42% | 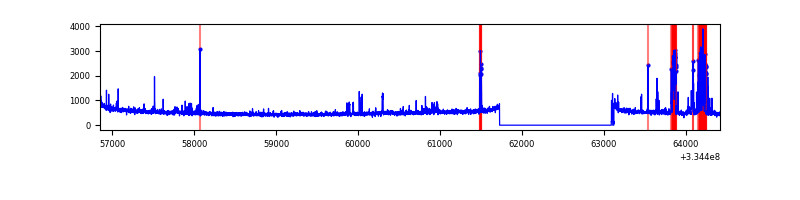 |
| B | 7564 | 6186 | 0 | 0 | 0.00% | 0.00% | 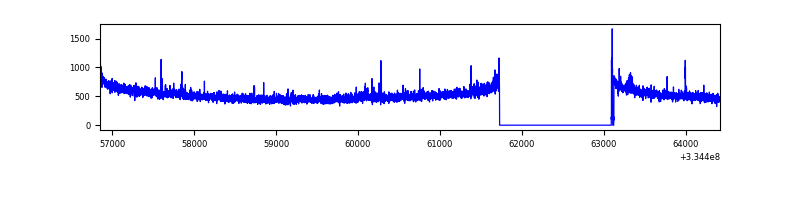 |
| C | 7564 | 6186 | 77 | 77 | 1.02% | 1.24% | 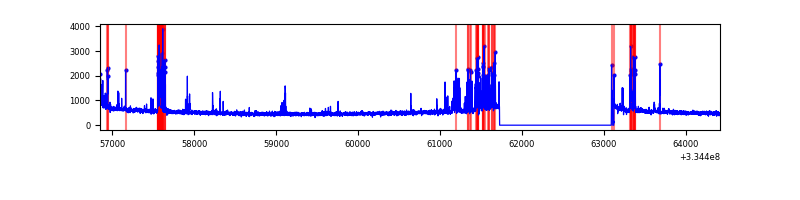 |
| D | 7564 | 6186 | 3 | 3 | 0.04% | 0.05% | 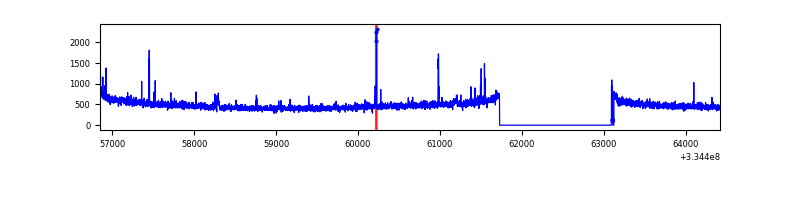 |
Top three noisy pixels from each quadrant. If the there are fewer than three noisy pixels in the level2.evt file, extra rows are filled as -1
| Pixel properties | Quadrant properties | ||||||
|---|---|---|---|---|---|---|---|
| Quadrant | DetID | PixID | Counts | Sigma | Mean | Median | Sigma |
| A | 0 | 13 | 424870 | 2676.99 | 798 | 783 | 158.4 |
| A | 13 | 254 | 11102 | 65.14 | 798 | 783 | 158.4 |
| A | 3 | 137 | 6915 | 38.71 | 798 | 783 | 158.4 |
| B | 12 | 111 | 17360 | 109.46 | 816 | 799 | 151.3 |
| B | 7 | 219 | 16962 | 106.83 | 816 | 799 | 151.3 |
| B | 11 | 111 | 15402 | 96.52 | 816 | 799 | 151.3 |
| C | 4 | 254 | 505781 | 2835.06 | 776 | 783 | 178.1 |
| C | 14 | 238 | 125889 | 702.34 | 776 | 783 | 178.1 |
| C | 3 | 233 | 25430 | 138.37 | 776 | 783 | 178.1 |
| D | 2 | 234 | 25461 | 133.56 | 780 | 763 | 184.9 |
| D | 11 | 176 | 17671 | 91.43 | 780 | 763 | 184.9 |
| D | 10 | 103 | 11669 | 58.98 | 780 | 763 | 184.9 |
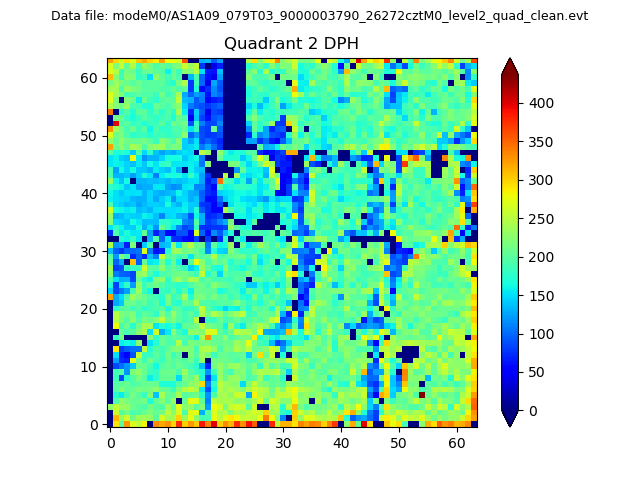
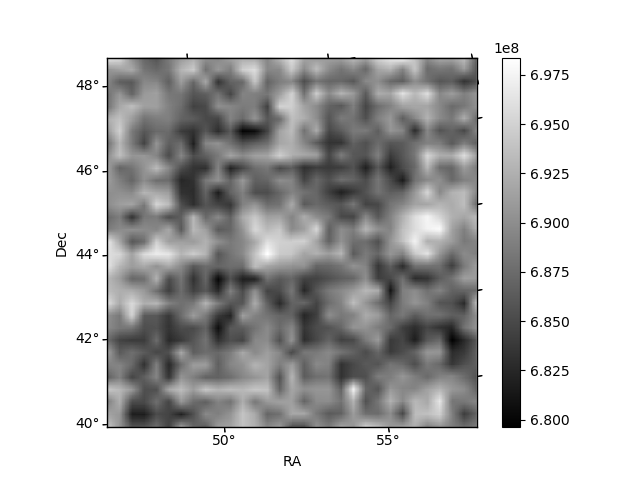
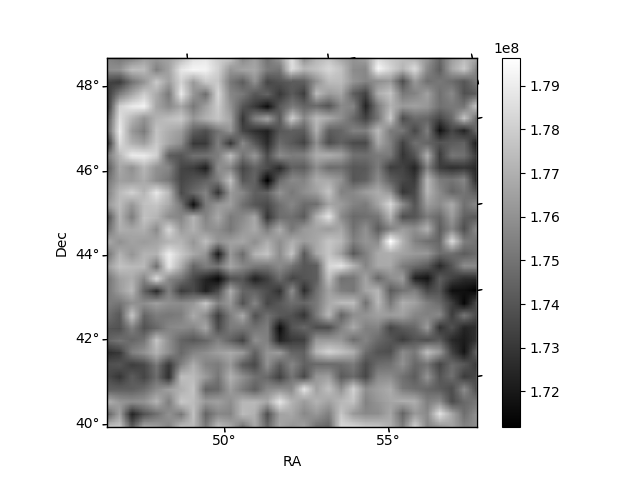
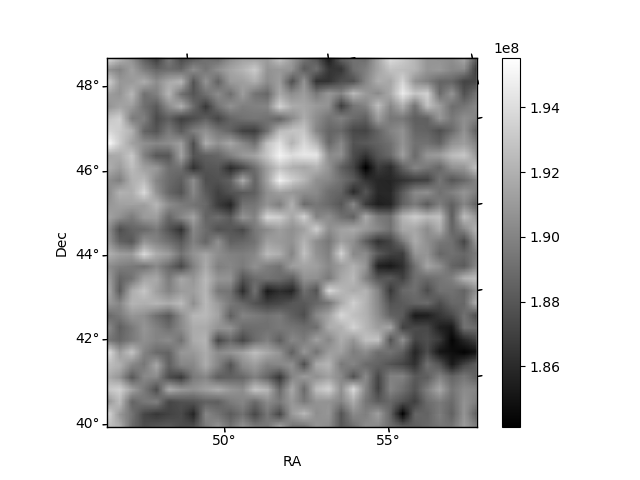
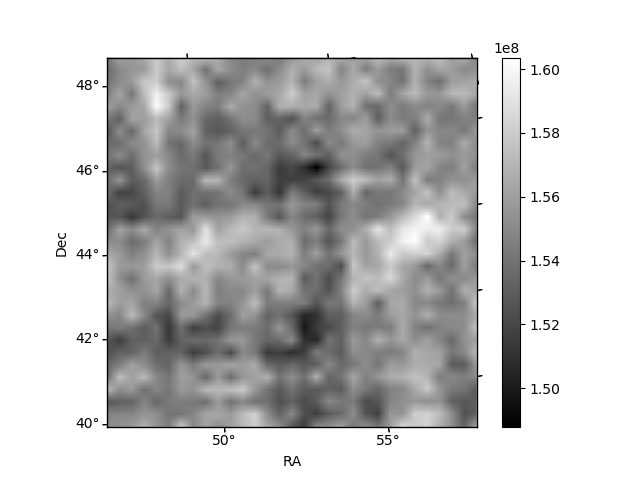
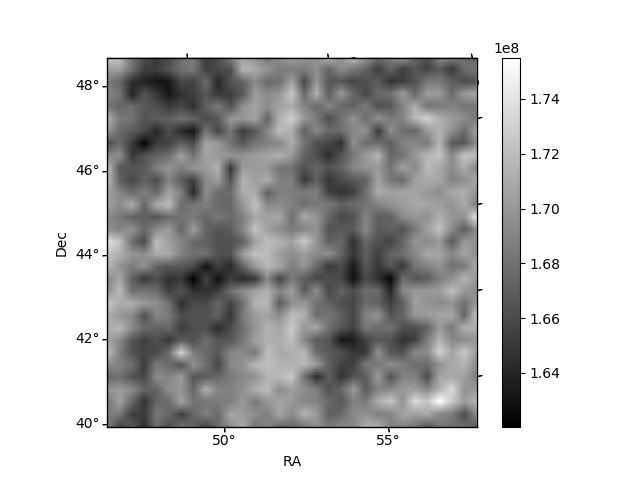
Histogram calculated using DETX and DETY for each event in the final _common_clean file
| Quadrant A | 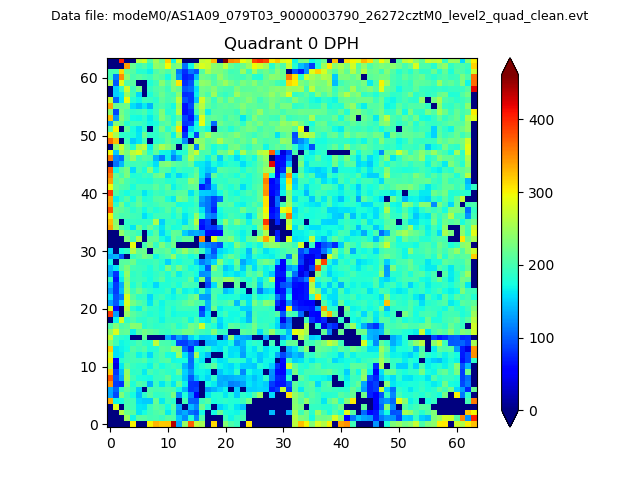 |
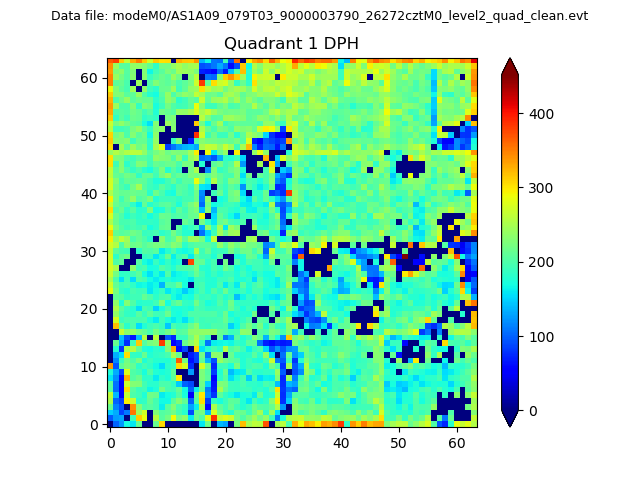 |
Quadrant B |
|---|---|---|---|
| Quadrant D | 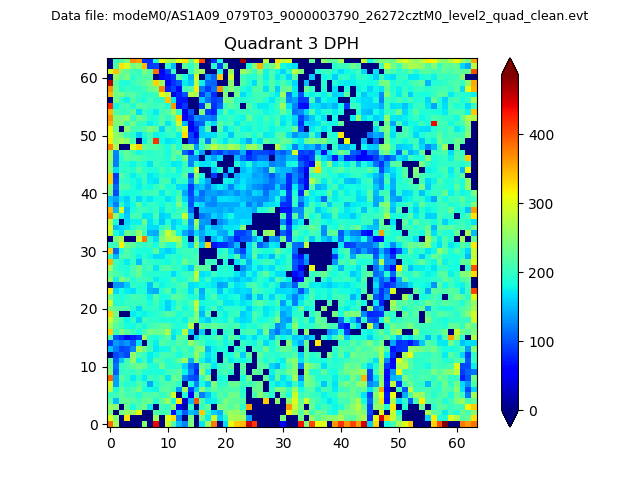 |
 |
Quadrant C |
| Plot type | Count rate plots | Images |
|---|---|---|
| Comparison with Poisson distribution Blue bars denote a histogram of data divided into 1 sec bins. Red curve is a Poisson curve with rate = median count rate of data. |
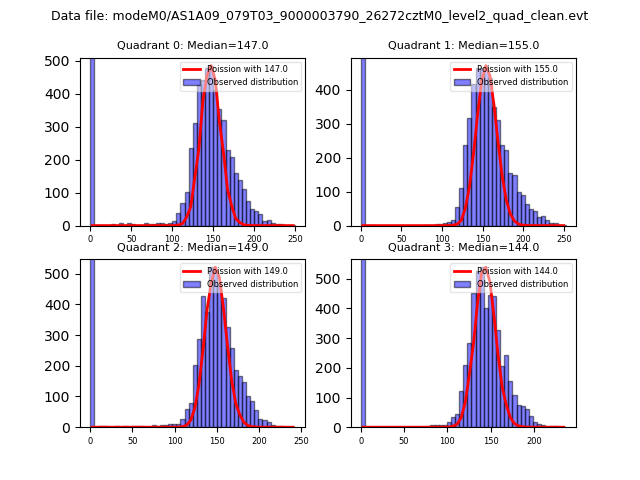 |
 |
| Quadrant-wise count rates Data is divided into 100 sec bins |
 |
|
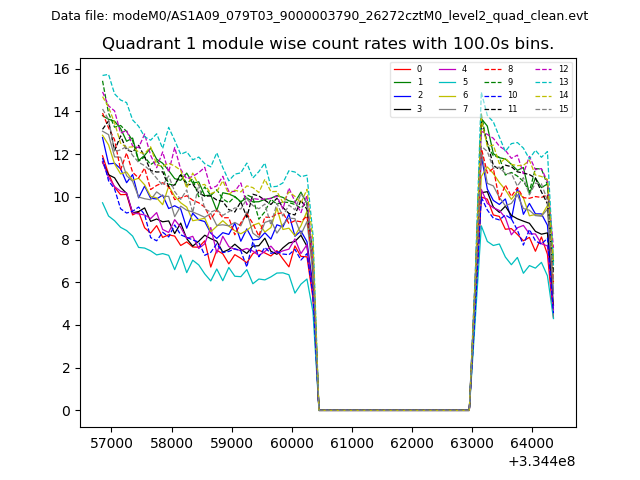
| Module-wise count rates for Quadrant A Data is divided into 100 sec bins |
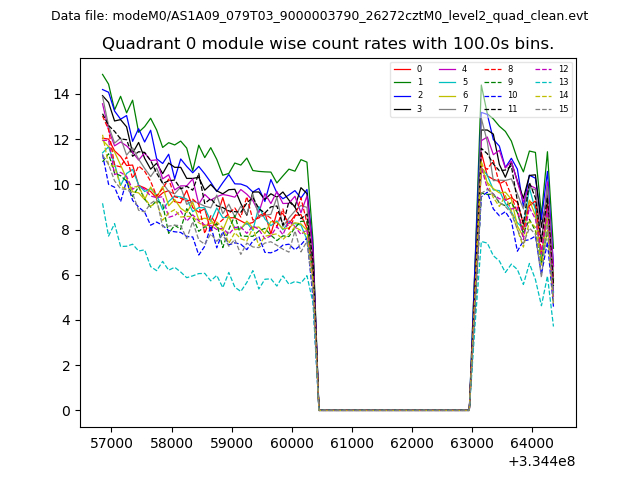 |
 |
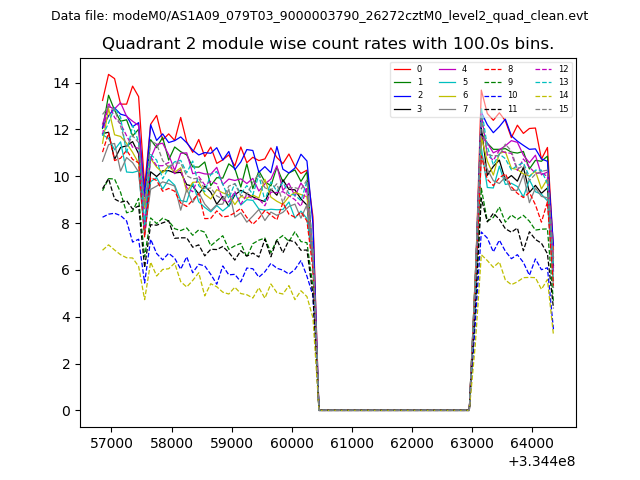
| Module-wise count rates for Quadrant B Data is divided into 100 sec bins |
 |
 |
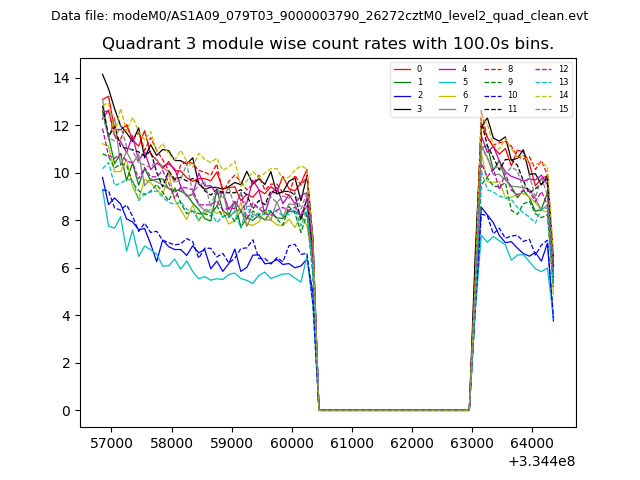
| Module-wise count rates for Quadrant C Data is divided into 100 sec bins |
 |
 |
| Module-wise count rates for Quadrant D Data is divided into 100 sec bins |
 |
 |
| Parameter | Plot |
|---|---|
| CZT HV Monitor | 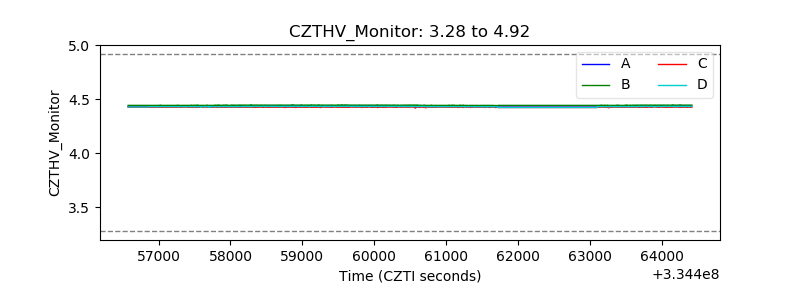 |
| D_VDD | 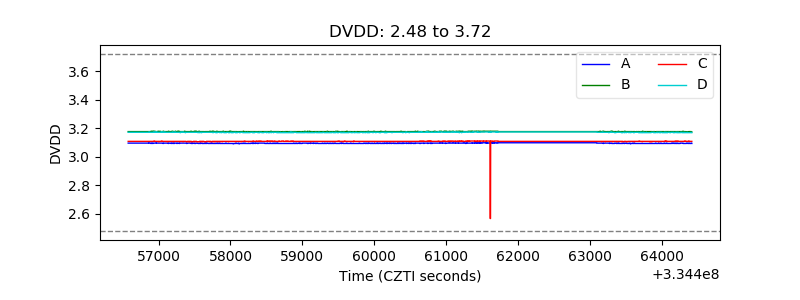 |
| Temperature 1 | 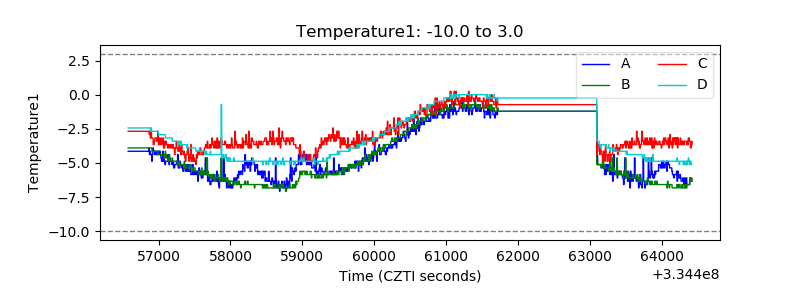 |
| Veto HV Monitor | 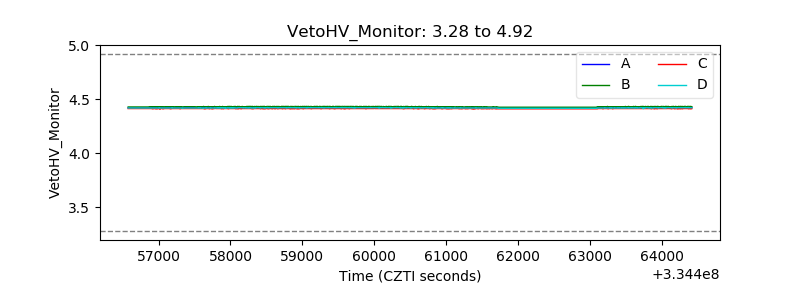 |
| Veto LLD | 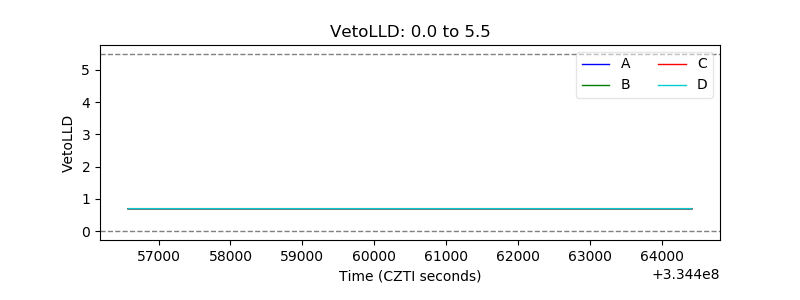 |
| Alpha Counter | 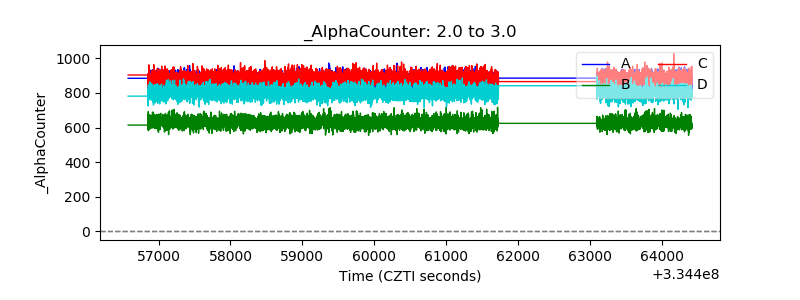 |
| _CPM_Rate | 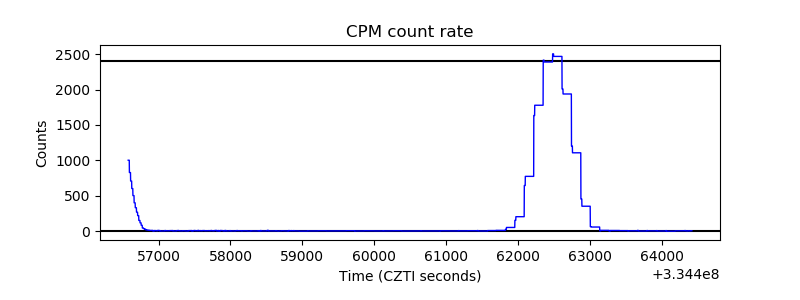 |
| CZT Counter | 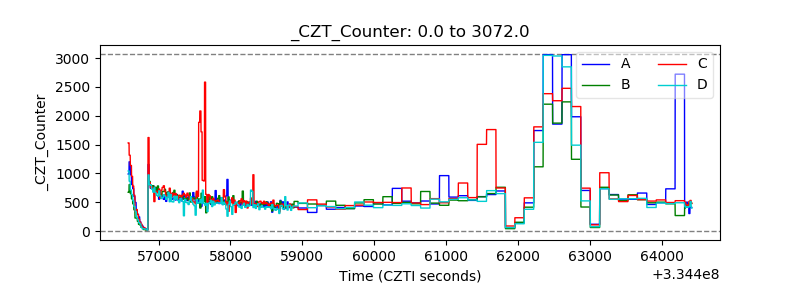 |
| +2.5 Volts monitor |  |
| +5 Volts monitor |  |
| _ROLL_ROT | 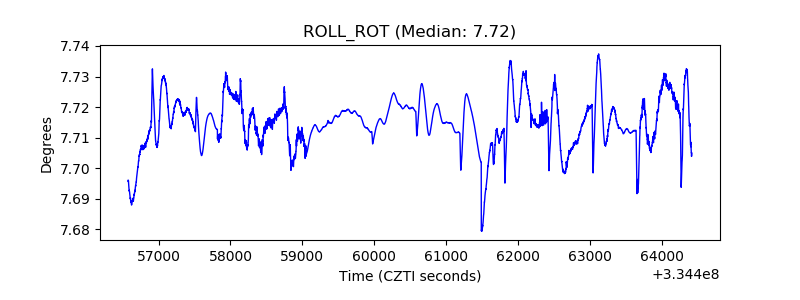 |
| _Roll_DEC | 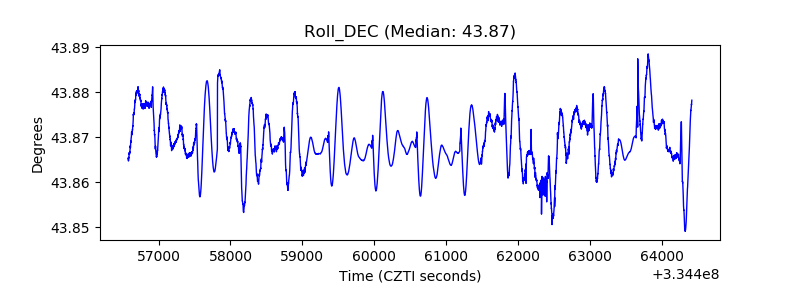 |
| _Roll_RA | 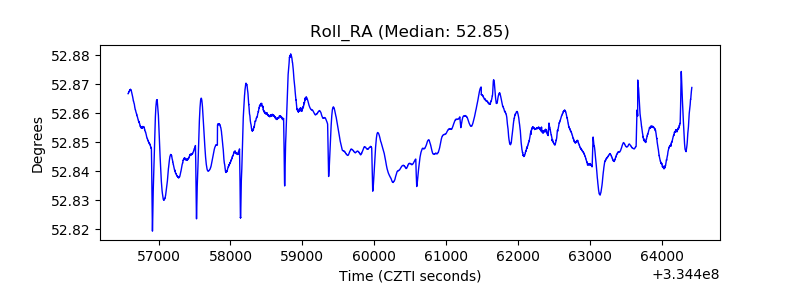 |
| Veto Counter | 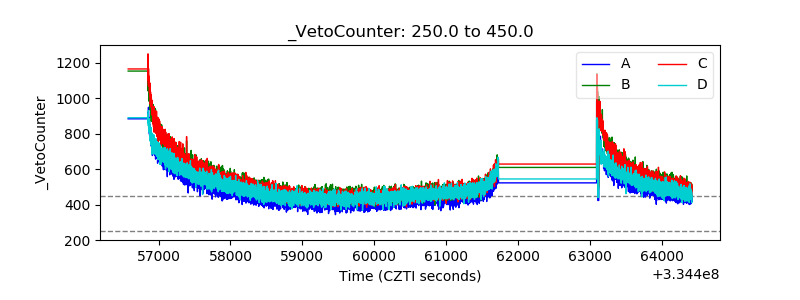 |