| Param | Original file | Final file |
|---|---|---|
| Filename | modeM0/AS1A09_079T03_9000003790_26273cztM0_level2.evt | modeM0/AS1A09_079T03_9000003790_26273cztM0_level2_quad_clean.evt |
| Size (bytes) | 487,918,080 | 105,589,440 |
| Size | 465.3 MB | 100.7 MB |
| Events in quadrant A | 3,645,662 | 674,520 |
| Events in quadrant B | 3,341,913 | 714,708 |
| Events in quadrant C | 4,124,244 | 680,422 |
| Events in quadrant D | 3,213,520 | 664,994 |
| Mode M0 | |||
|---|---|---|---|
| Quadrant | BADHDUFLAG | Total packets | Discarded packets |
| A | 0 | 15079 | 0 |
| B | 0 | 14115 | 0 |
| C | 0 | 16474 | 0 |
| D | 0 | 14147 | 0 |
| Mode M9 | |||
|---|---|---|---|
| Quadrant | BADHDUFLAG | Total packets | Discarded packets |
| A | 0 | 18 | 0 |
| B | 0 | 19 | 0 |
| C | 0 | 19 | 0 |
| D | 0 | 19 | 0 |
| Quadrant | Total seconds | Saturated seconds | Saturation percentage |
|---|---|---|---|
| A | 6640 | 128 | 1.927711% |
| B | 6640 | 45 | 0.677711% |
| C | 6640 | 369 | 5.557229% |
| D | 6640 | 53 | 0.798193% |
Noise dominated data is calculated using 1-second bins in cleaned event files. If a bin has >2000 counts, and if more than 50% of those come from <1% of pixels, then it is considered to be noise-dominated and hence unusable.
| Quadrant | # 1 sec bins | Bins with >0 counts | Bins with >2000 counts | High rate bins dominated by noise | Noise dominated (total time) | Noise dominated (detector-on time) | Marked lightcurve |
|---|---|---|---|---|---|---|---|
| A | 7925 | 6642 | 93 | 93 | 1.17% | 1.40% | 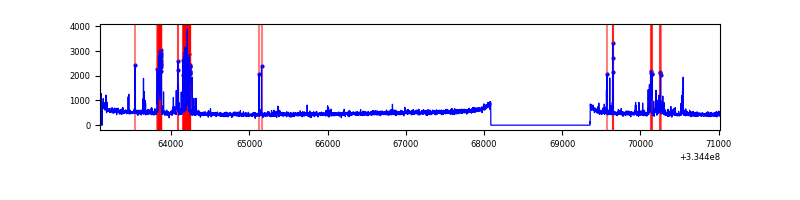 |
| B | 7925 | 6642 | 0 | 0 | 0.00% | 0.00% | 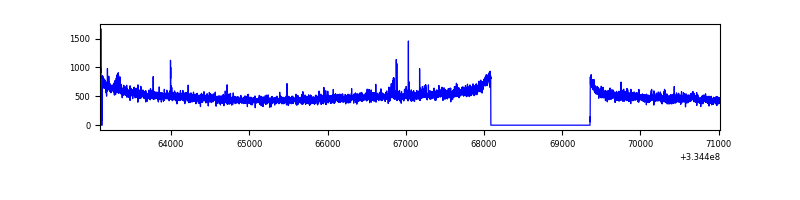 |
| C | 7925 | 6642 | 172 | 172 | 2.17% | 2.59% | 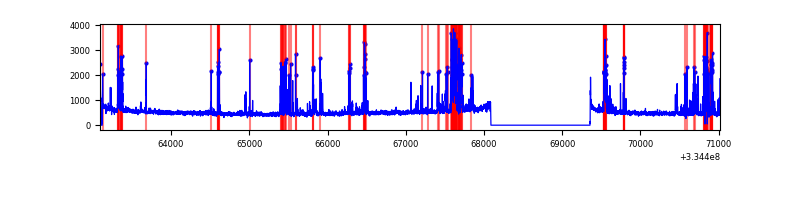 |
| D | 7925 | 6642 | 34 | 34 | 0.43% | 0.51% | 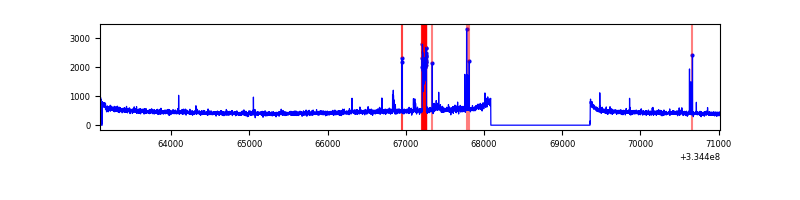 |
Top three noisy pixels from each quadrant. If the there are fewer than three noisy pixels in the level2.evt file, extra rows are filled as -1
| Pixel properties | Quadrant properties | ||||||
|---|---|---|---|---|---|---|---|
| Quadrant | DetID | PixID | Counts | Sigma | Mean | Median | Sigma |
| A | 0 | 13 | 450225 | 2736.09 | 828 | 812 | 164.3 |
| A | 13 | 254 | 11033 | 62.23 | 828 | 812 | 164.3 |
| A | 3 | 137 | 7224 | 39.04 | 828 | 812 | 164.3 |
| B | 12 | 111 | 18438 | 111.88 | 844 | 825 | 157.4 |
| B | 11 | 111 | 16136 | 97.26 | 844 | 825 | 157.4 |
| B | 7 | 219 | 15645 | 94.14 | 844 | 825 | 157.4 |
| C | 4 | 254 | 841289 | 4542.09 | 796 | 801 | 185.0 |
| C | 14 | 238 | 127723 | 685.9 | 796 | 801 | 185.0 |
| C | 3 | 233 | 38945 | 206.13 | 796 | 801 | 185.0 |
| D | 1 | 52 | 109475 | 572.14 | 806 | 788 | 190.0 |
| D | 2 | 234 | 27130 | 138.67 | 806 | 788 | 190.0 |
| D | 14 | 35 | 13037 | 64.48 | 806 | 788 | 190.0 |
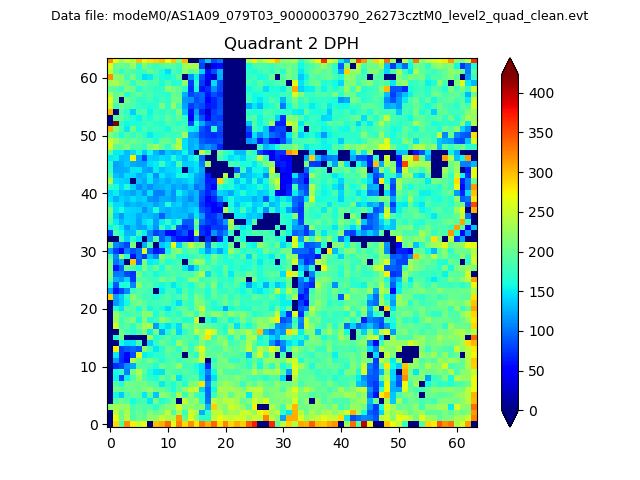
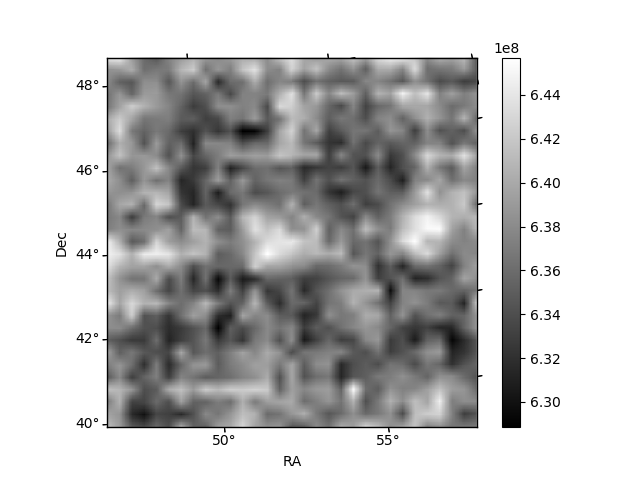
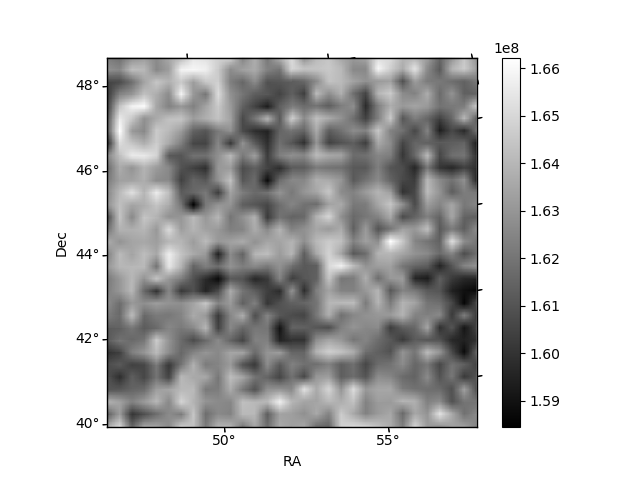
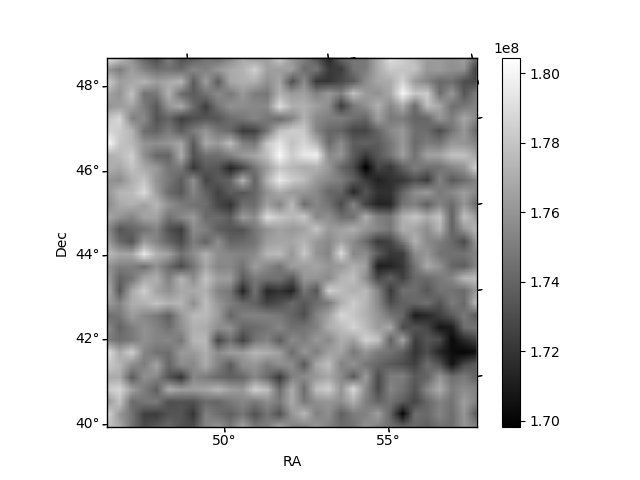
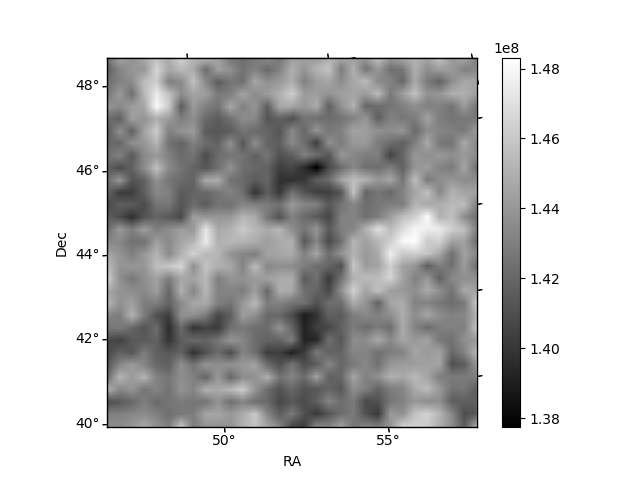
Histogram calculated using DETX and DETY for each event in the final _common_clean file
| Quadrant A | 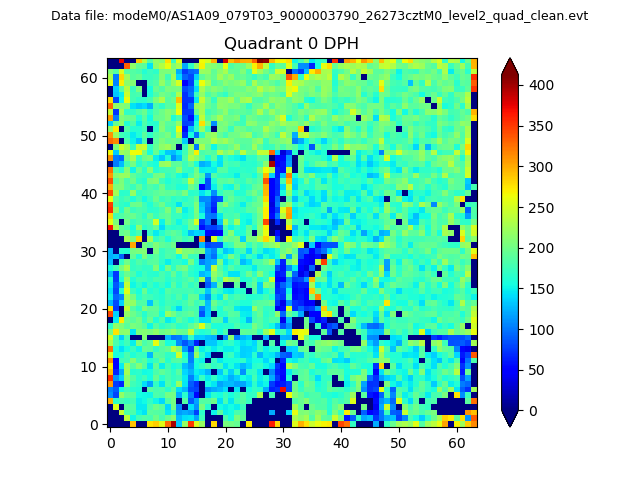 |
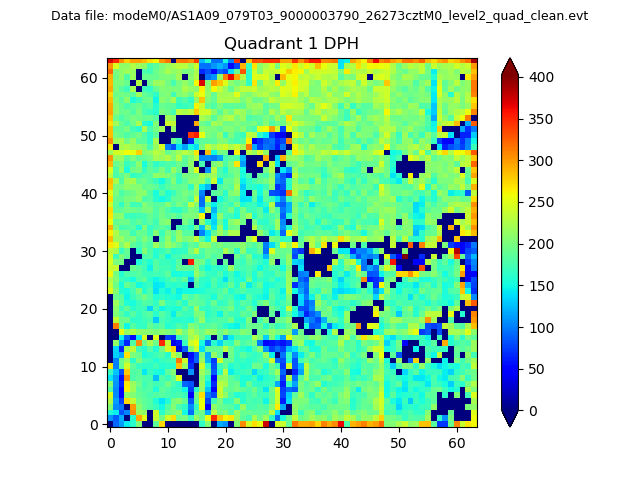 |
Quadrant B |
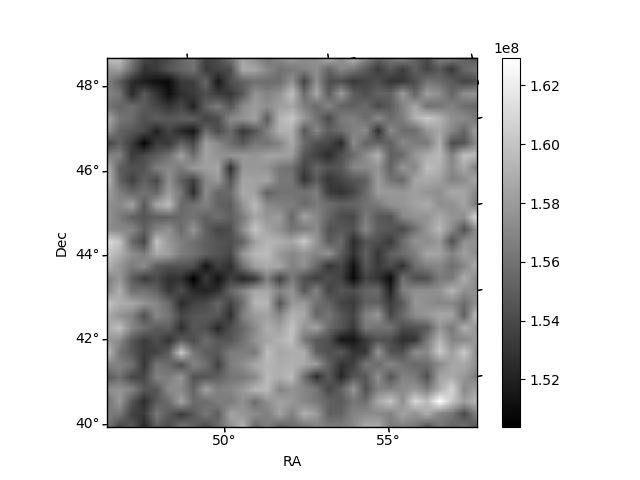
|---|---|---|---|
| Quadrant D | 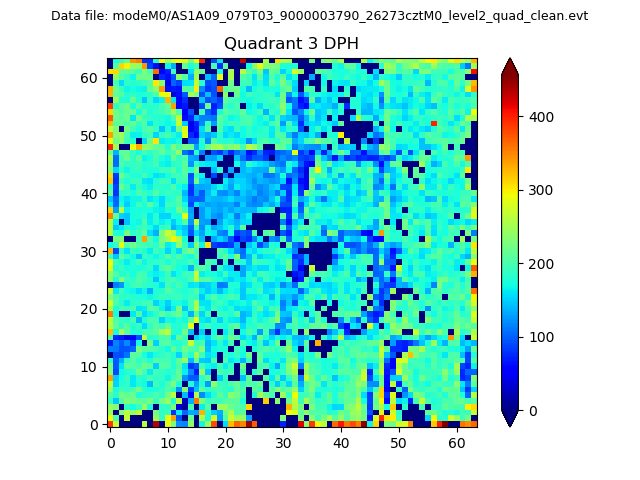 |
 |
Quadrant C |
| Plot type | Count rate plots | Images |
|---|---|---|
| Comparison with Poisson distribution Blue bars denote a histogram of data divided into 1 sec bins. Red curve is a Poisson curve with rate = median count rate of data. |
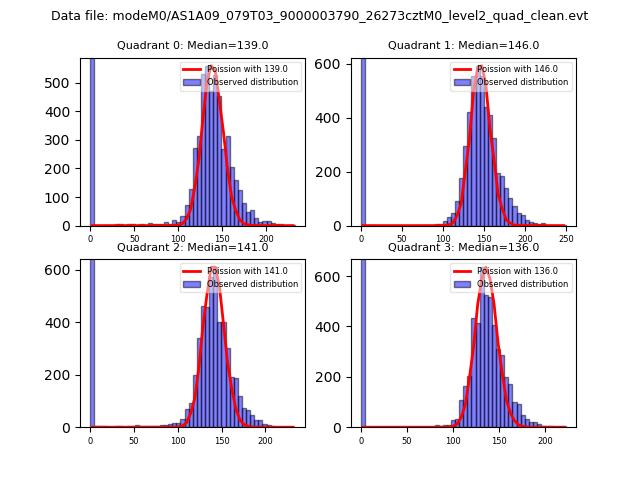 |
 |
| Quadrant-wise count rates Data is divided into 100 sec bins |
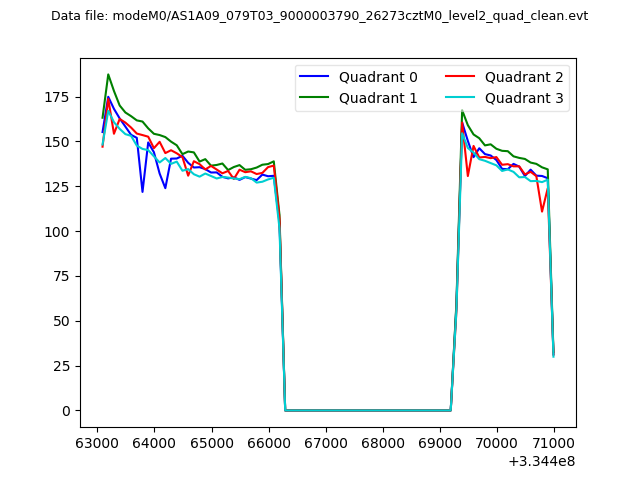 |
|
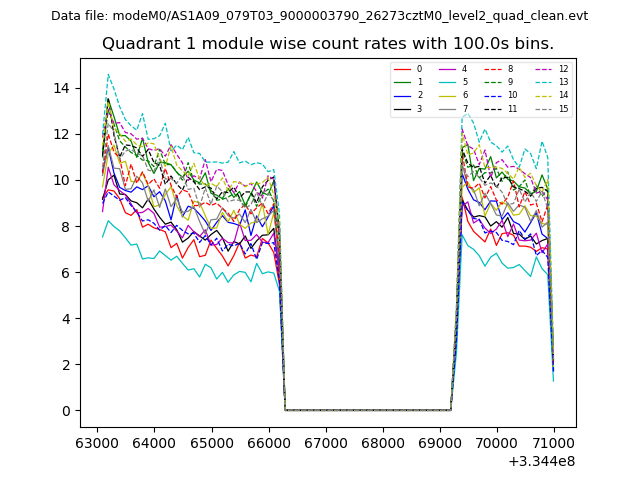
| Module-wise count rates for Quadrant A Data is divided into 100 sec bins |
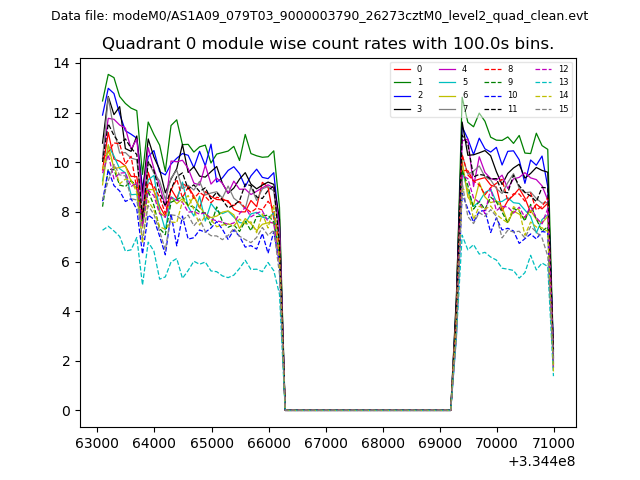 |
 |
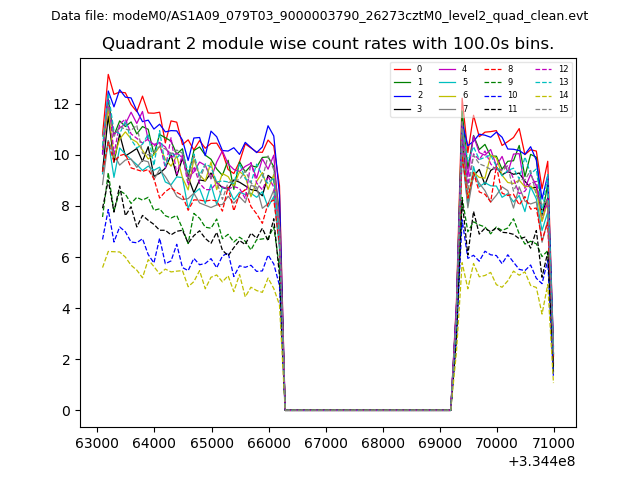
| Module-wise count rates for Quadrant B Data is divided into 100 sec bins |
 |
 |
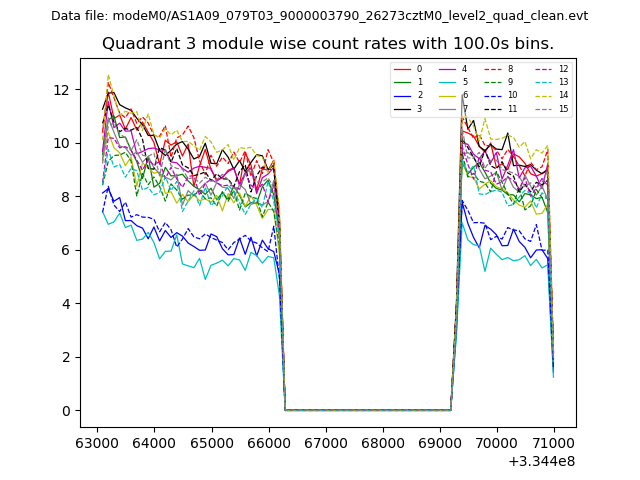
| Module-wise count rates for Quadrant C Data is divided into 100 sec bins |
 |
 |
| Module-wise count rates for Quadrant D Data is divided into 100 sec bins |
 |
 |
| Parameter | Plot |
|---|---|
| CZT HV Monitor | 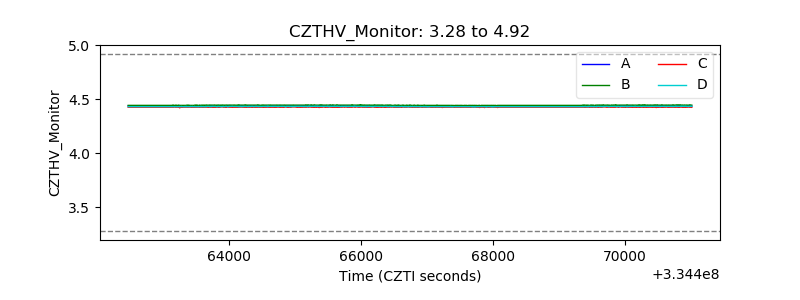 |
| D_VDD | 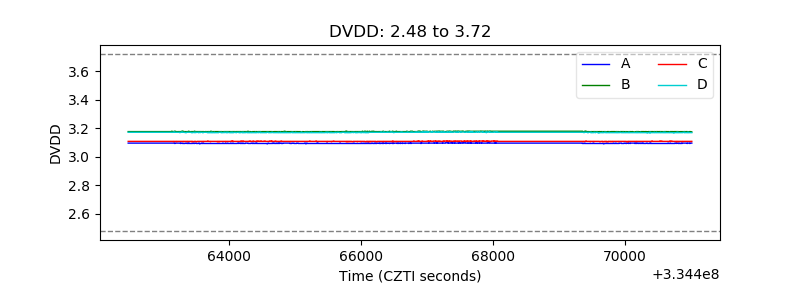 |
| Temperature 1 | 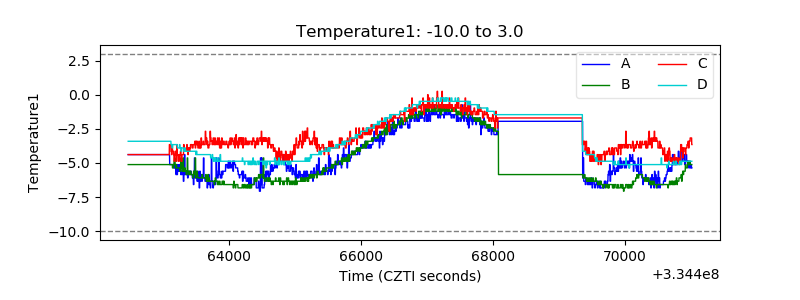 |
| Veto HV Monitor | 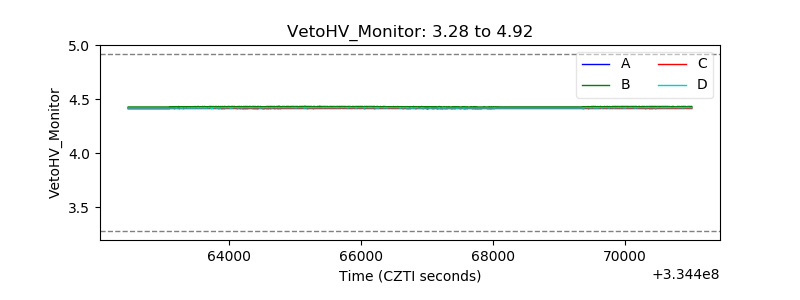 |
| Veto LLD | 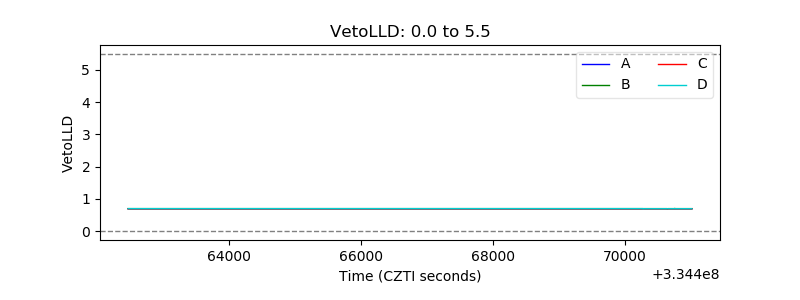 |
| Alpha Counter | 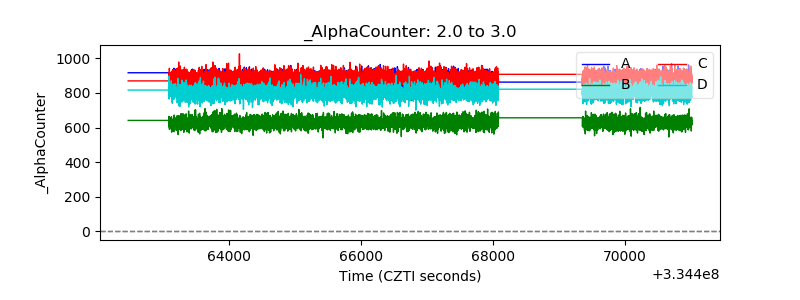 |
| _CPM_Rate | 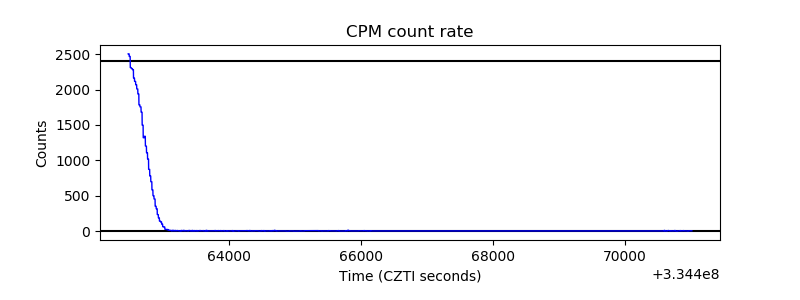 |
| CZT Counter |  |
| +2.5 Volts monitor |  |
| +5 Volts monitor |  |
| _ROLL_ROT | 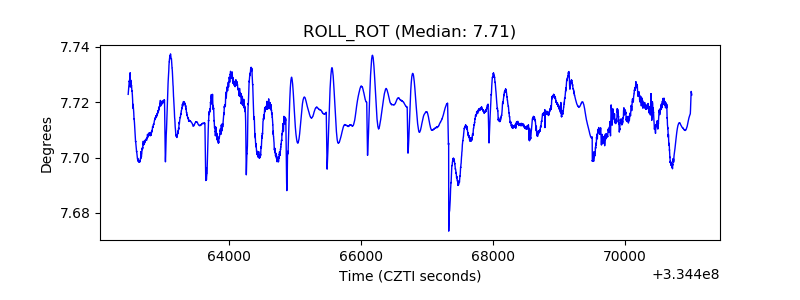 |
| _Roll_DEC | 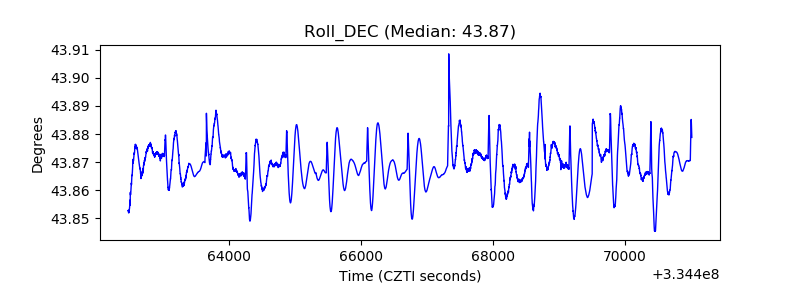 |
| _Roll_RA | 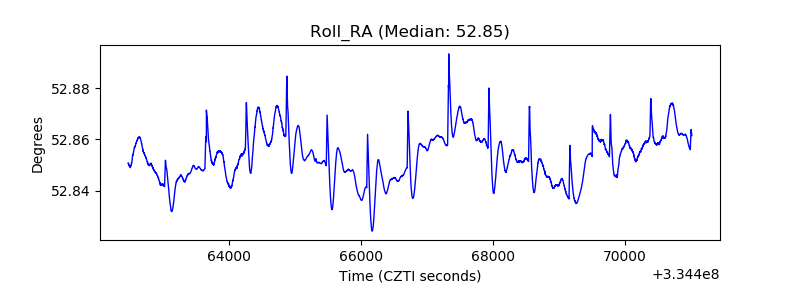 |
| Veto Counter | 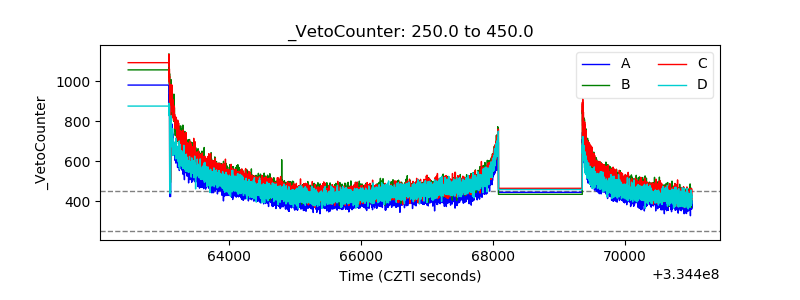 |