| Param | Original file | Final file |
|---|---|---|
| Filename | modeM0/AS1A09_079T03_9000003790_26274cztM0_level2.evt | modeM0/AS1A09_079T03_9000003790_26274cztM0_level2_quad_clean.evt |
| Size (bytes) | 457,577,280 | 98,956,800 |
| Size | 436.4 MB | 94.4 MB |
| Events in quadrant A | 3,413,878 | 628,244 |
| Events in quadrant B | 3,293,456 | 653,018 |
| Events in quadrant C | 3,595,281 | 624,533 |
| Events in quadrant D | 3,091,212 | 615,499 |
| Mode M0 | |||
|---|---|---|---|
| Quadrant | BADHDUFLAG | Total packets | Discarded packets |
| A | 0 | 14552 | 0 |
| B | 0 | 14095 | 0 |
| C | 0 | 14992 | 0 |
| D | 0 | 13990 | 0 |
| Mode M9 | |||
|---|---|---|---|
| Quadrant | BADHDUFLAG | Total packets | Discarded packets |
| A | 0 | 11 | 0 |
| B | 0 | 11 | 0 |
| C | 0 | 11 | 0 |
| D | 0 | 11 | 0 |
| Quadrant | Total seconds | Saturated seconds | Saturation percentage |
|---|---|---|---|
| A | 6826 | 52 | 0.761793% |
| B | 6827 | 43 | 0.629852% |
| C | 6827 | 145 | 2.123920% |
| D | 6827 | 10 | 0.146477% |
Noise dominated data is calculated using 1-second bins in cleaned event files. If a bin has >2000 counts, and if more than 50% of those come from <1% of pixels, then it is considered to be noise-dominated and hence unusable.
| Quadrant | # 1 sec bins | Bins with >0 counts | Bins with >2000 counts | High rate bins dominated by noise | Noise dominated (total time) | Noise dominated (detector-on time) | Marked lightcurve |
|---|---|---|---|---|---|---|---|
| A | 7831 | 6827 | 28 | 28 | 0.36% | 0.41% | 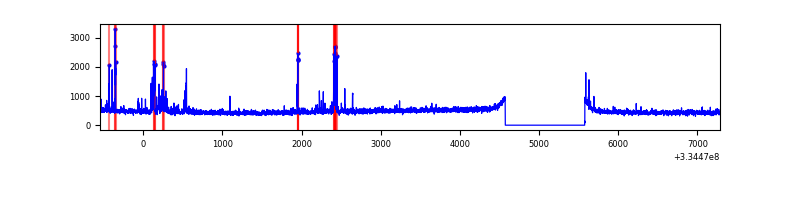 |
| B | 7832 | 6828 | 0 | 0 | 0.00% | 0.00% | 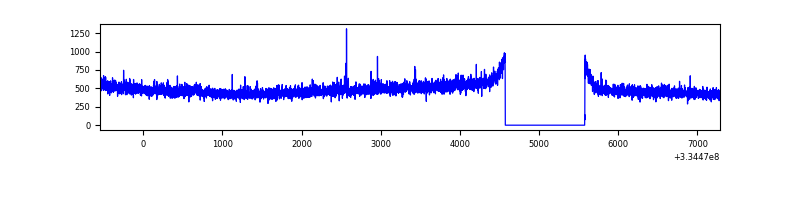 |
| C | 7832 | 6828 | 65 | 65 | 0.83% | 0.95% | 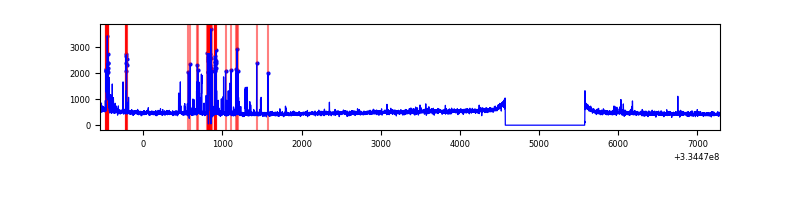 |
| D | 7832 | 6828 | 2 | 2 | 0.03% | 0.03% | 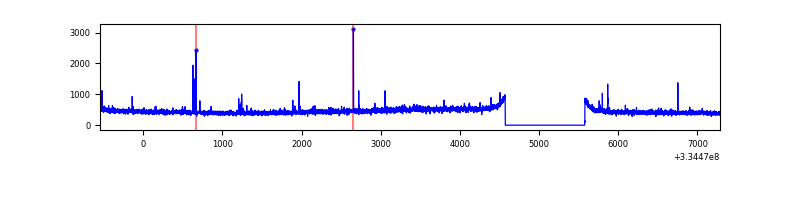 |
Top three noisy pixels from each quadrant. If the there are fewer than three noisy pixels in the level2.evt file, extra rows are filled as -1
| Pixel properties | Quadrant properties | ||||||
|---|---|---|---|---|---|---|---|
| Quadrant | DetID | PixID | Counts | Sigma | Mean | Median | Sigma |
| A | 0 | 13 | 210602 | 1261.07 | 830 | 815 | 166.4 |
| A | 13 | 254 | 11430 | 63.81 | 830 | 815 | 166.4 |
| A | 3 | 137 | 7482 | 40.08 | 830 | 815 | 166.4 |
| B | 12 | 111 | 18790 | 113.04 | 834 | 814 | 159.0 |
| B | 3 | 112 | 17113 | 102.49 | 834 | 814 | 159.0 |
| B | 11 | 111 | 16400 | 98.01 | 834 | 814 | 159.0 |
| C | 4 | 254 | 308421 | 1649.69 | 797 | 800 | 186.5 |
| C | 14 | 238 | 128079 | 682.56 | 797 | 800 | 186.5 |
| C | 3 | 233 | 44428 | 233.96 | 797 | 800 | 186.5 |
| D | 2 | 234 | 27608 | 139.42 | 804 | 785 | 192.4 |
| D | 1 | 52 | 23070 | 115.83 | 804 | 785 | 192.4 |
| D | 2 | 120 | 12470 | 60.73 | 804 | 785 | 192.4 |
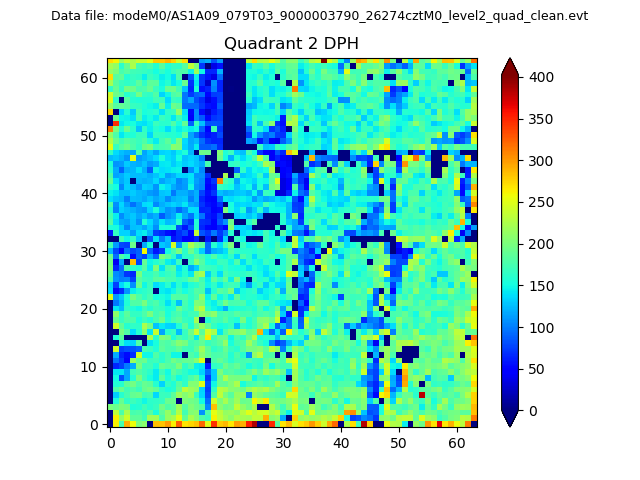
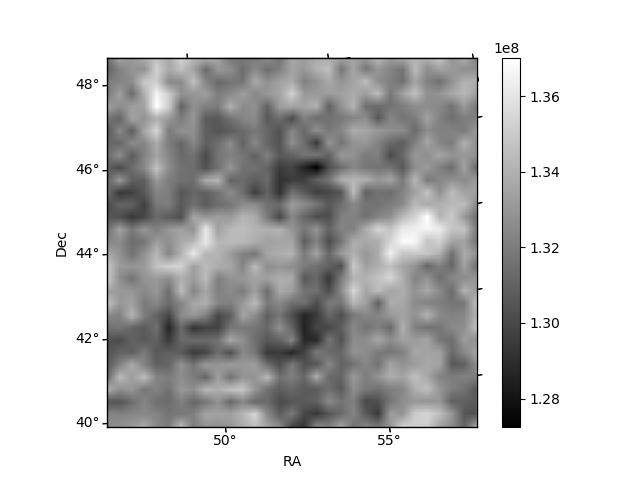
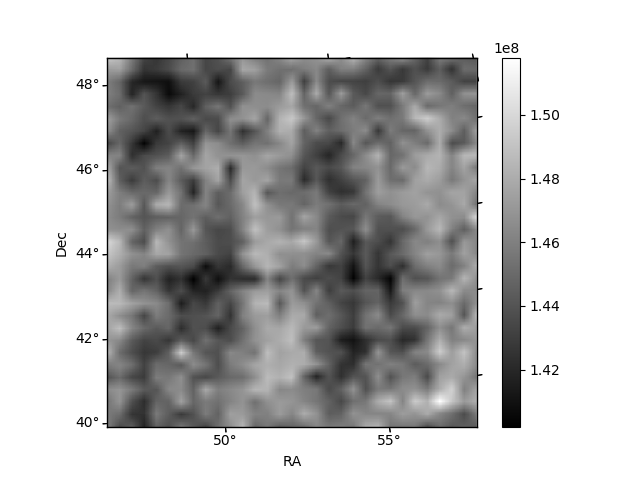
Histogram calculated using DETX and DETY for each event in the final _common_clean file
| Quadrant A | 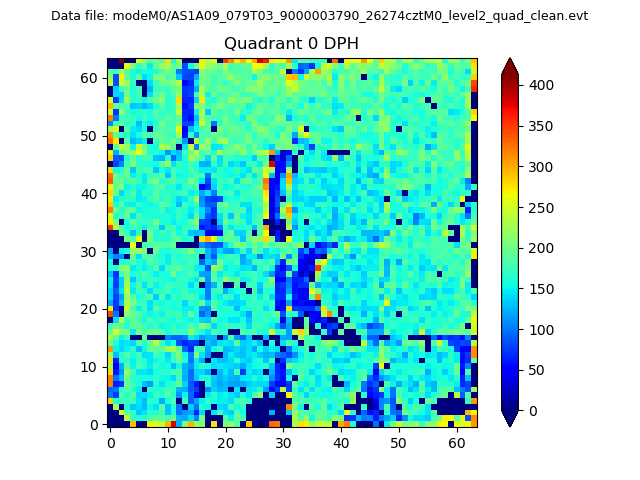 |
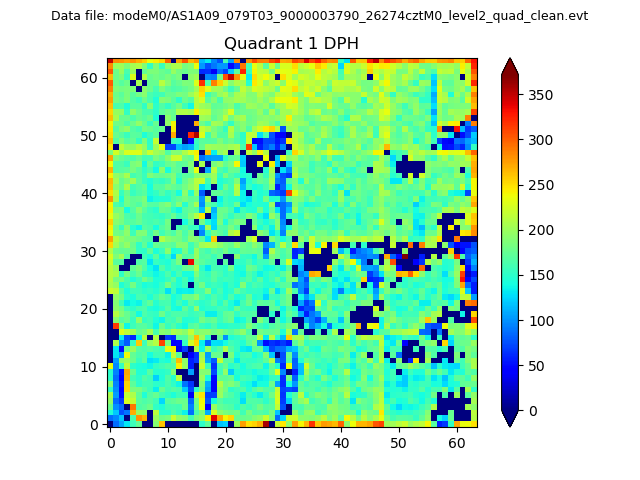 |
Quadrant B |
|---|---|---|---|
| Quadrant D | 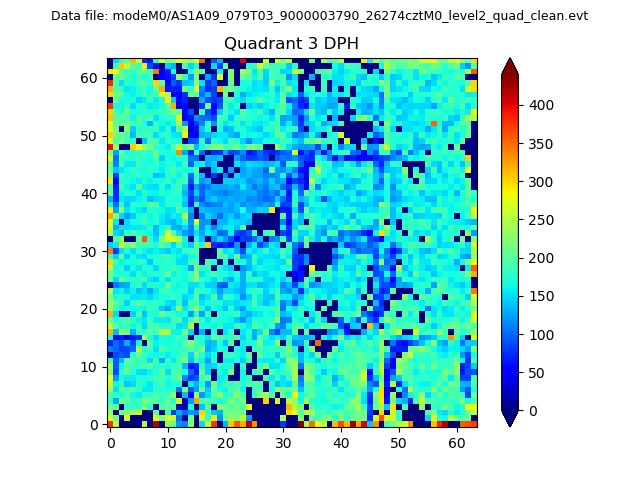 |
 |
Quadrant C |
| Plot type | Count rate plots | Images |
|---|---|---|
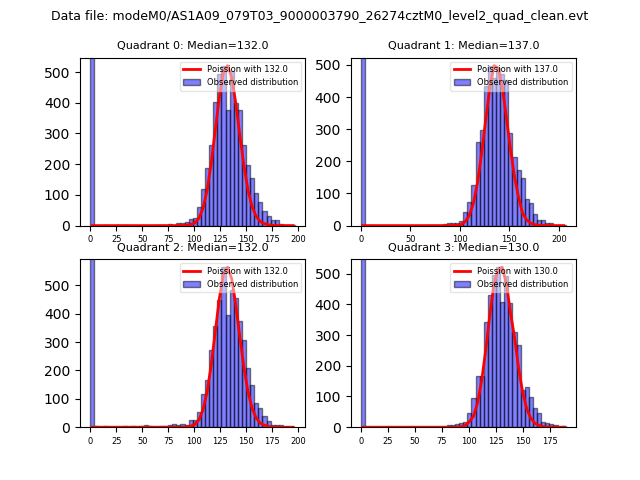
| Comparison with Poisson distribution Blue bars denote a histogram of data divided into 1 sec bins. Red curve is a Poisson curve with rate = median count rate of data. |
 |
 |
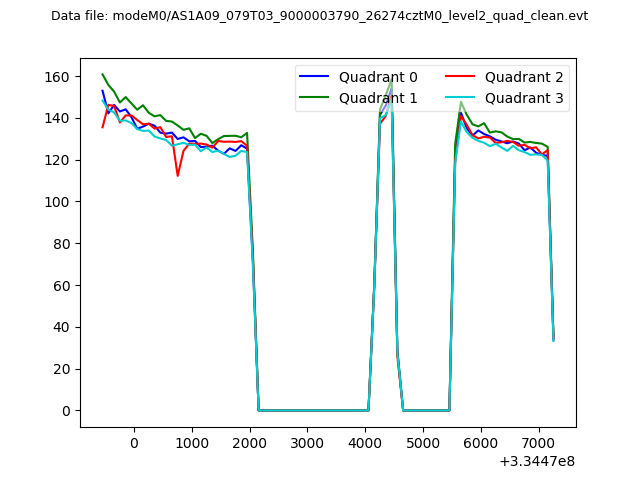
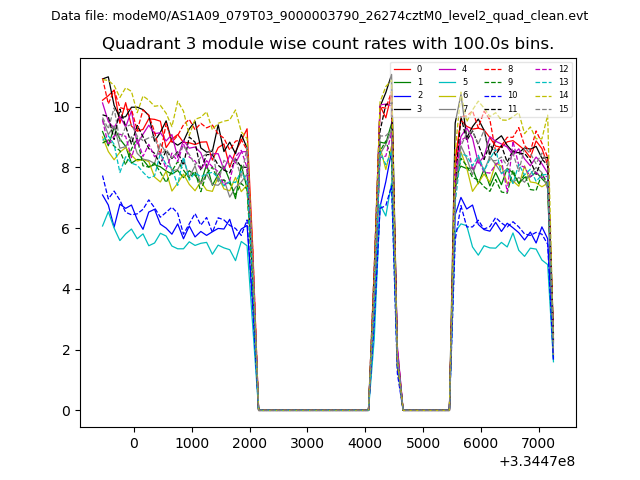
| Quadrant-wise count rates Data is divided into 100 sec bins |
 |
|
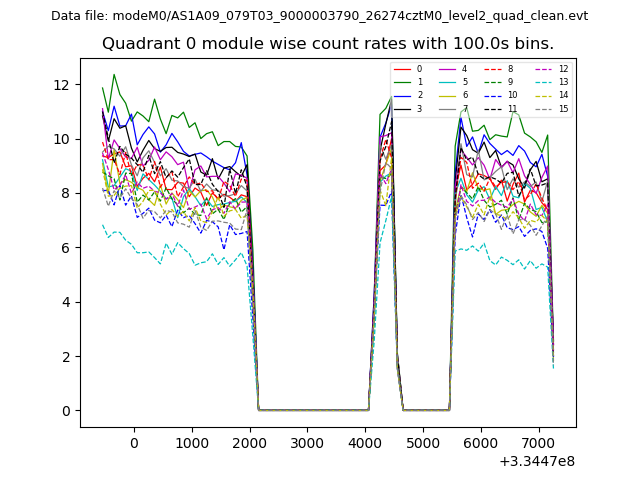
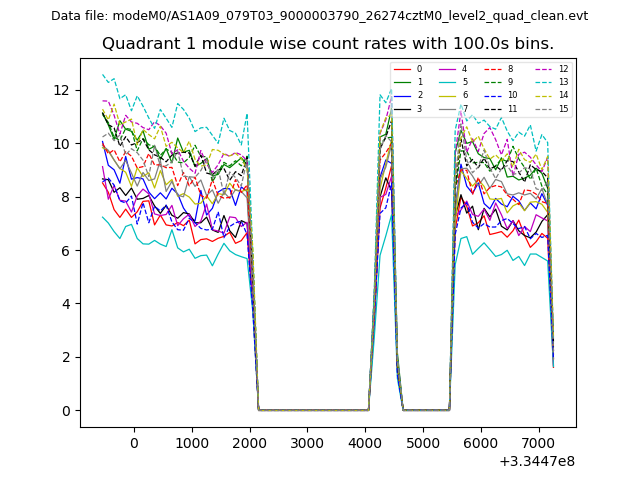
| Module-wise count rates for Quadrant A Data is divided into 100 sec bins |
 |
 |
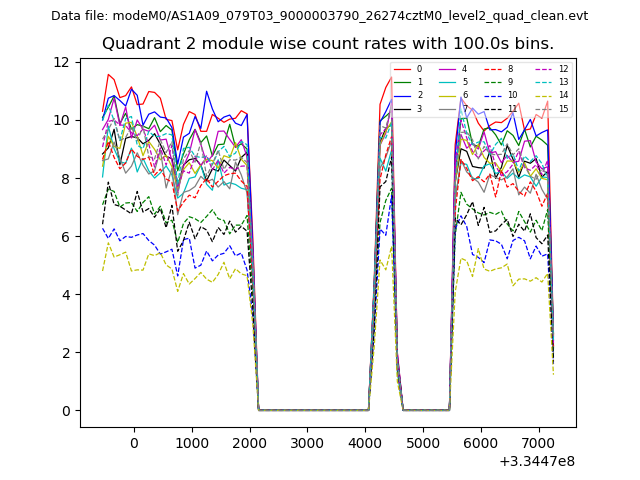
| Module-wise count rates for Quadrant B Data is divided into 100 sec bins |
 |
 |
| Module-wise count rates for Quadrant C Data is divided into 100 sec bins |
 |
 |
| Module-wise count rates for Quadrant D Data is divided into 100 sec bins |
 |
 |
| Parameter | Plot |
|---|---|
| CZT HV Monitor | 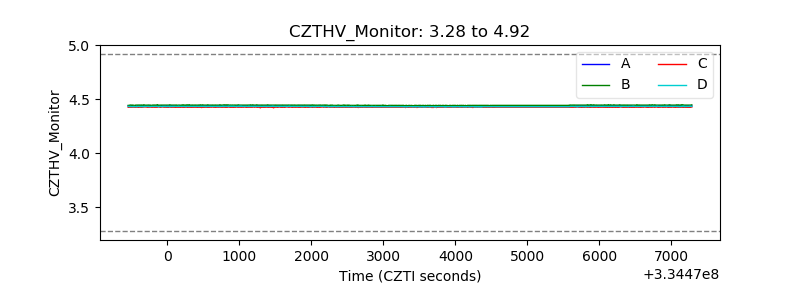 |
| D_VDD | 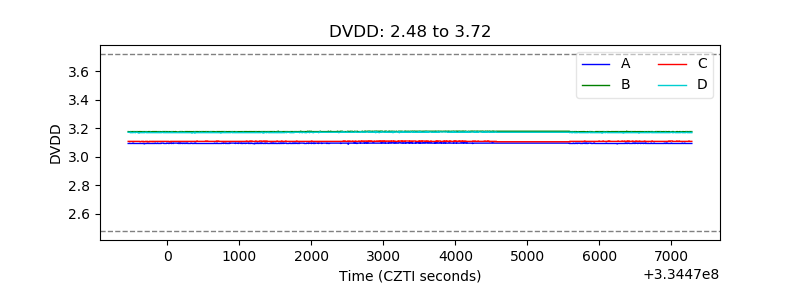 |
| Temperature 1 | 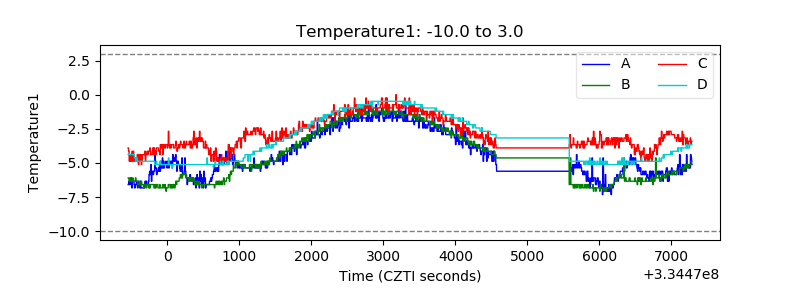 |
| Veto HV Monitor | 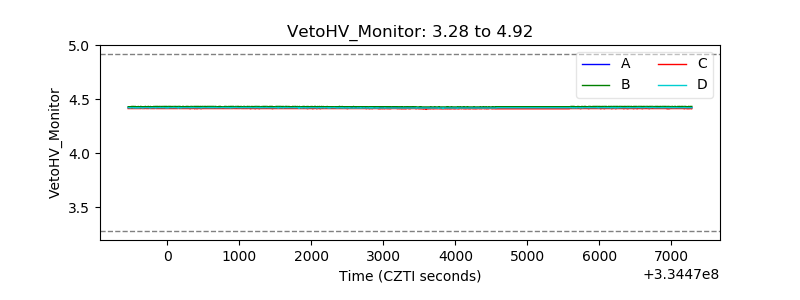 |
| Veto LLD | 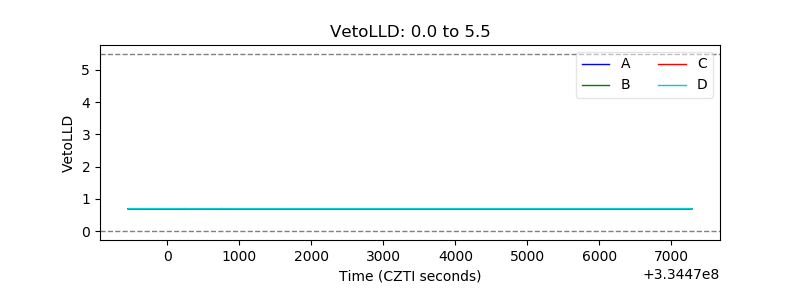 |
| Alpha Counter | 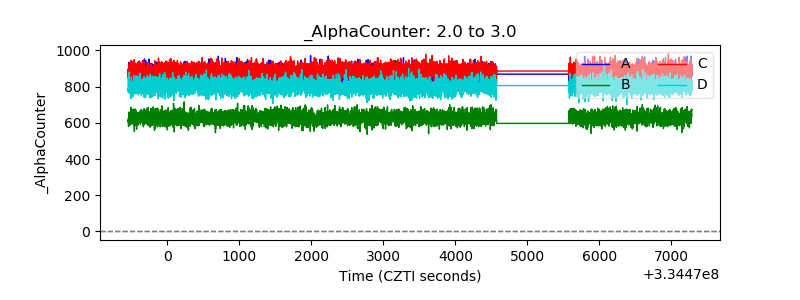 |
| _CPM_Rate | 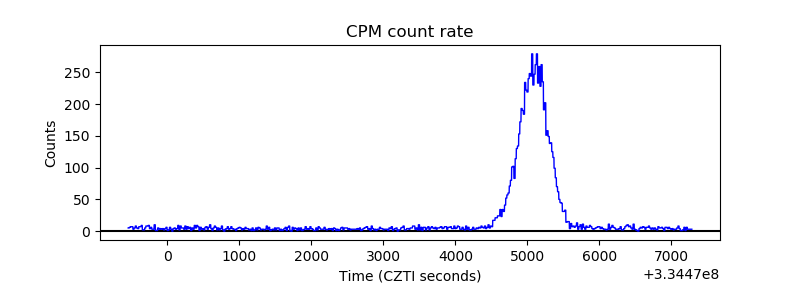 |
| CZT Counter | 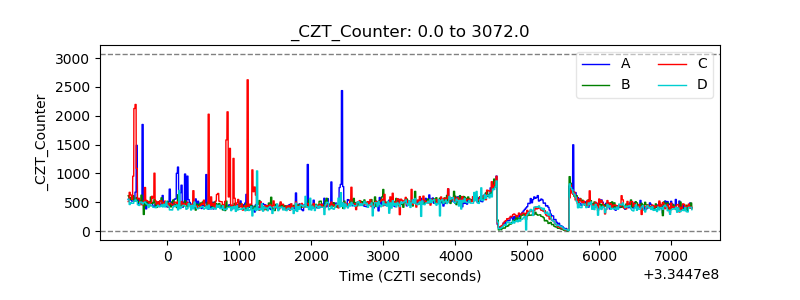 |
| +2.5 Volts monitor | 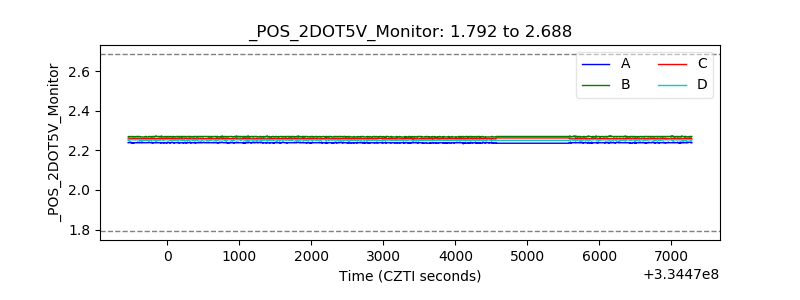 |
| +5 Volts monitor |  |
| _ROLL_ROT | 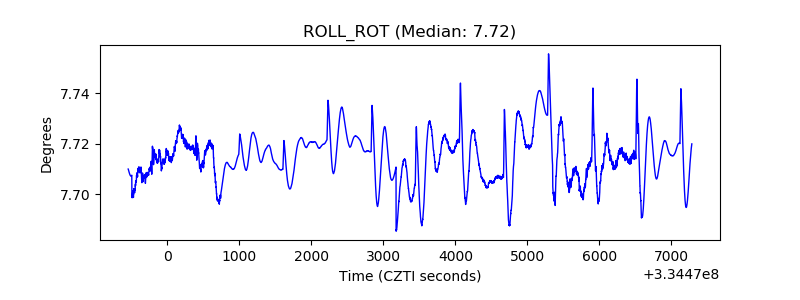 |
| _Roll_DEC | 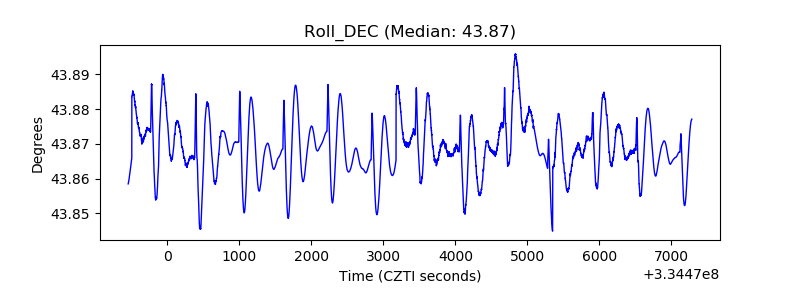 |
| _Roll_RA | 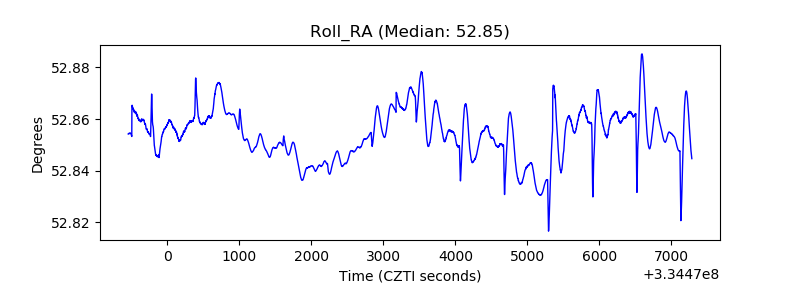 |
| Veto Counter | 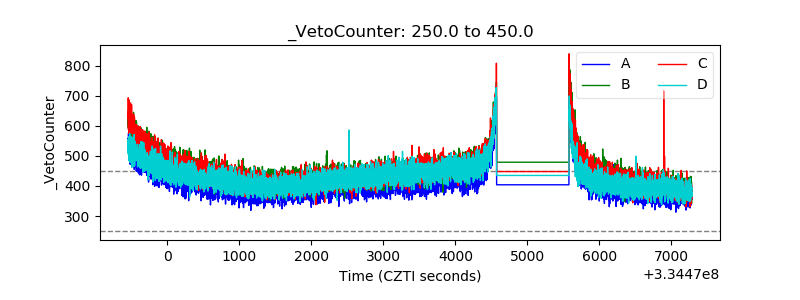 |