| Param | Original file | Final file |
|---|---|---|
| Filename | modeM0/AS1A09_079T03_9000003790_26275cztM0_level2.evt | modeM0/AS1A09_079T03_9000003790_26275cztM0_level2_quad_clean.evt |
| Size (bytes) | 425,160,000 | 89,300,160 |
| Size | 405.5 MB | 85.2 MB |
| Events in quadrant A | 3,089,848 | 559,118 |
| Events in quadrant B | 3,121,936 | 577,604 |
| Events in quadrant C | 3,279,247 | 563,208 |
| Events in quadrant D | 2,942,891 | 551,175 |
| Mode M0 | |||
|---|---|---|---|
| Quadrant | BADHDUFLAG | Total packets | Discarded packets |
| A | 0 | 13414 | 0 |
| B | 0 | 13397 | 0 |
| C | 0 | 13948 | 0 |
| D | 0 | 13322 | 0 |
| Mode M9 | |||
|---|---|---|---|
| Quadrant | BADHDUFLAG | Total packets | Discarded packets |
| A | 0 | 6 | 0 |
| B | 0 | 6 | 0 |
| C | 0 | 6 | 0 |
| D | 0 | 6 | 0 |
| Quadrant | Total seconds | Saturated seconds | Saturation percentage |
|---|---|---|---|
| A | 6496 | 74 | 1.139163% |
| B | 6497 | 82 | 1.262121% |
| C | 6497 | 120 | 1.847006% |
| D | 6497 | 44 | 0.677236% |
Noise dominated data is calculated using 1-second bins in cleaned event files. If a bin has >2000 counts, and if more than 50% of those come from <1% of pixels, then it is considered to be noise-dominated and hence unusable.
| Quadrant | # 1 sec bins | Bins with >0 counts | Bins with >2000 counts | High rate bins dominated by noise | Noise dominated (total time) | Noise dominated (detector-on time) | Marked lightcurve |
|---|---|---|---|---|---|---|---|
| A | 7086 | 6497 | 3 | 3 | 0.04% | 0.05% | 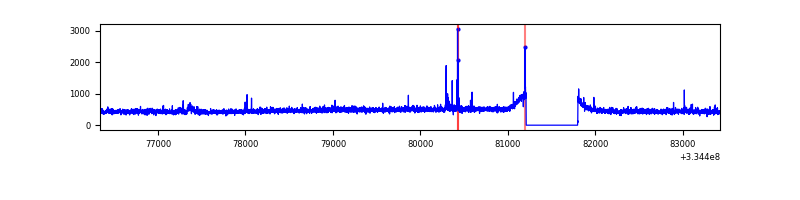 |
| B | 7087 | 6498 | 0 | 0 | 0.00% | 0.00% | 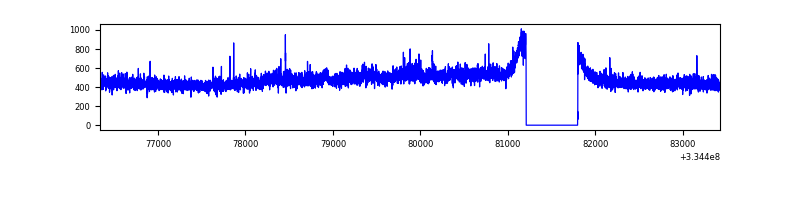 |
| C | 7087 | 6498 | 3 | 3 | 0.04% | 0.05% | 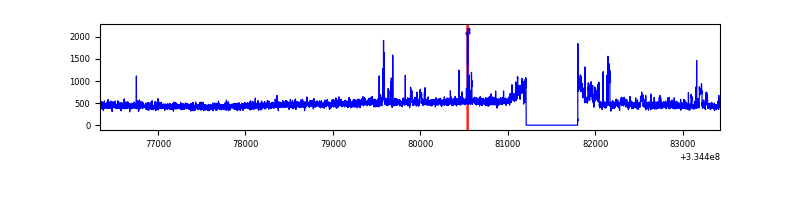 |
| D | 7087 | 6498 | 0 | 0 | 0.00% | 0.00% | 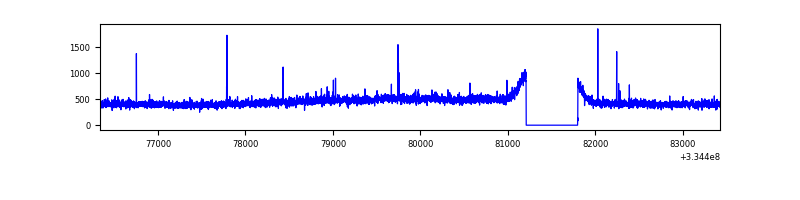 |
Top three noisy pixels from each quadrant. If the there are fewer than three noisy pixels in the level2.evt file, extra rows are filled as -1
| Pixel properties | Quadrant properties | ||||||
|---|---|---|---|---|---|---|---|
| Quadrant | DetID | PixID | Counts | Sigma | Mean | Median | Sigma |
| A | 0 | 13 | 67089 | 418.86 | 783 | 764 | 158.3 |
| A | 13 | 254 | 11165 | 65.68 | 783 | 764 | 158.3 |
| A | 3 | 137 | 7338 | 41.52 | 783 | 764 | 158.3 |
| B | 3 | 112 | 42846 | 281.18 | 782 | 764 | 149.7 |
| B | 12 | 111 | 18290 | 117.1 | 782 | 764 | 149.7 |
| B | 11 | 111 | 15957 | 101.52 | 782 | 764 | 149.7 |
| C | 3 | 233 | 147447 | 828.98 | 752 | 758 | 177.0 |
| C | 14 | 238 | 120669 | 677.65 | 752 | 758 | 177.0 |
| C | 2 | 16 | 78717 | 440.57 | 752 | 758 | 177.0 |
| D | 1 | 52 | 34047 | 182.69 | 761 | 742 | 182.3 |
| D | 2 | 234 | 27439 | 146.45 | 761 | 742 | 182.3 |
| D | 12 | 233 | 11592 | 59.52 | 761 | 742 | 182.3 |
Histogram calculated using DETX and DETY for each event in the final _common_clean file
| Quadrant A | 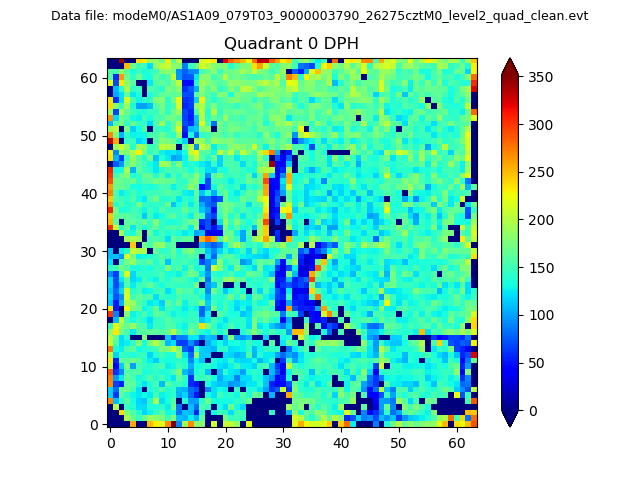 |
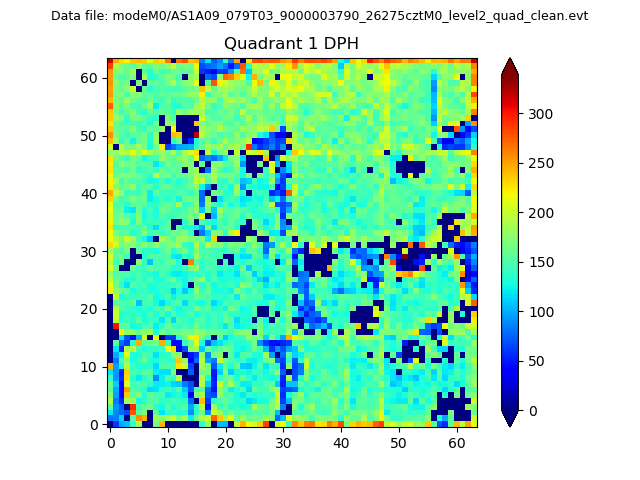 |
Quadrant B |
|---|---|---|---|
| Quadrant D | 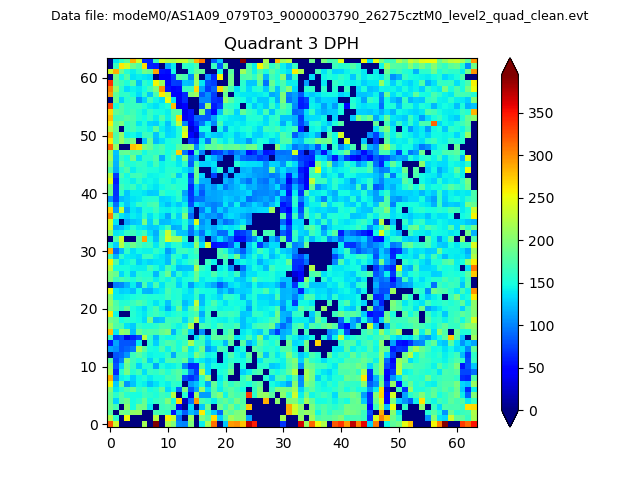 |
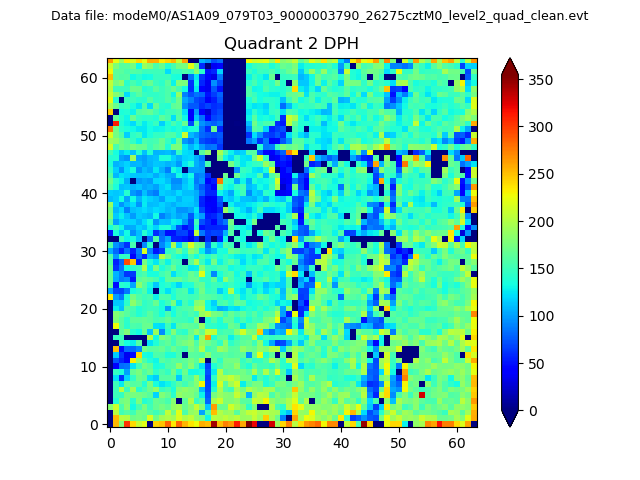 |
Quadrant C |
| Plot type | Count rate plots | Images |
|---|---|---|
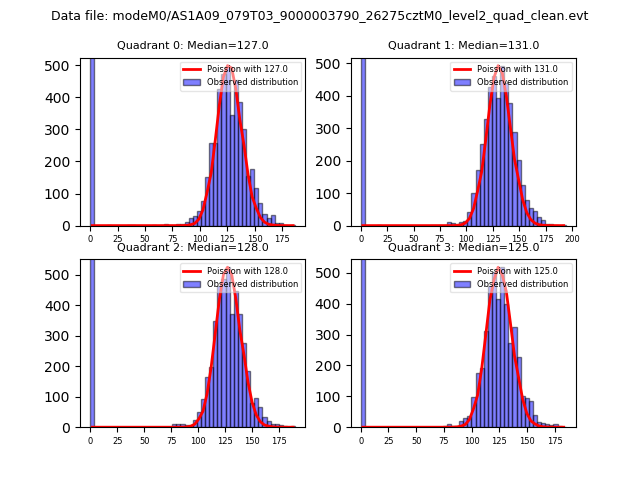
| Comparison with Poisson distribution Blue bars denote a histogram of data divided into 1 sec bins. Red curve is a Poisson curve with rate = median count rate of data. |
 |
 |
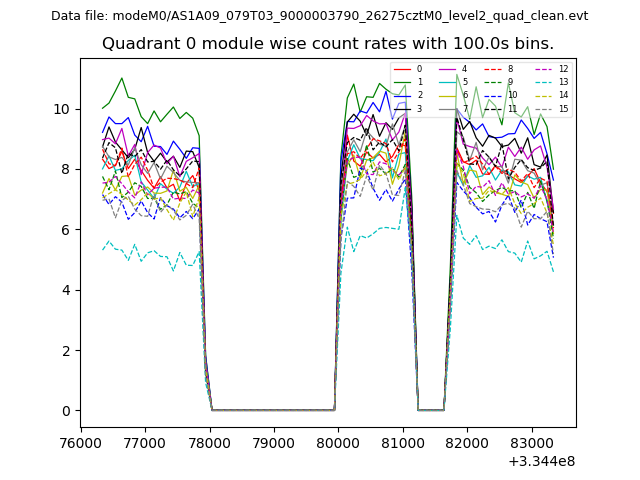
| Quadrant-wise count rates Data is divided into 100 sec bins |
 |
|
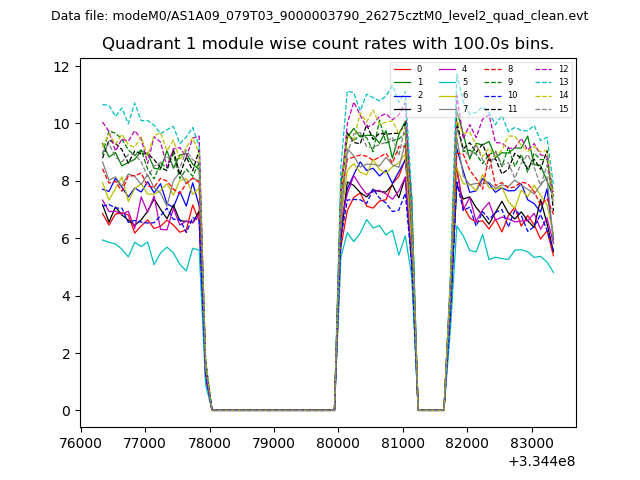
| Module-wise count rates for Quadrant A Data is divided into 100 sec bins |
 |
 |
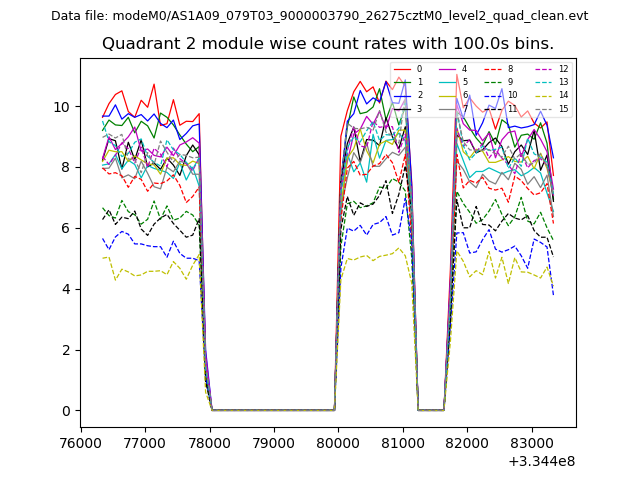
| Module-wise count rates for Quadrant B Data is divided into 100 sec bins |
 |
 |
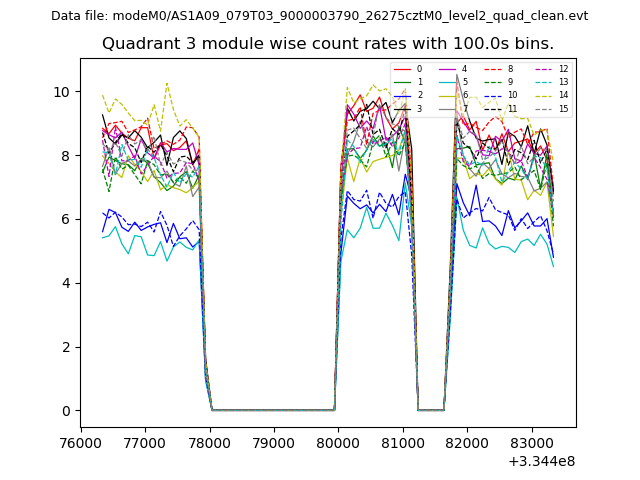
| Module-wise count rates for Quadrant C Data is divided into 100 sec bins |
 |
 |
| Module-wise count rates for Quadrant D Data is divided into 100 sec bins |
 |
 |
| Parameter | Plot |
|---|---|
| CZT HV Monitor | 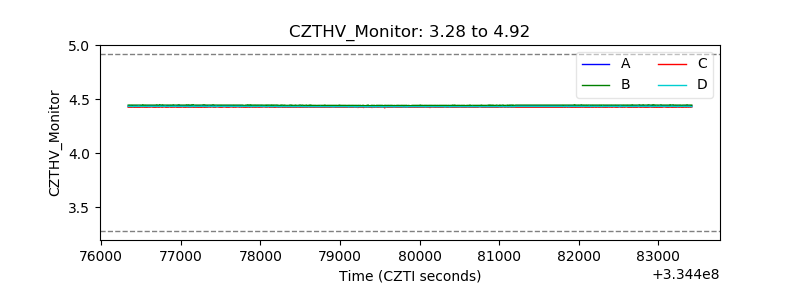 |
| D_VDD | 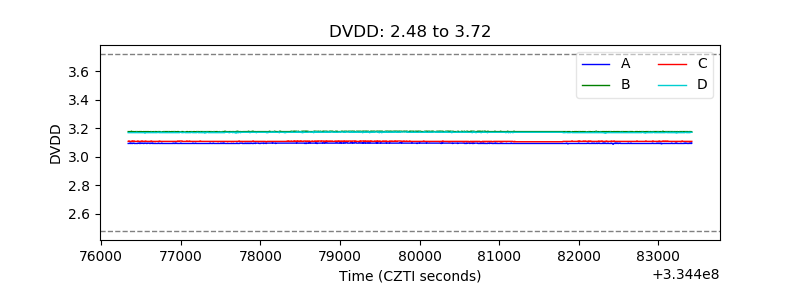 |
| Temperature 1 | 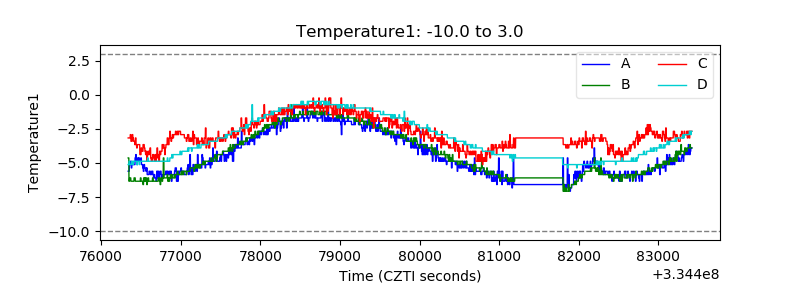 |
| Veto HV Monitor |  |
| Veto LLD | 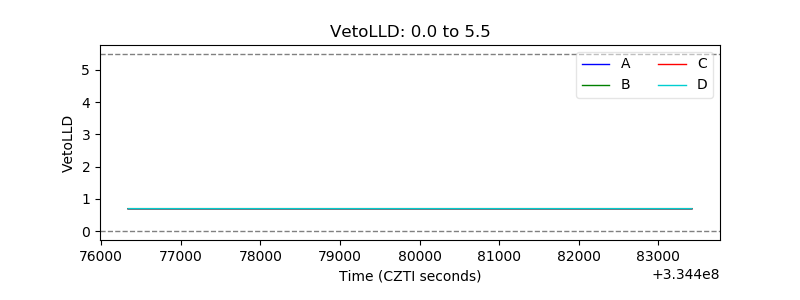 |
| Alpha Counter |  |
| _CPM_Rate | 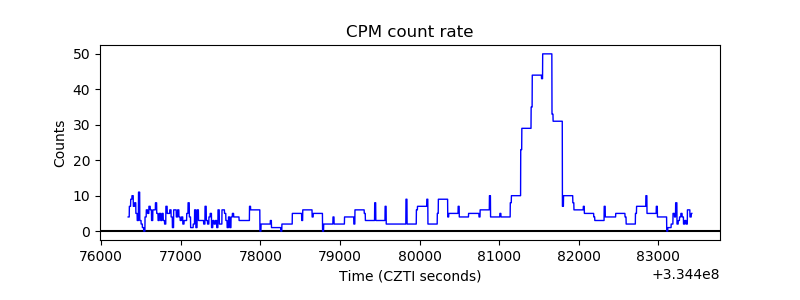 |
| CZT Counter | 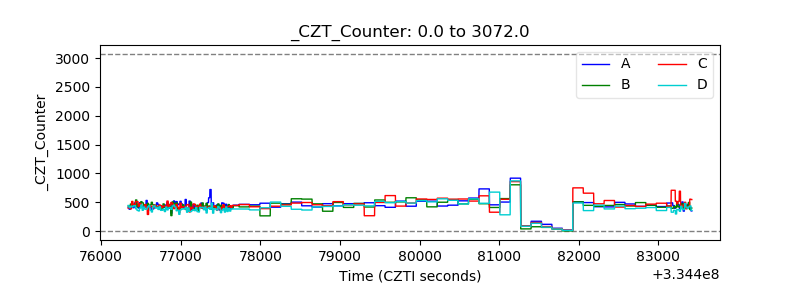 |
| +2.5 Volts monitor |  |
| +5 Volts monitor |  |
| _ROLL_ROT | 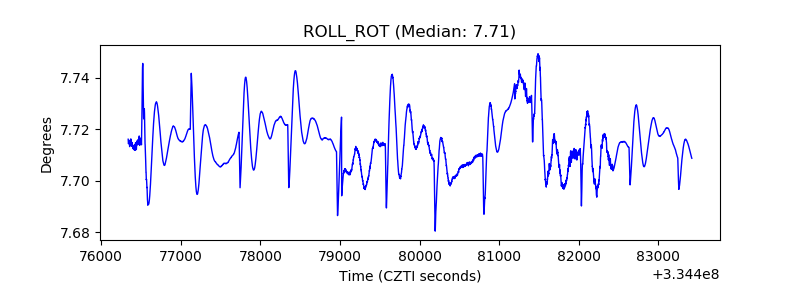 |
| _Roll_DEC |  |
| _Roll_RA | 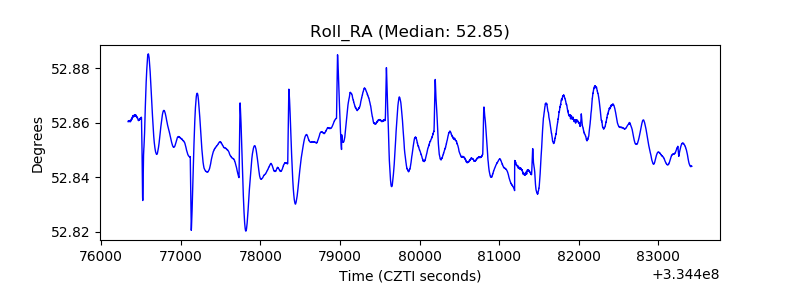 |
| Veto Counter | 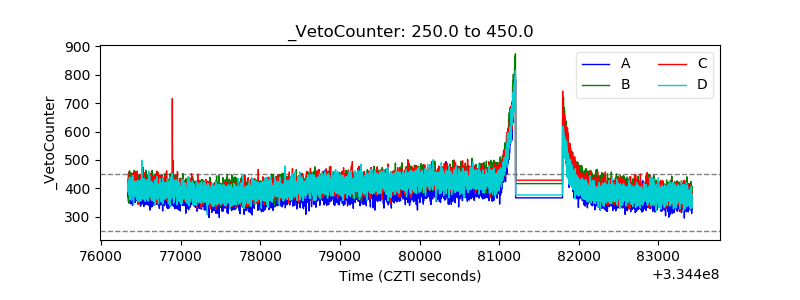 |