| Param | Original file | Final file |
|---|---|---|
| Filename | modeM0/AS1A09_079T03_9000003790_26276cztM0_level2.evt | modeM0/AS1A09_079T03_9000003790_26276cztM0_level2_quad_clean.evt |
| Size (bytes) | 490,763,520 | 98,720,640 |
| Size | 468.0 MB | 94.1 MB |
| Events in quadrant A | 3,412,036 | 620,865 |
| Events in quadrant B | 3,399,242 | 644,189 |
| Events in quadrant C | 3,821,154 | 623,897 |
| Events in quadrant D | 3,749,243 | 607,674 |
| Mode M0 | |||
|---|---|---|---|
| Quadrant | BADHDUFLAG | Total packets | Discarded packets |
| A | 0 | 14835 | 0 |
| B | 0 | 14685 | 0 |
| C | 0 | 15923 | 0 |
| D | 0 | 15973 | 0 |
| Mode M9 | |||
|---|---|---|---|
| Quadrant | BADHDUFLAG | Total packets | Discarded packets |
| A | 0 | 1 | 0 |
| B | 0 | 1 | 0 |
| C | 0 | 1 | 0 |
| D | 0 | 1 | 0 |
| Quadrant | Total seconds | Saturated seconds | Saturation percentage |
|---|---|---|---|
| A | 7072 | 267 | 3.775452% |
| B | 7072 | 260 | 3.676471% |
| C | 7072 | 378 | 5.345023% |
| D | 7073 | 303 | 4.283897% |
Noise dominated data is calculated using 1-second bins in cleaned event files. If a bin has >2000 counts, and if more than 50% of those come from <1% of pixels, then it is considered to be noise-dominated and hence unusable.
| Quadrant | # 1 sec bins | Bins with >0 counts | Bins with >2000 counts | High rate bins dominated by noise | Noise dominated (total time) | Noise dominated (detector-on time) | Marked lightcurve |
|---|---|---|---|---|---|---|---|
| A | 7202 | 7074 | 7 | 7 | 0.10% | 0.10% | 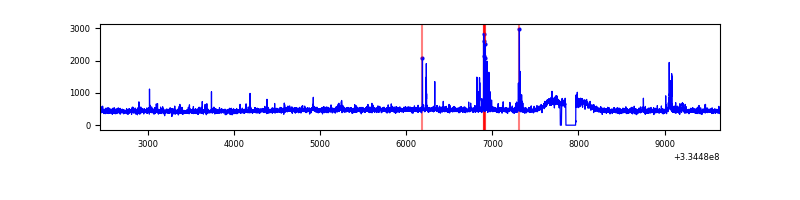 |
| B | 7202 | 7074 | 1 | 1 | 0.01% | 0.01% | 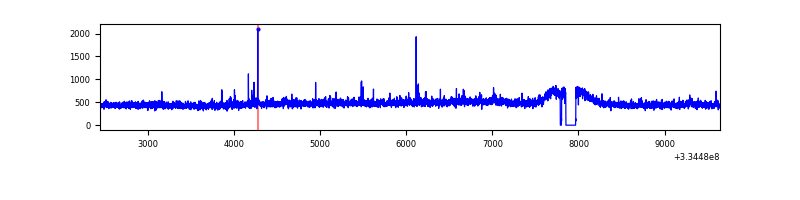 |
| C | 7202 | 7074 | 55 | 55 | 0.76% | 0.78% | 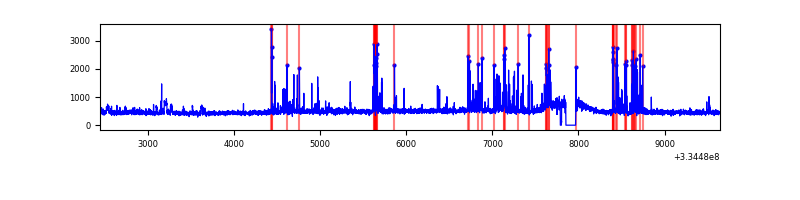 |
| D | 7203 | 7075 | 125 | 125 | 1.74% | 1.77% | 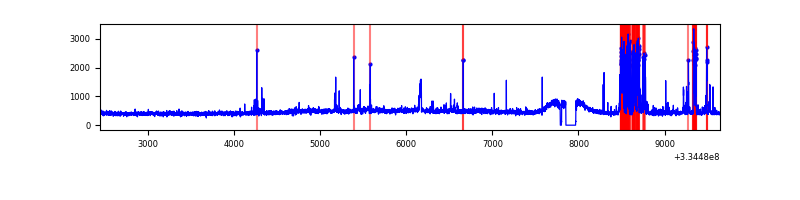 |
Top three noisy pixels from each quadrant. If the there are fewer than three noisy pixels in the level2.evt file, extra rows are filled as -1
| Pixel properties | Quadrant properties | ||||||
|---|---|---|---|---|---|---|---|
| Quadrant | DetID | PixID | Counts | Sigma | Mean | Median | Sigma |
| A | 0 | 13 | 109682 | 624.07 | 855 | 834 | 174.4 |
| A | 13 | 254 | 11351 | 60.3 | 855 | 834 | 174.4 |
| A | 3 | 137 | 8101 | 41.66 | 855 | 834 | 174.4 |
| B | 12 | 111 | 20282 | 117.75 | 855 | 834 | 165.2 |
| B | 11 | 111 | 17938 | 103.56 | 855 | 834 | 165.2 |
| B | 5 | 172 | 16842 | 96.92 | 855 | 834 | 165.2 |
| C | 4 | 254 | 413420 | 2155.95 | 817 | 820 | 191.4 |
| C | 14 | 238 | 130507 | 677.65 | 817 | 820 | 191.4 |
| C | 2 | 16 | 49008 | 251.8 | 817 | 820 | 191.4 |
| D | 12 | 33 | 422309 | 2121.49 | 830 | 807 | 198.7 |
| D | 1 | 52 | 137707 | 689.04 | 830 | 807 | 198.7 |
| D | 2 | 234 | 29429 | 144.06 | 830 | 807 | 198.7 |
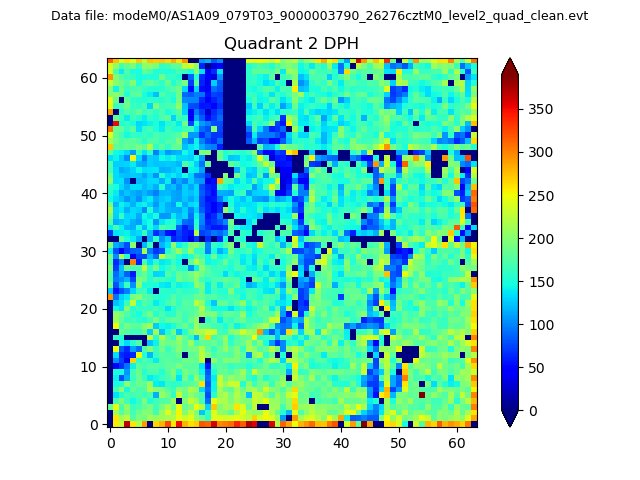
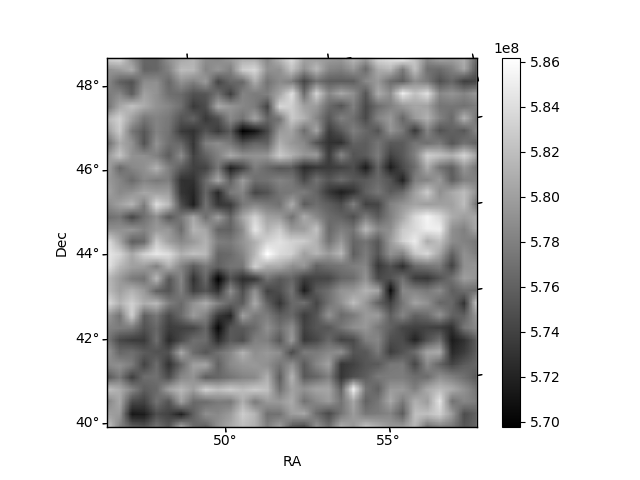
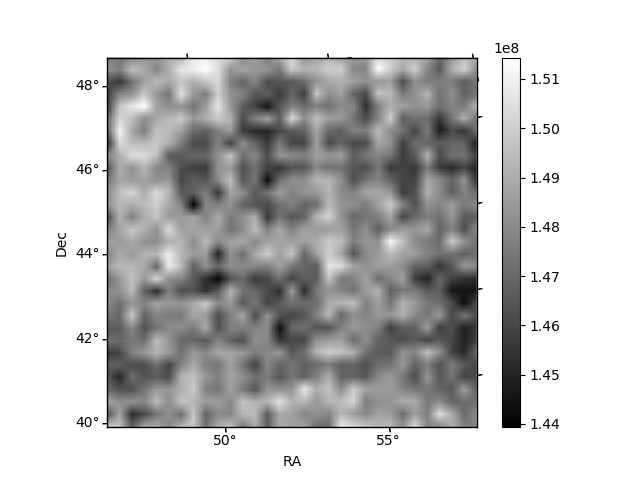
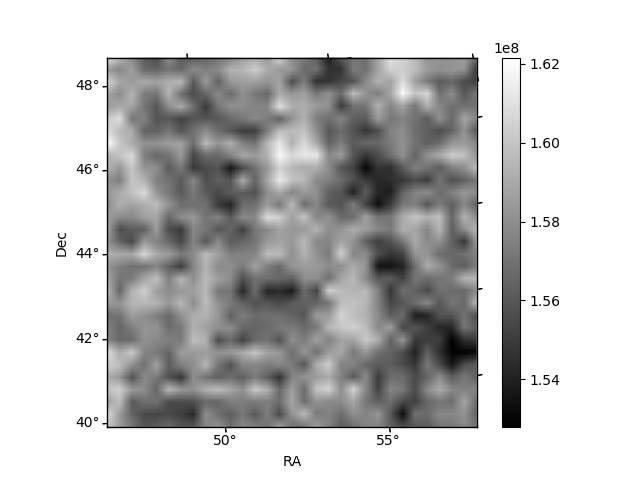
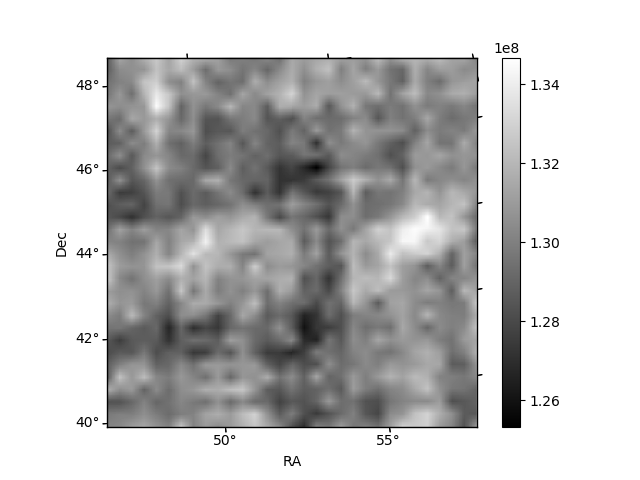
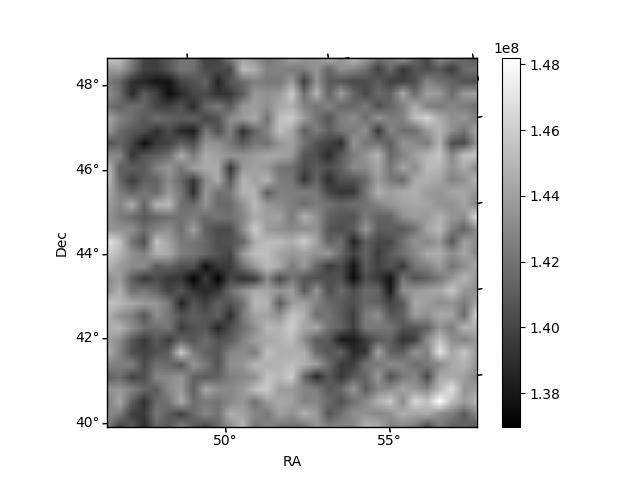
Histogram calculated using DETX and DETY for each event in the final _common_clean file
| Quadrant A | 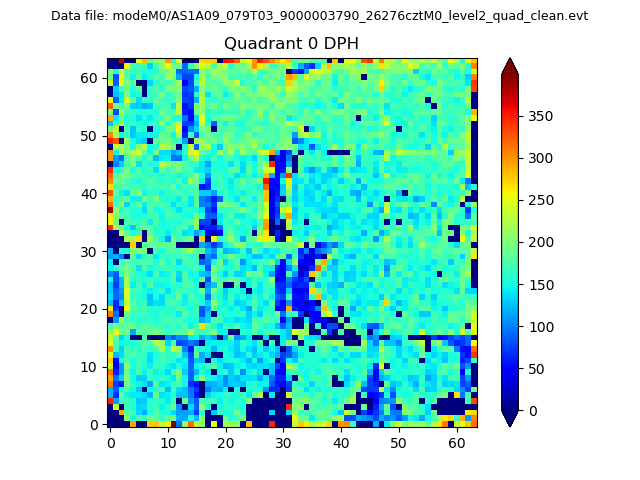 |
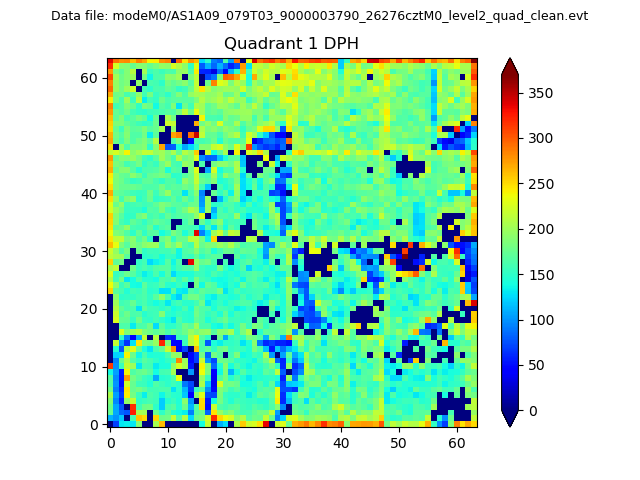 |
Quadrant B |
|---|---|---|---|
| Quadrant D | 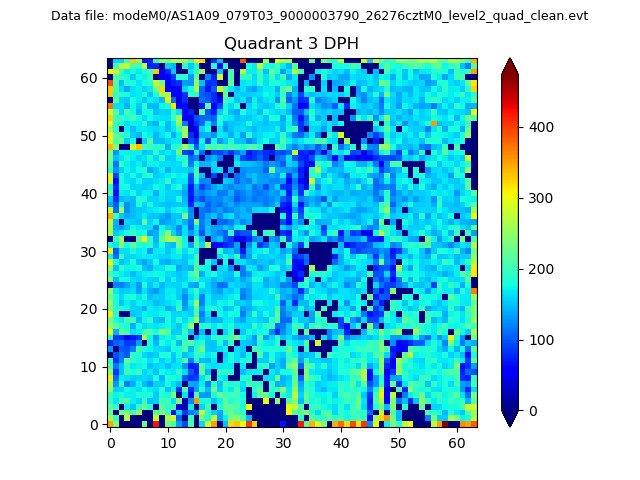 |
 |
Quadrant C |
| Plot type | Count rate plots | Images |
|---|---|---|
| Comparison with Poisson distribution Blue bars denote a histogram of data divided into 1 sec bins. Red curve is a Poisson curve with rate = median count rate of data. |
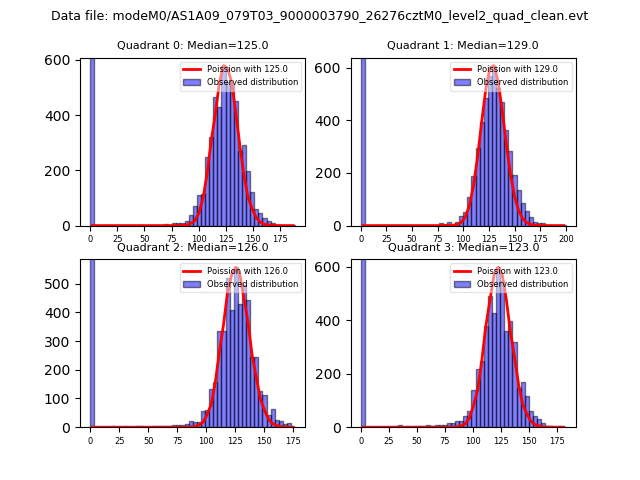 |
 |
| Quadrant-wise count rates Data is divided into 100 sec bins |
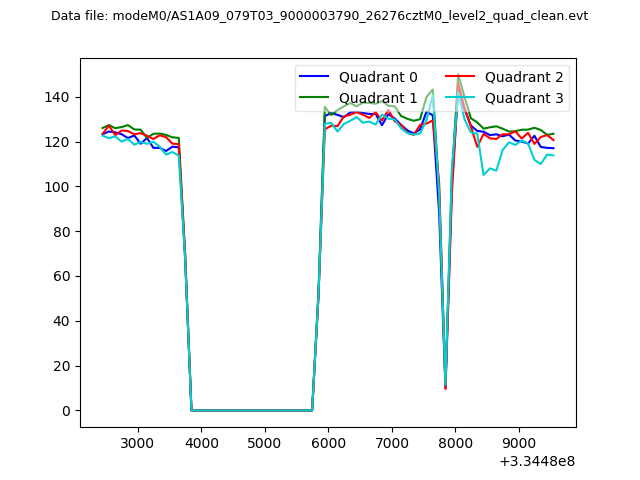 |
|
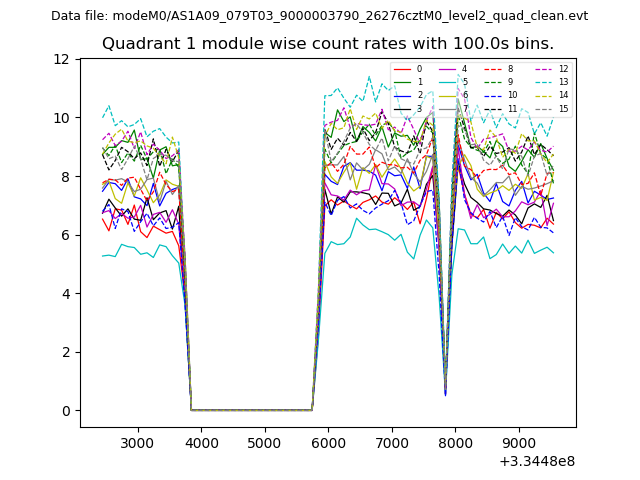
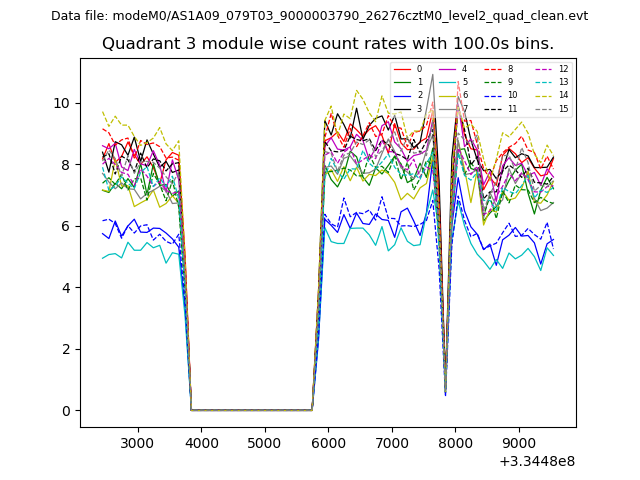
| Module-wise count rates for Quadrant A Data is divided into 100 sec bins |
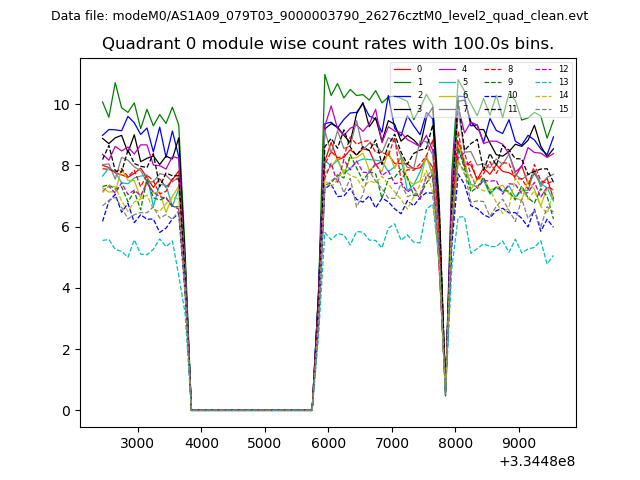 |
 |
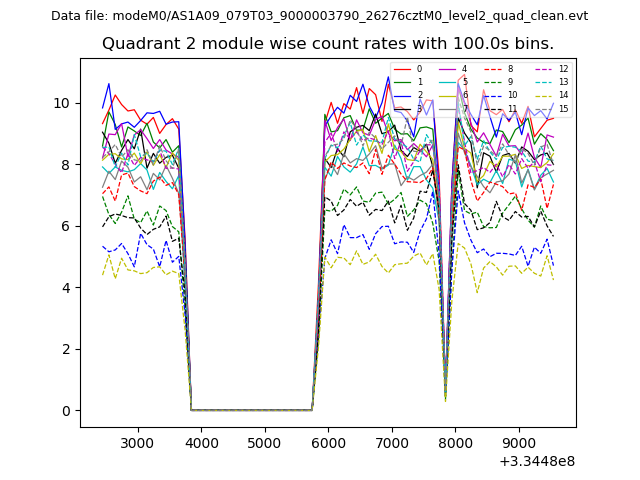
| Module-wise count rates for Quadrant B Data is divided into 100 sec bins |
 |
 |
| Module-wise count rates for Quadrant C Data is divided into 100 sec bins |
 |
 |
| Module-wise count rates for Quadrant D Data is divided into 100 sec bins |
 |
 |
| Parameter | Plot |
|---|---|
| CZT HV Monitor |  |
| D_VDD | 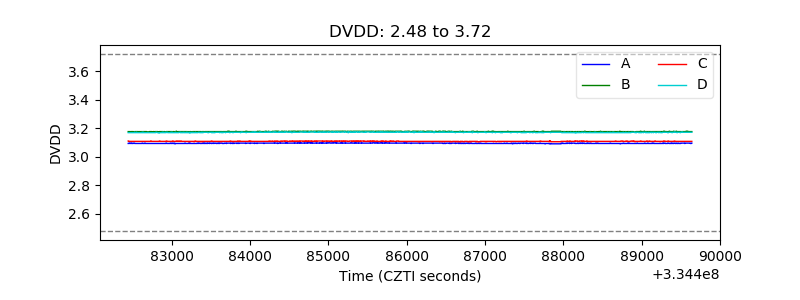 |
| Temperature 1 | 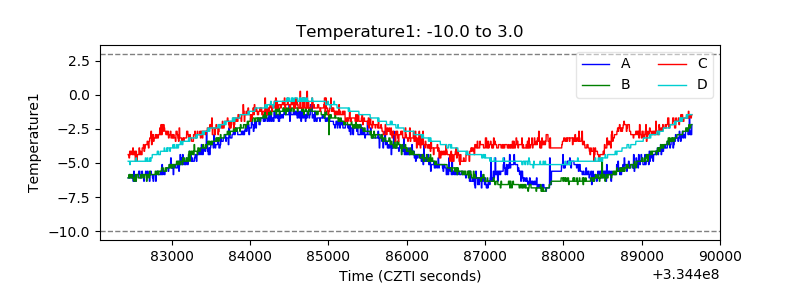 |
| Veto HV Monitor | 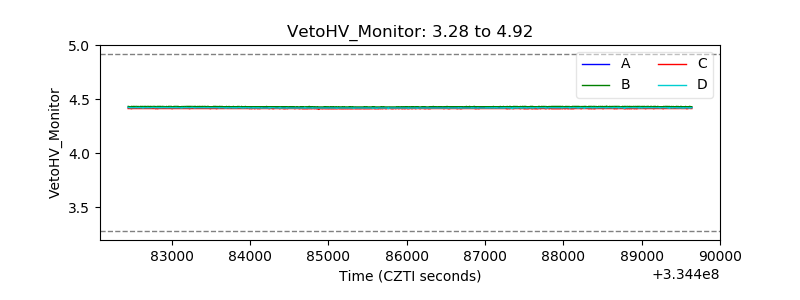 |
| Veto LLD | 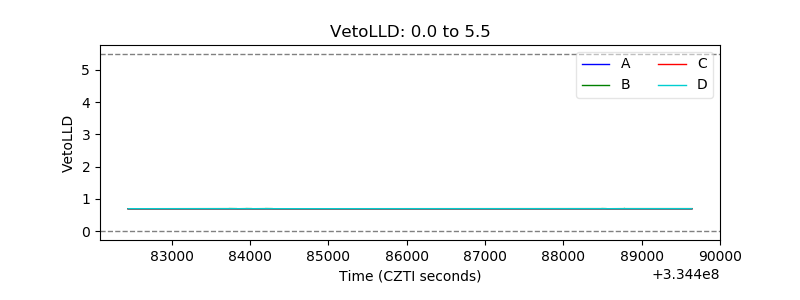 |
| Alpha Counter | 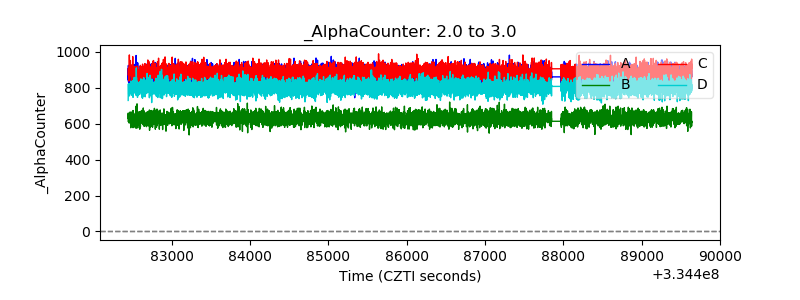 |
| _CPM_Rate | 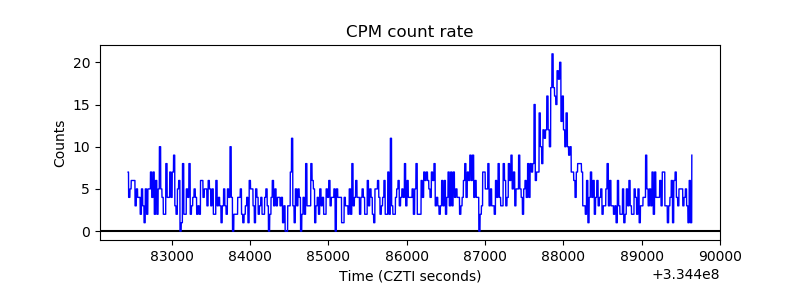 |
| CZT Counter | 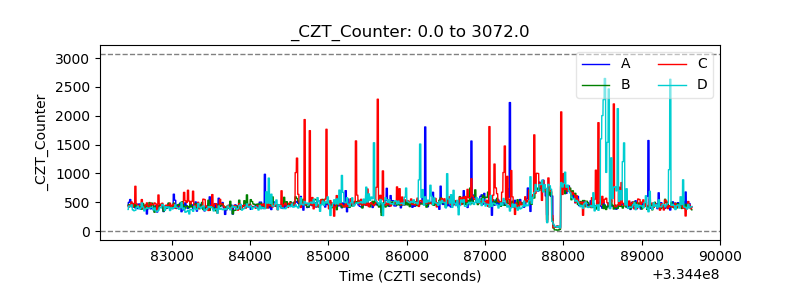 |
| +2.5 Volts monitor | 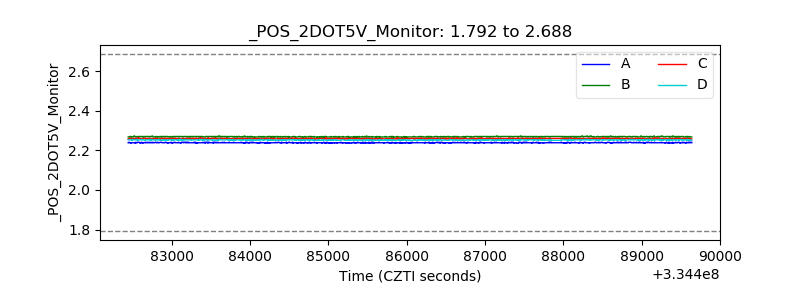 |
| +5 Volts monitor | 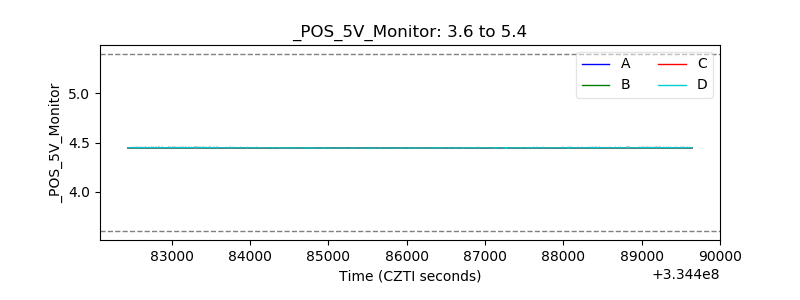 |
| _ROLL_ROT | 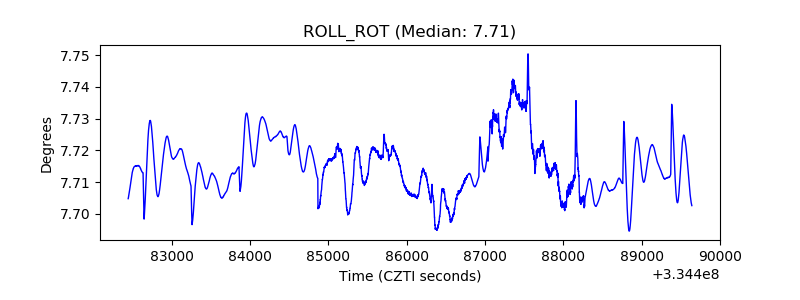 |
| _Roll_DEC | 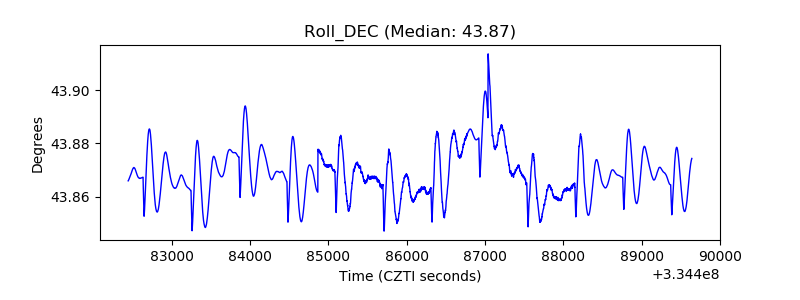 |
| _Roll_RA | 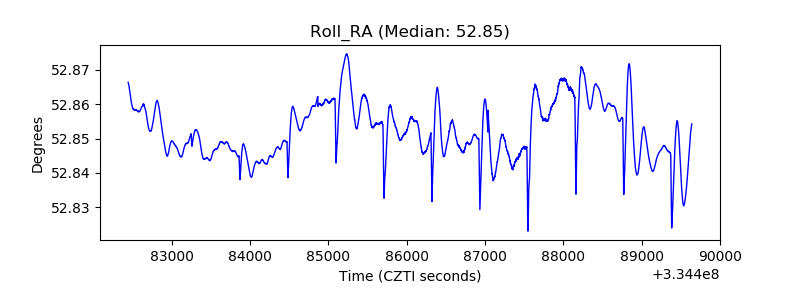 |
| Veto Counter | 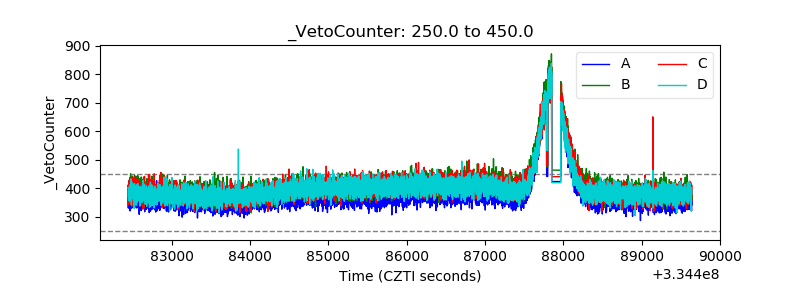 |