| Param | Original file | Final file |
|---|---|---|
| Filename | modeM0/AS1A09_079T03_9000003790_26277cztM0_level2.evt | modeM0/AS1A09_079T03_9000003790_26277cztM0_level2_quad_clean.evt |
| Size (bytes) | 532,788,480 | 96,128,640 |
| Size | 508.1 MB | 91.7 MB |
| Events in quadrant A | 3,561,696 | 603,460 |
| Events in quadrant B | 3,529,564 | 621,822 |
| Events in quadrant C | 4,434,093 | 591,350 |
| Events in quadrant D | 4,116,685 | 588,398 |
| Mode M0 | |||
|---|---|---|---|
| Quadrant | BADHDUFLAG | Total packets | Discarded packets |
| A | 0 | 15353 | 0 |
| B | 0 | 15106 | 0 |
| C | 0 | 17868 | 0 |
| D | 0 | 17222 | 0 |
| Mode M9 | |||
|---|---|---|---|
| Quadrant | BADHDUFLAG | Total packets | Discarded packets |
| A | 0 | 2 | 0 |
| B | 0 | 2 | 0 |
| C | 0 | 2 | 0 |
| D | 0 | 2 | 0 |
| Quadrant | Total seconds | Saturated seconds | Saturation percentage |
|---|---|---|---|
| A | 7261 | 226 | 3.112519% |
| B | 7261 | 205 | 2.823303% |
| C | 7261 | 513 | 7.065143% |
| D | 7261 | 316 | 4.352018% |
Noise dominated data is calculated using 1-second bins in cleaned event files. If a bin has >2000 counts, and if more than 50% of those come from <1% of pixels, then it is considered to be noise-dominated and hence unusable.
| Quadrant | # 1 sec bins | Bins with >0 counts | Bins with >2000 counts | High rate bins dominated by noise | Noise dominated (total time) | Noise dominated (detector-on time) | Marked lightcurve |
|---|---|---|---|---|---|---|---|
| A | 7466 | 7262 | 19 | 19 | 0.25% | 0.26% | 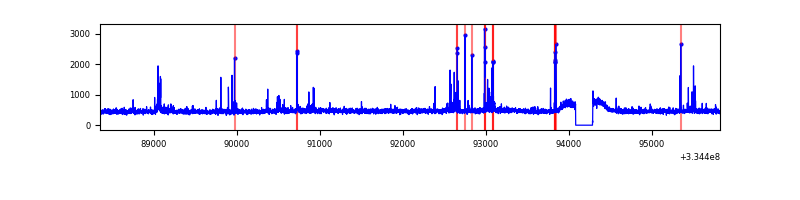 |
| B | 7466 | 7262 | 0 | 0 | 0.00% | 0.00% | 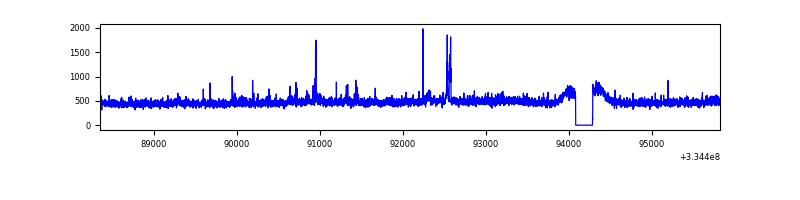 |
| C | 7466 | 7262 | 151 | 151 | 2.02% | 2.08% | 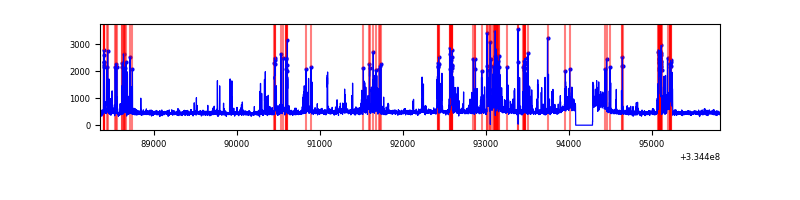 |
| D | 7466 | 7262 | 159 | 159 | 2.13% | 2.19% | 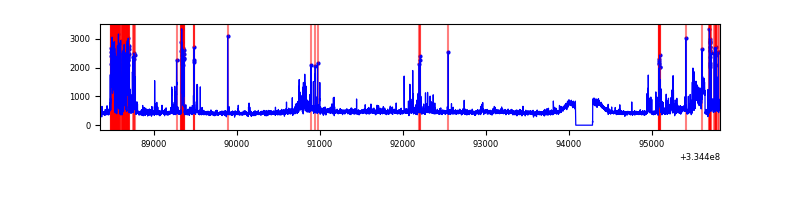 |
Top three noisy pixels from each quadrant. If the there are fewer than three noisy pixels in the level2.evt file, extra rows are filled as -1
| Pixel properties | Quadrant properties | ||||||
|---|---|---|---|---|---|---|---|
| Quadrant | DetID | PixID | Counts | Sigma | Mean | Median | Sigma |
| A | 0 | 13 | 190879 | 1074.79 | 873 | 854 | 176.8 |
| A | 13 | 254 | 11293 | 59.04 | 873 | 854 | 176.8 |
| A | 3 | 137 | 8193 | 41.51 | 873 | 854 | 176.8 |
| B | 5 | 172 | 34437 | 198.04 | 873 | 849 | 169.6 |
| B | 3 | 112 | 28226 | 161.42 | 873 | 849 | 169.6 |
| B | 7 | 219 | 26835 | 153.21 | 873 | 849 | 169.6 |
| C | 4 | 254 | 987831 | 5056.61 | 827 | 832 | 195.2 |
| C | 14 | 238 | 132080 | 672.41 | 827 | 832 | 195.2 |
| C | 3 | 233 | 56619 | 285.81 | 827 | 832 | 195.2 |
| D | 12 | 33 | 547899 | 2696.76 | 844 | 819 | 202.9 |
| D | 1 | 52 | 306866 | 1508.62 | 844 | 819 | 202.9 |
| D | 2 | 234 | 30674 | 147.17 | 844 | 819 | 202.9 |
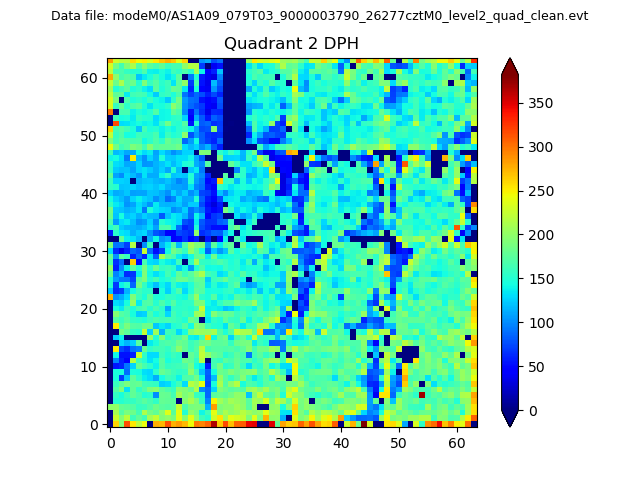
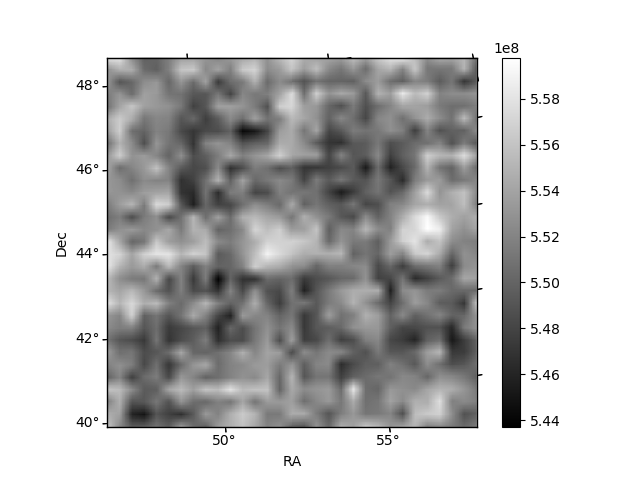
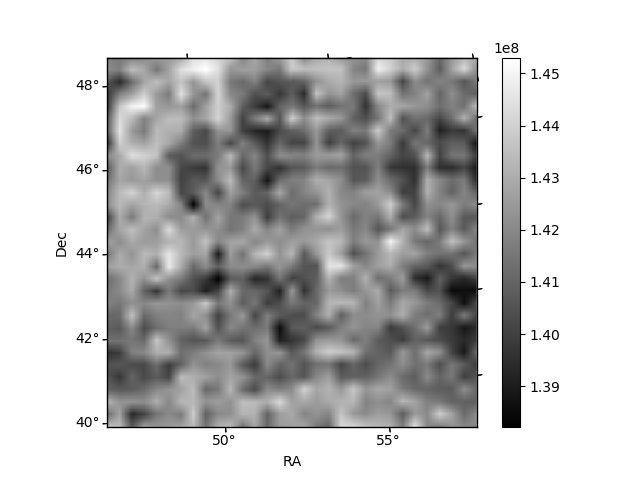
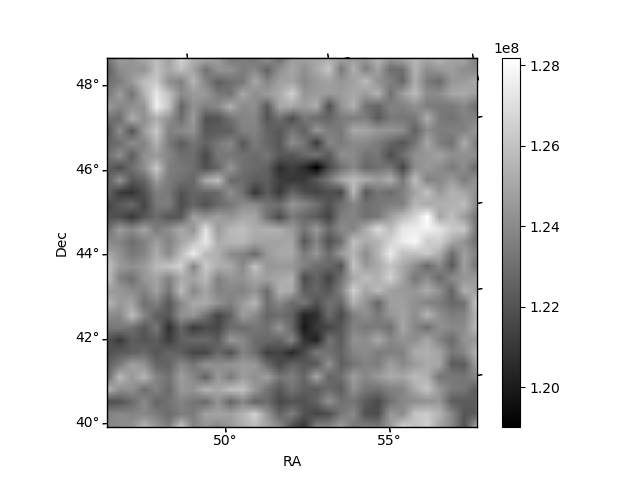
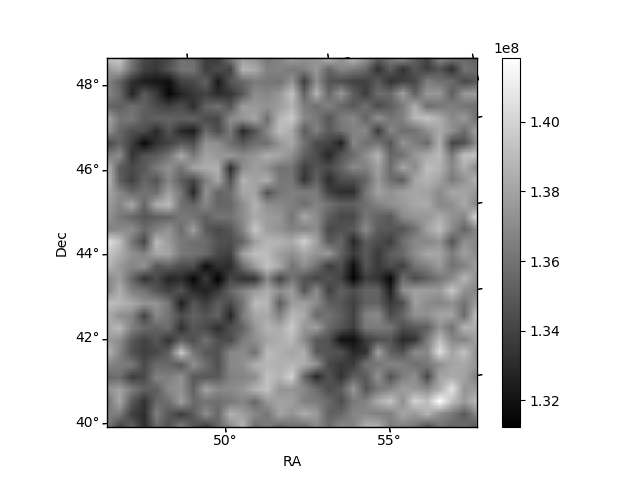
Histogram calculated using DETX and DETY for each event in the final _common_clean file
| Quadrant A | 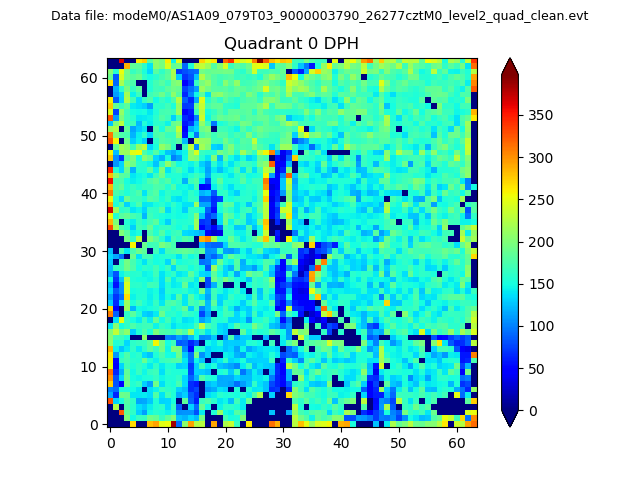 |
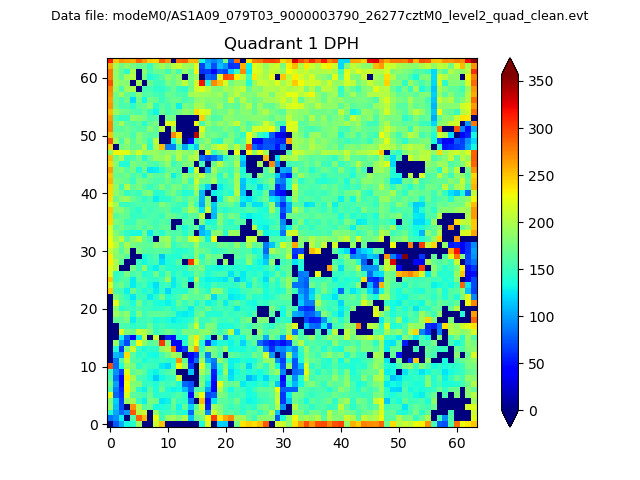 |
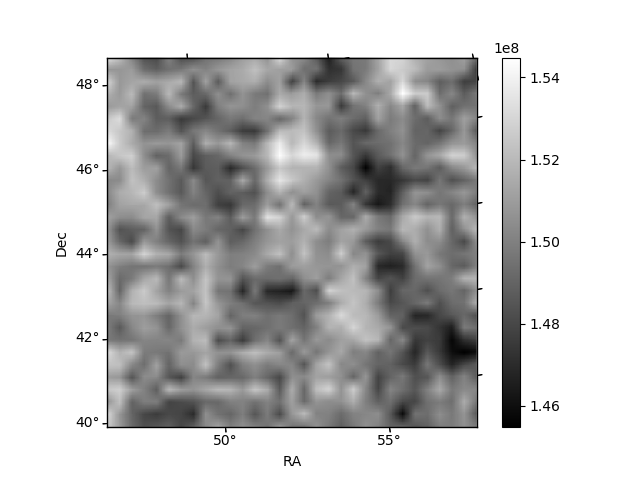
Quadrant B |
|---|---|---|---|
| Quadrant D | 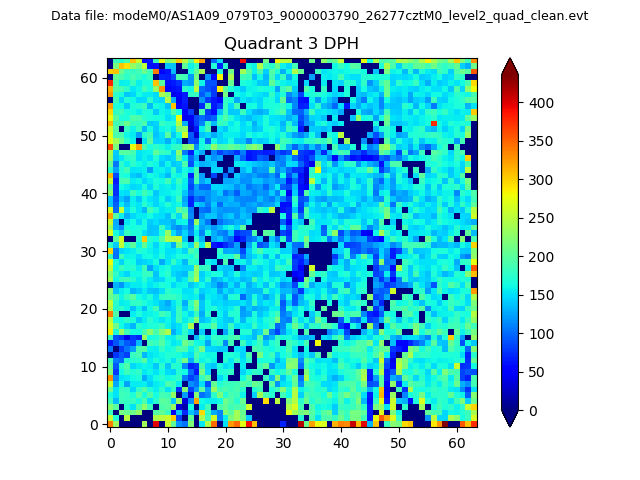 |
 |
Quadrant C |
| Plot type | Count rate plots | Images |
|---|---|---|
| Comparison with Poisson distribution Blue bars denote a histogram of data divided into 1 sec bins. Red curve is a Poisson curve with rate = median count rate of data. |
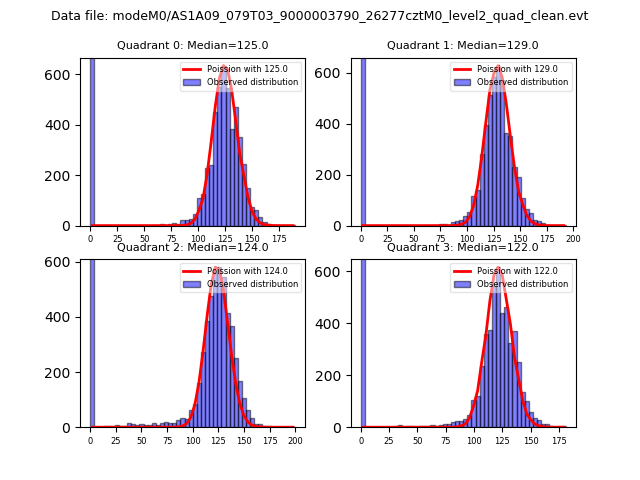 |
 |
| Quadrant-wise count rates Data is divided into 100 sec bins |
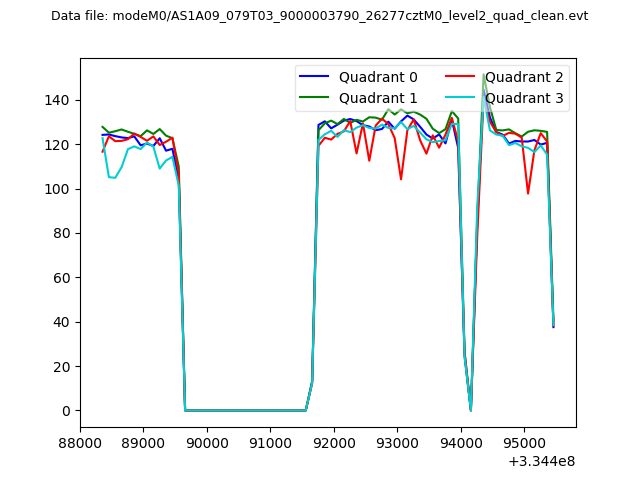 |
|
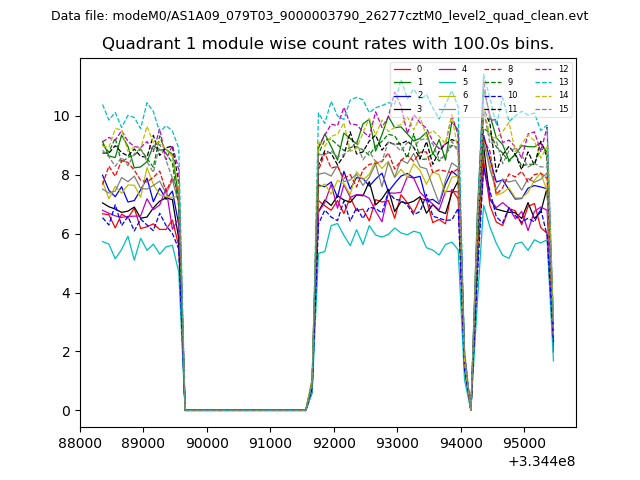
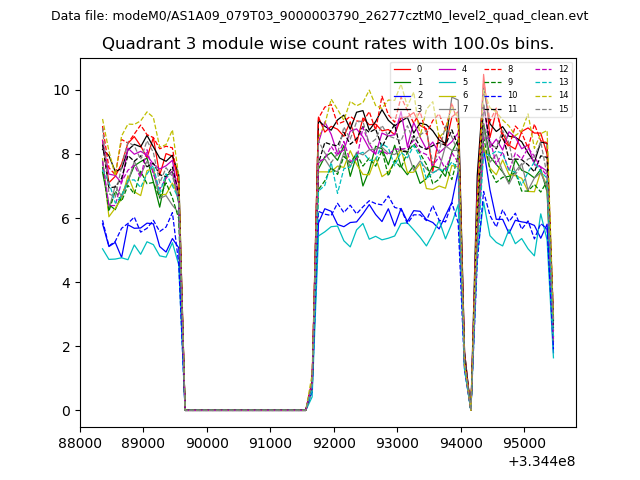
| Module-wise count rates for Quadrant A Data is divided into 100 sec bins |
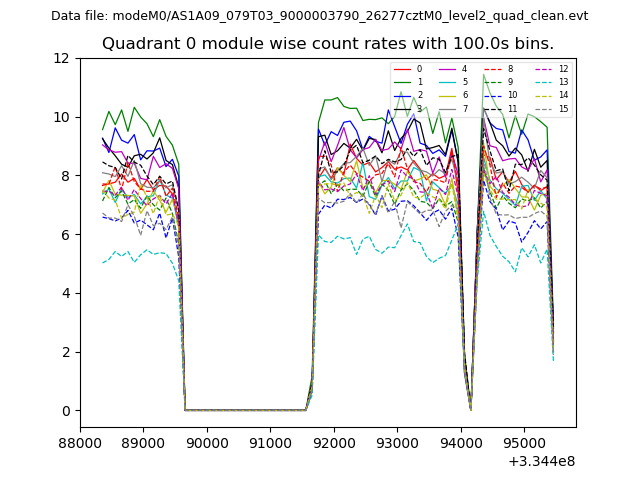 |
 |
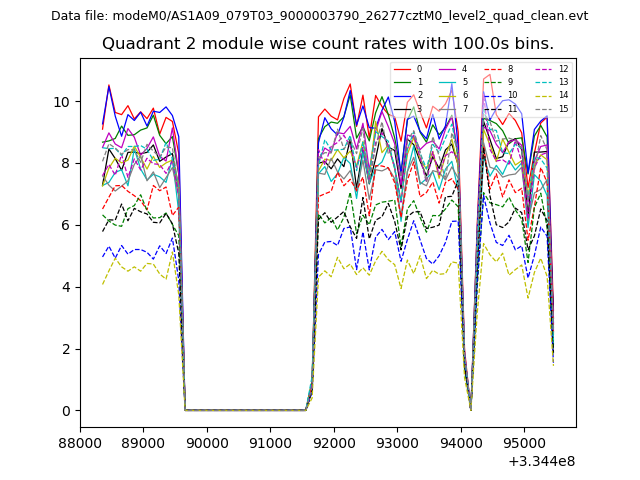
| Module-wise count rates for Quadrant B Data is divided into 100 sec bins |
 |
 |
| Module-wise count rates for Quadrant C Data is divided into 100 sec bins |
 |
 |
| Module-wise count rates for Quadrant D Data is divided into 100 sec bins |
 |
 |
| Parameter | Plot |
|---|---|
| CZT HV Monitor | 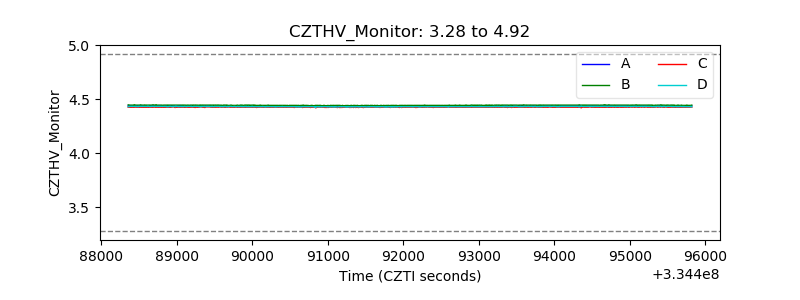 |
| D_VDD | 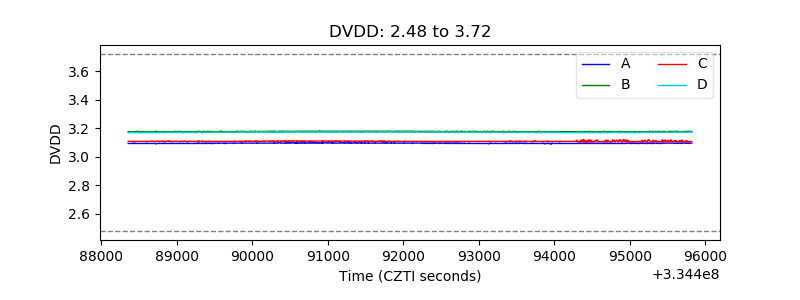 |
| Temperature 1 | 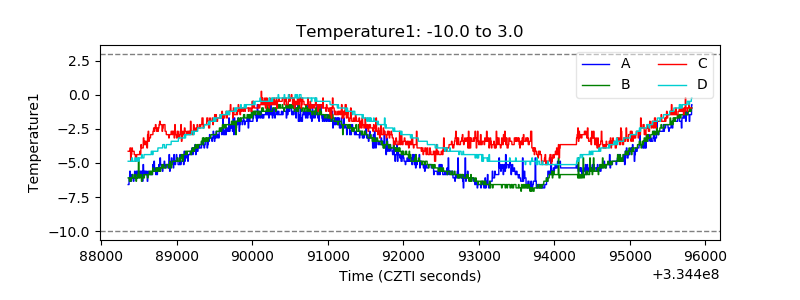 |
| Veto HV Monitor | 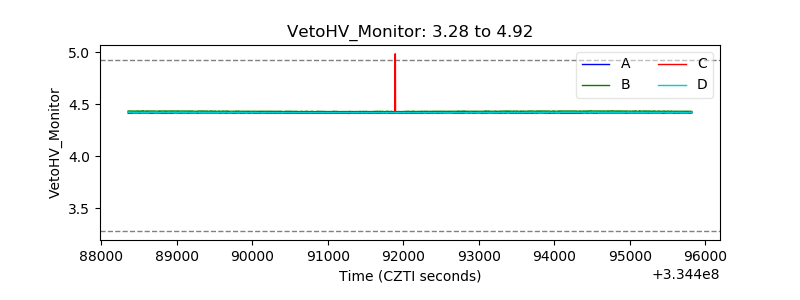 |
| Veto LLD | 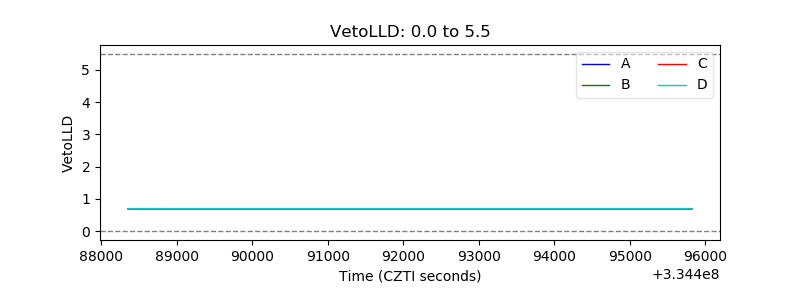 |
| Alpha Counter | 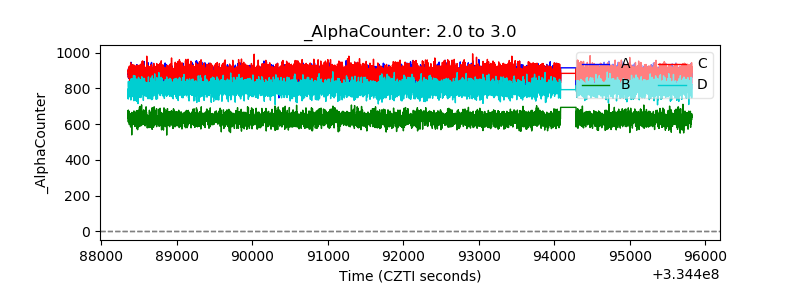 |
| _CPM_Rate | 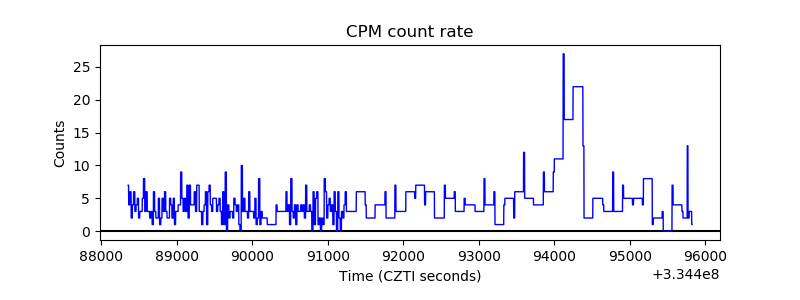 |
| CZT Counter | 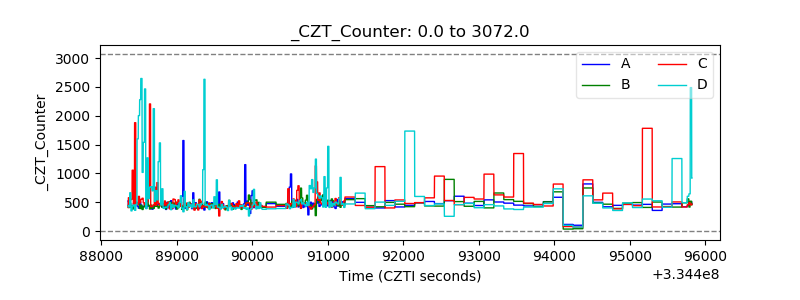 |
| +2.5 Volts monitor |  |
| +5 Volts monitor |  |
| _ROLL_ROT | 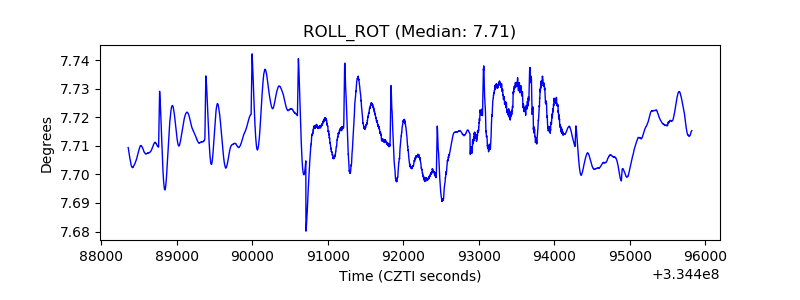 |
| _Roll_DEC | 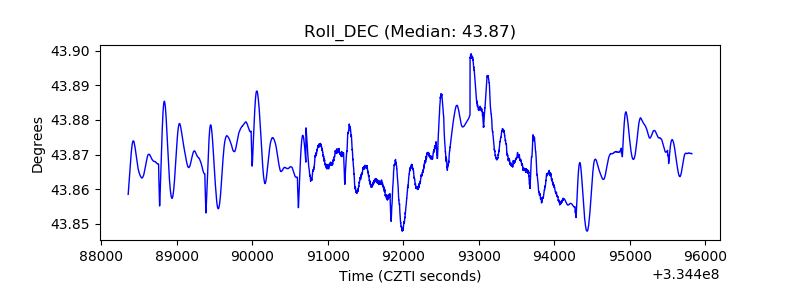 |
| _Roll_RA | 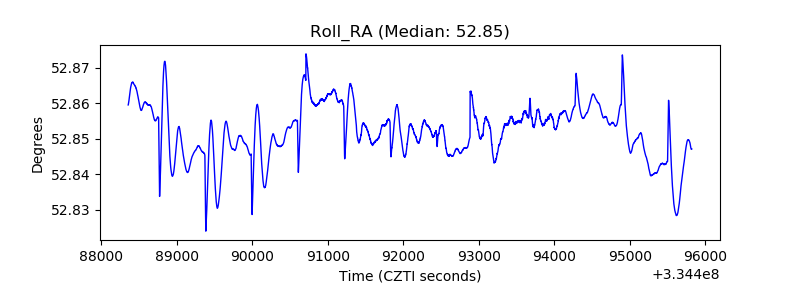 |
| Veto Counter | 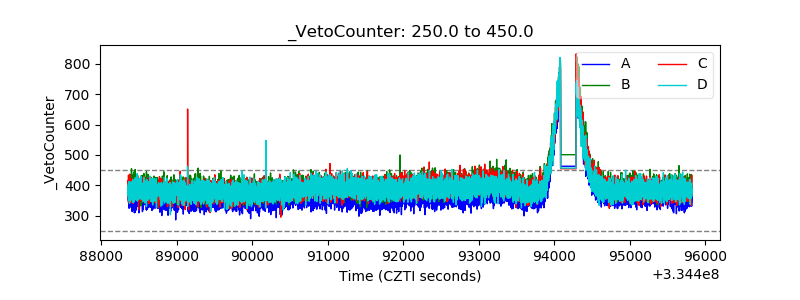 |