| Param | Original file | Final file |
|---|---|---|
| Filename | modeM0/AS1A09_079T03_9000003790_26280cztM0_level2.evt | modeM0/AS1A09_079T03_9000003790_26280cztM0_level2_quad_clean.evt |
| Size (bytes) | 1,368,210,240 | 220,685,760 |
| Size | 1.3 GB | 210.5 MB |
| Events in quadrant A | 9,450,628 | 1,353,093 |
| Events in quadrant B | 9,146,129 | 1,385,901 |
| Events in quadrant C | 9,855,378 | 1,347,181 |
| Events in quadrant D | 11,726,454 | 1,314,478 |
| Mode M0 | |||
|---|---|---|---|
| Quadrant | BADHDUFLAG | Total packets | Discarded packets |
| A | 0 | 40196 | 0 |
| B | 0 | 38800 | 0 |
| C | 0 | 40783 | 0 |
| D | 0 | 47325 | 0 |
| Mode M9 | |||
|---|---|---|---|
| Quadrant | BADHDUFLAG | Total packets | Discarded packets |
| A | 0 | 19 | 0 |
| B | 0 | 19 | 0 |
| C | 0 | 19 | 0 |
| D | 0 | 19 | 0 |
| Quadrant | Total seconds | Saturated seconds | Saturation percentage |
|---|---|---|---|
| A | 18616 | 393 | 2.111087% |
| B | 18617 | 301 | 1.616802% |
| C | 18617 | 484 | 2.599774% |
| D | 18617 | 654 | 3.512918% |
Noise dominated data is calculated using 1-second bins in cleaned event files. If a bin has >2000 counts, and if more than 50% of those come from <1% of pixels, then it is considered to be noise-dominated and hence unusable.
| Quadrant | # 1 sec bins | Bins with >0 counts | Bins with >2000 counts | High rate bins dominated by noise | Noise dominated (total time) | Noise dominated (detector-on time) | Marked lightcurve |
|---|---|---|---|---|---|---|---|
| A | 20501 | 18619 | 73 | 73 | 0.36% | 0.39% | 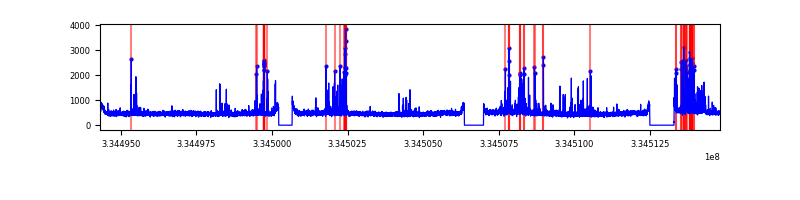 |
| B | 20502 | 18620 | 11 | 11 | 0.05% | 0.06% | 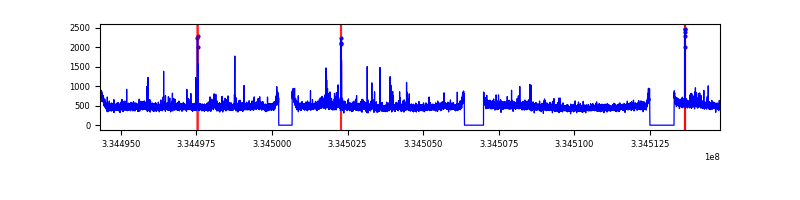 |
| C | 20502 | 18620 | 77 | 77 | 0.38% | 0.41% | 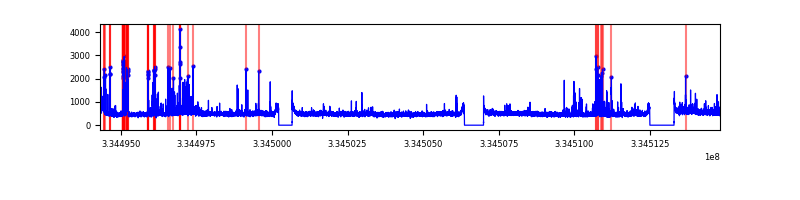 |
| D | 20502 | 18620 | 374 | 374 | 1.82% | 2.01% | 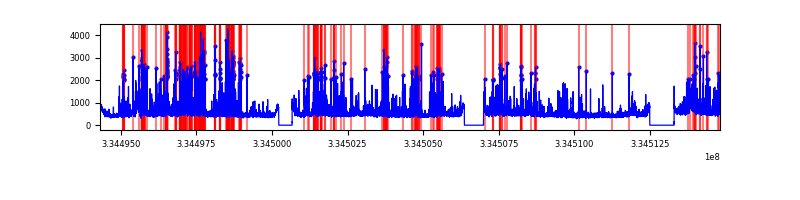 |
Top three noisy pixels from each quadrant. If the there are fewer than three noisy pixels in the level2.evt file, extra rows are filled as -1
| Pixel properties | Quadrant properties | ||||||
|---|---|---|---|---|---|---|---|
| Quadrant | DetID | PixID | Counts | Sigma | Mean | Median | Sigma |
| A | 0 | 13 | 732249 | 1605.01 | 2261 | 2207 | 454.9 |
| A | 13 | 254 | 32366 | 66.31 | 2261 | 2207 | 454.9 |
| A | 3 | 137 | 21025 | 41.37 | 2261 | 2207 | 454.9 |
| B | 5 | 172 | 94206 | 212.15 | 2264 | 2205 | 433.7 |
| B | 3 | 112 | 83419 | 187.28 | 2264 | 2205 | 433.7 |
| B | 7 | 219 | 68237 | 152.27 | 2264 | 2205 | 433.7 |
| C | 4 | 254 | 734104 | 1444.2 | 2174 | 2187 | 506.8 |
| C | 14 | 238 | 339644 | 665.86 | 2174 | 2187 | 506.8 |
| C | 3 | 233 | 241510 | 472.23 | 2174 | 2187 | 506.8 |
| D | 1 | 52 | 3092821 | 5907.68 | 2188 | 2136 | 523.2 |
| D | 12 | 33 | 96961 | 181.25 | 2188 | 2136 | 523.2 |
| D | 2 | 234 | 84989 | 158.37 | 2188 | 2136 | 523.2 |
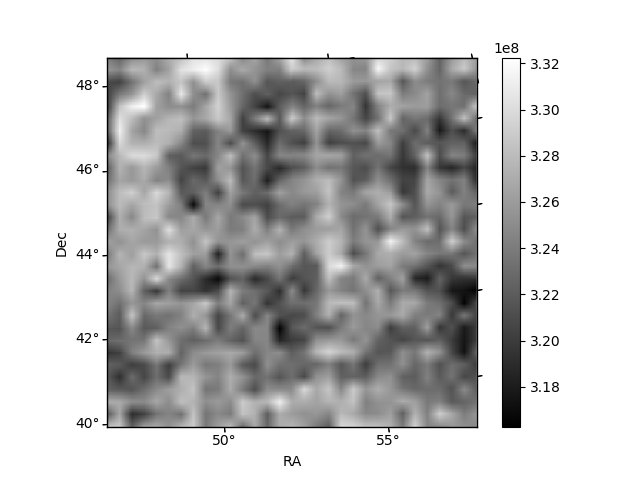
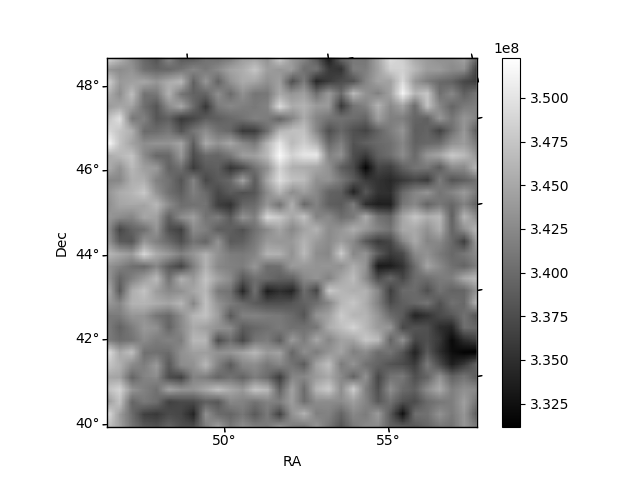
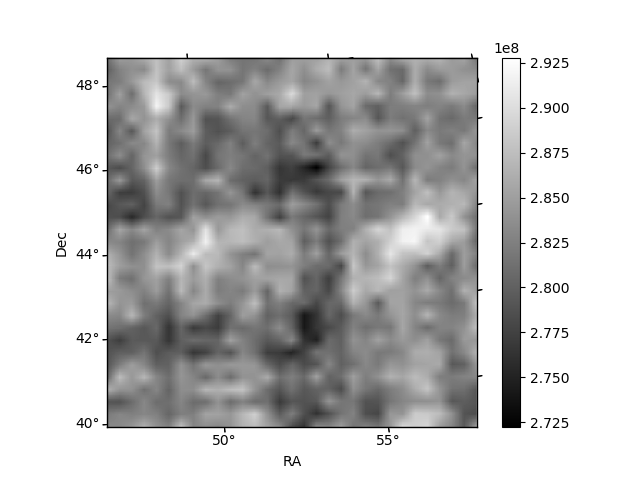
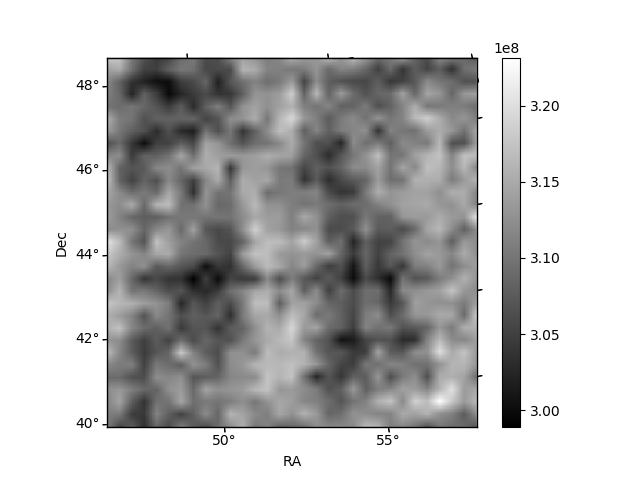
Histogram calculated using DETX and DETY for each event in the final _common_clean file
| Quadrant A | 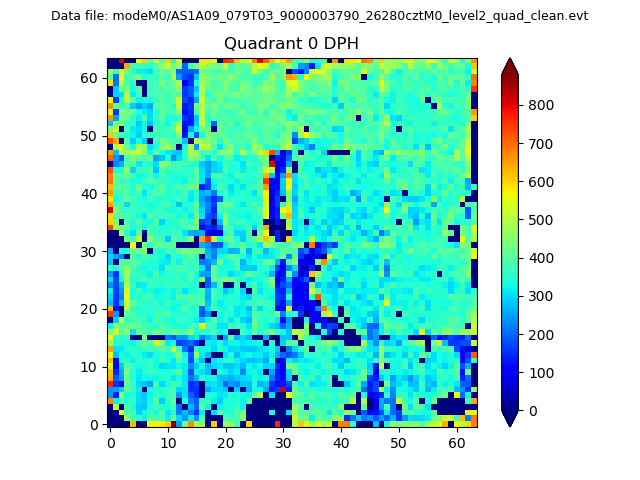 |
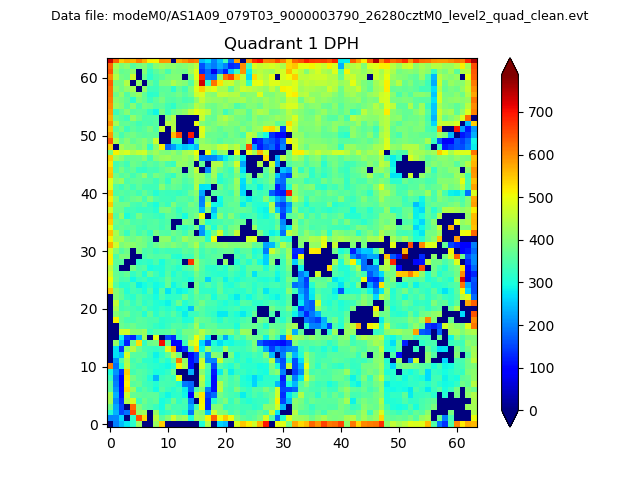 |
Quadrant B |
|---|---|---|---|
| Quadrant D | 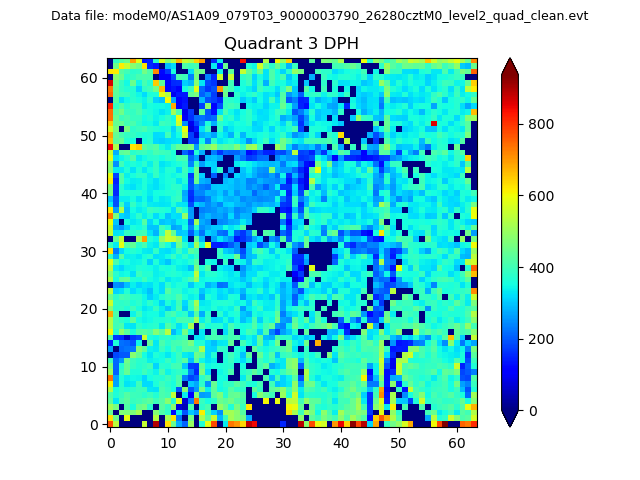 |
 |
Quadrant C |
| Plot type | Count rate plots | Images |
|---|---|---|
| Comparison with Poisson distribution Blue bars denote a histogram of data divided into 1 sec bins. Red curve is a Poisson curve with rate = median count rate of data. |
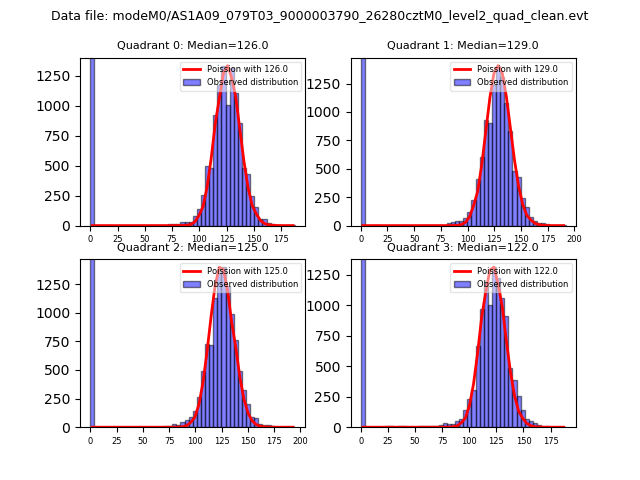 |
 |
| Quadrant-wise count rates Data is divided into 100 sec bins |
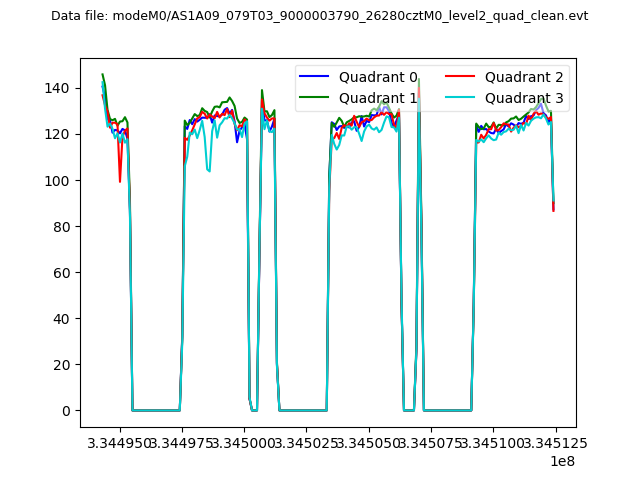 |
|
| Module-wise count rates for Quadrant A Data is divided into 100 sec bins |
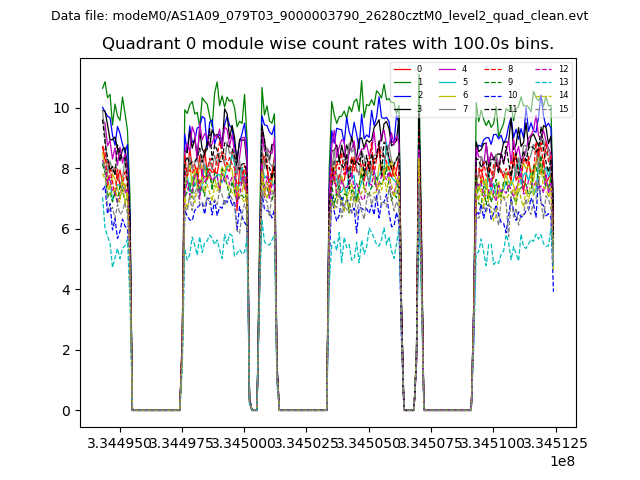 |
 |
| Module-wise count rates for Quadrant B Data is divided into 100 sec bins |
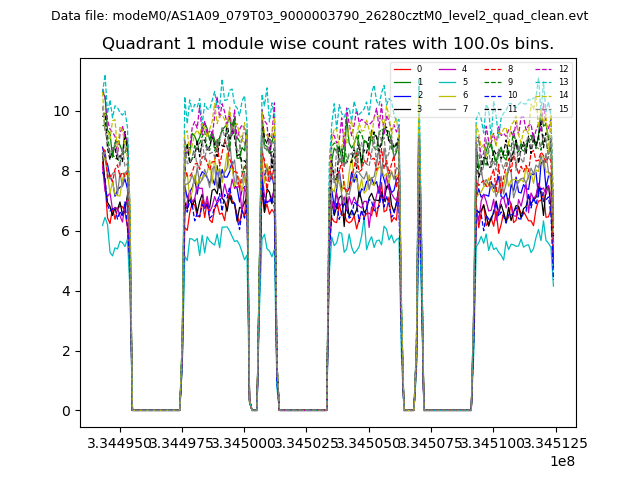 |
 |
| Module-wise count rates for Quadrant C Data is divided into 100 sec bins |
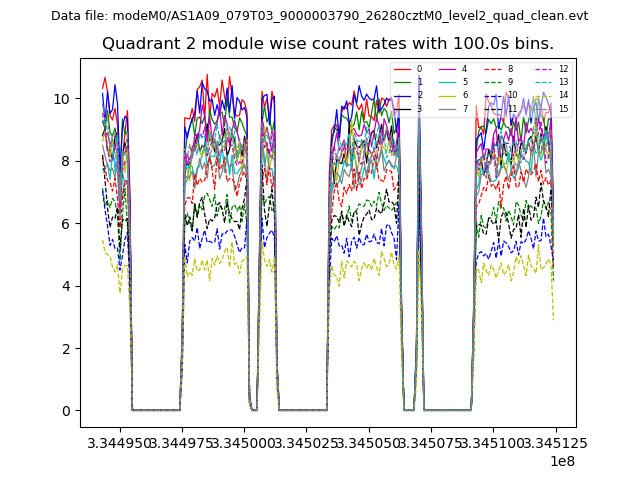 |
 |
| Module-wise count rates for Quadrant D Data is divided into 100 sec bins |
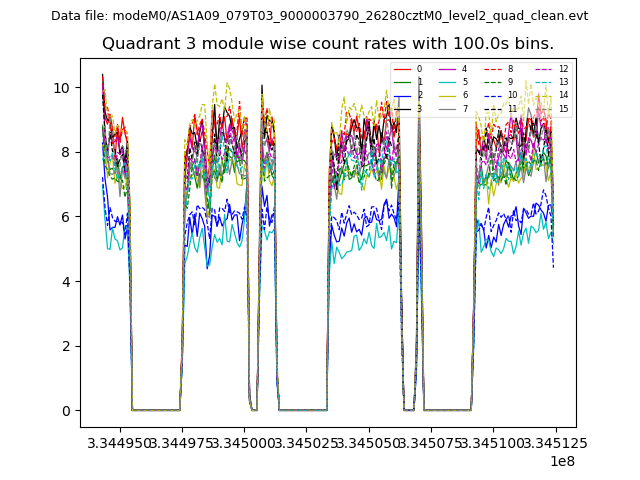 |
 |
| Parameter | Plot |
|---|---|
| CZT HV Monitor | 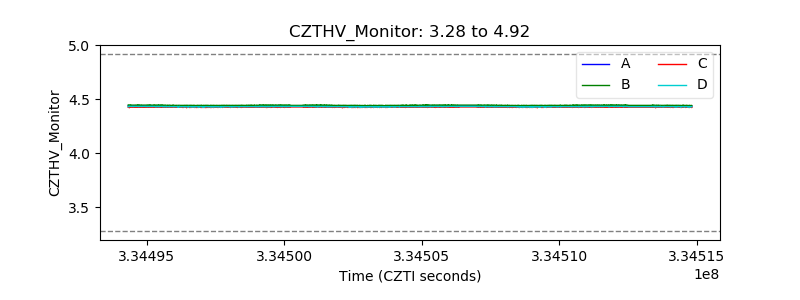 |
| D_VDD | 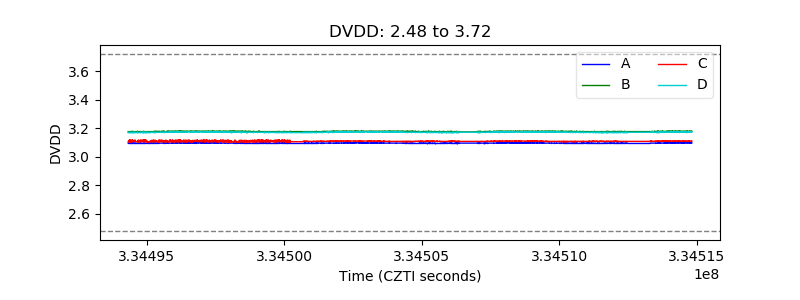 |
| Temperature 1 | 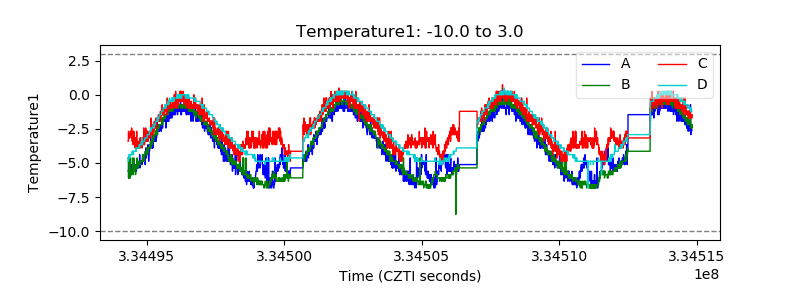 |
| Veto HV Monitor | 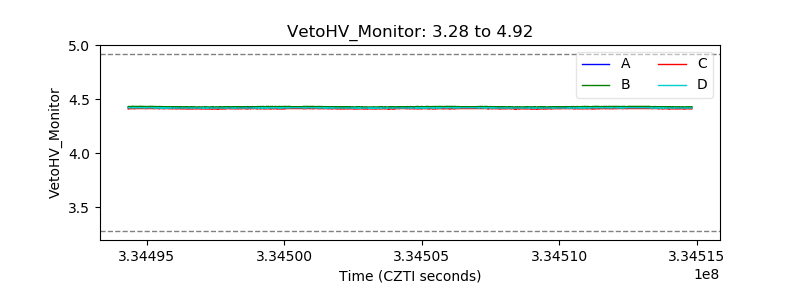 |
| Veto LLD | 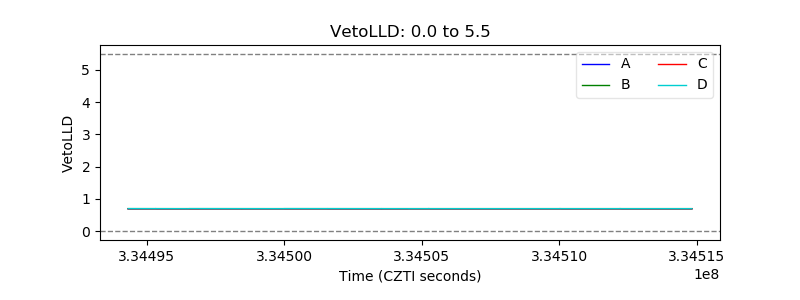 |
| Alpha Counter | 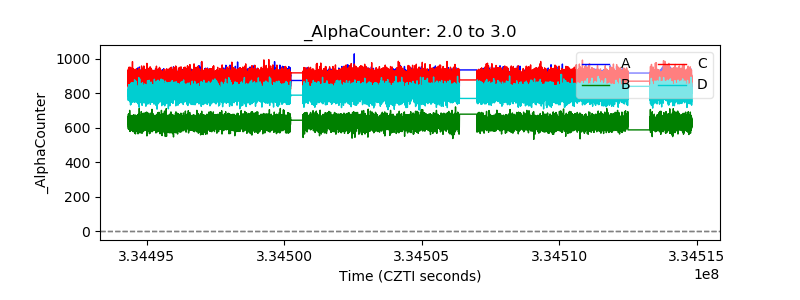 |
| _CPM_Rate | 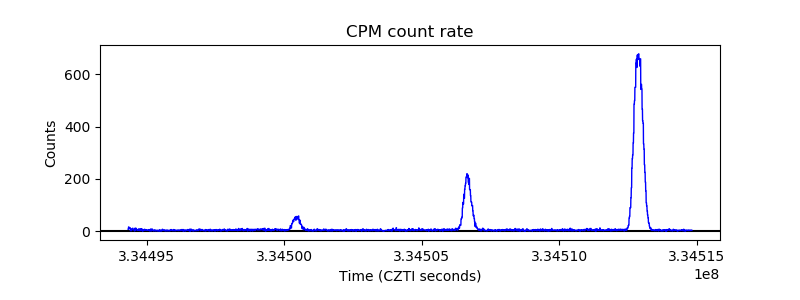 |
| CZT Counter |  |
| +2.5 Volts monitor |  |
| +5 Volts monitor |  |
| _ROLL_ROT | 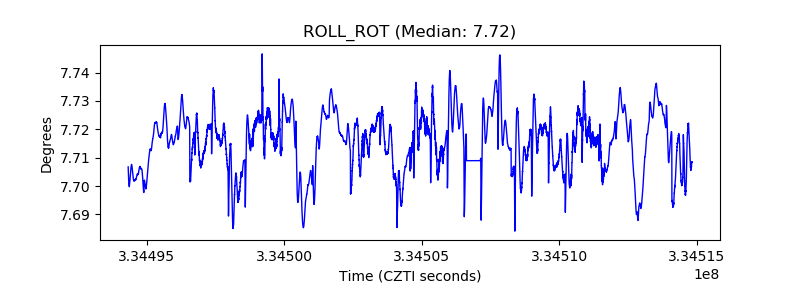 |
| _Roll_DEC | 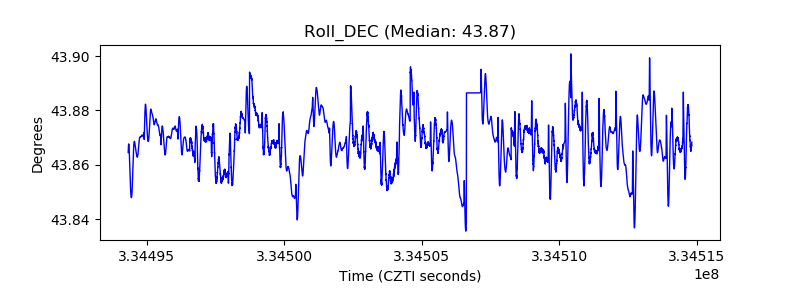 |
| _Roll_RA | 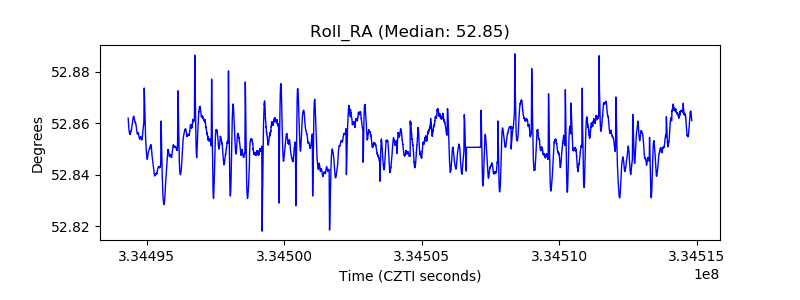 |
| Veto Counter | 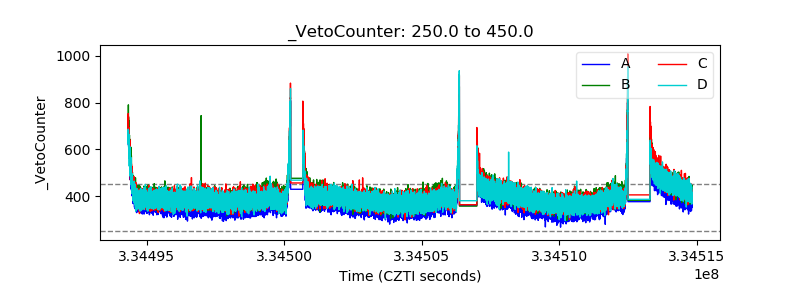 |