| Param | Original file | Final file |
|---|---|---|
| Filename | modeM0/AS1A09_079T03_9000003790_26281cztM0_level2.evt | modeM0/AS1A09_079T03_9000003790_26281cztM0_level2_quad_clean.evt |
| Size (bytes) | 533,298,240 | 72,809,280 |
| Size | 508.6 MB | 69.4 MB |
| Events in quadrant A | 3,910,893 | 435,189 |
| Events in quadrant B | 3,490,688 | 444,786 |
| Events in quadrant C | 3,501,261 | 438,212 |
| Events in quadrant D | 4,799,025 | 424,497 |
| Mode M0 | |||
|---|---|---|---|
| Quadrant | BADHDUFLAG | Total packets | Discarded packets |
| A | 0 | 16022 | 0 |
| B | 0 | 14761 | 0 |
| C | 0 | 14689 | 0 |
| D | 0 | 18867 | 0 |
| Mode M9 | |||
|---|---|---|---|
| Quadrant | BADHDUFLAG | Total packets | Discarded packets |
| A | 0 | 17 | 0 |
| B | 0 | 18 | 0 |
| C | 0 | 18 | 0 |
| D | 0 | 18 | 0 |
| Quadrant | Total seconds | Saturated seconds | Saturation percentage |
|---|---|---|---|
| A | 6625 | 169 | 2.550943% |
| B | 6625 | 56 | 0.845283% |
| C | 6624 | 97 | 1.464372% |
| D | 6624 | 321 | 4.846014% |
Noise dominated data is calculated using 1-second bins in cleaned event files. If a bin has >2000 counts, and if more than 50% of those come from <1% of pixels, then it is considered to be noise-dominated and hence unusable.
| Quadrant | # 1 sec bins | Bins with >0 counts | Bins with >2000 counts | High rate bins dominated by noise | Noise dominated (total time) | Noise dominated (detector-on time) | Marked lightcurve |
|---|---|---|---|---|---|---|---|
| A | 7590 | 6626 | 75 | 75 | 0.99% | 1.13% | 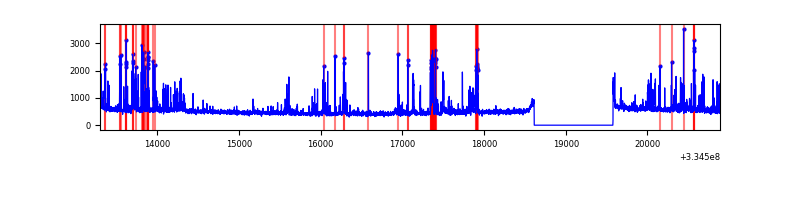 |
| B | 7590 | 6626 | 6 | 6 | 0.08% | 0.09% | 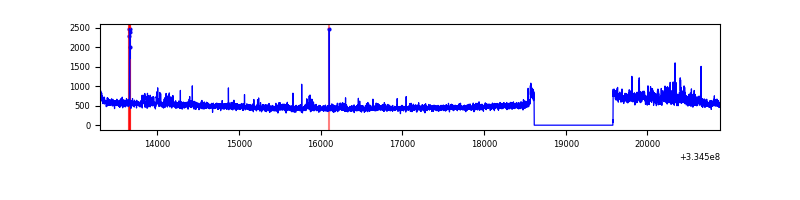 |
| C | 7589 | 6625 | 6 | 6 | 0.08% | 0.09% | 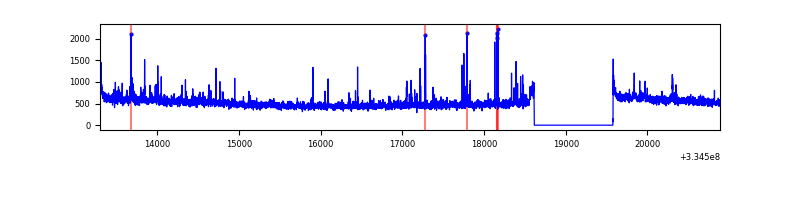 |
| D | 7589 | 6625 | 236 | 236 | 3.11% | 3.56% | 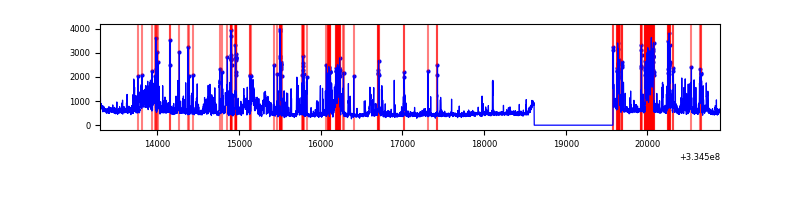 |
Top three noisy pixels from each quadrant. If the there are fewer than three noisy pixels in the level2.evt file, extra rows are filled as -1
| Pixel properties | Quadrant properties | ||||||
|---|---|---|---|---|---|---|---|
| Quadrant | DetID | PixID | Counts | Sigma | Mean | Median | Sigma |
| A | 0 | 13 | 698986 | 4135.47 | 832 | 813 | 168.8 |
| A | 13 | 254 | 11370 | 62.53 | 832 | 813 | 168.8 |
| A | 3 | 137 | 7596 | 40.18 | 832 | 813 | 168.8 |
| B | 6 | 203 | 135121 | 843.8 | 836 | 815 | 159.2 |
| B | 5 | 172 | 31064 | 190.04 | 836 | 815 | 159.2 |
| B | 7 | 219 | 22085 | 133.63 | 836 | 815 | 159.2 |
| C | 14 | 238 | 128112 | 674.73 | 808 | 814 | 188.7 |
| C | 3 | 233 | 124898 | 657.7 | 808 | 814 | 188.7 |
| C | 4 | 254 | 84476 | 443.44 | 808 | 814 | 188.7 |
| D | 1 | 52 | 1694090 | 8806.2 | 799 | 779 | 192.3 |
| D | 2 | 234 | 29193 | 147.77 | 799 | 779 | 192.3 |
| D | 8 | 195 | 16181 | 80.1 | 799 | 779 | 192.3 |
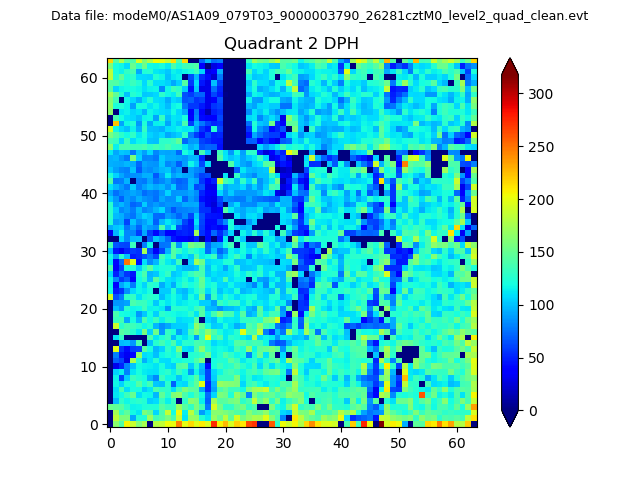
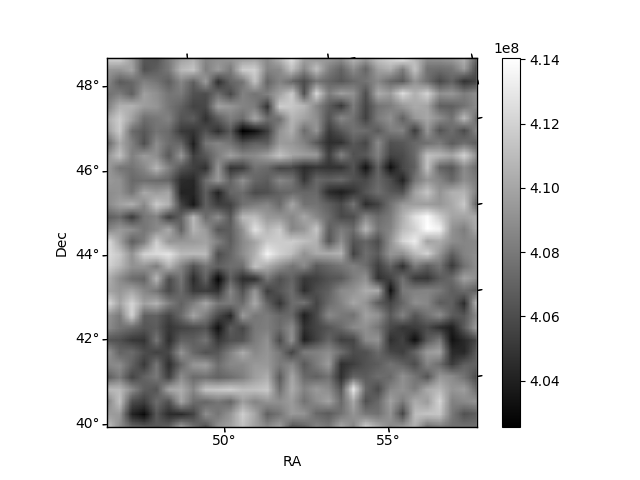
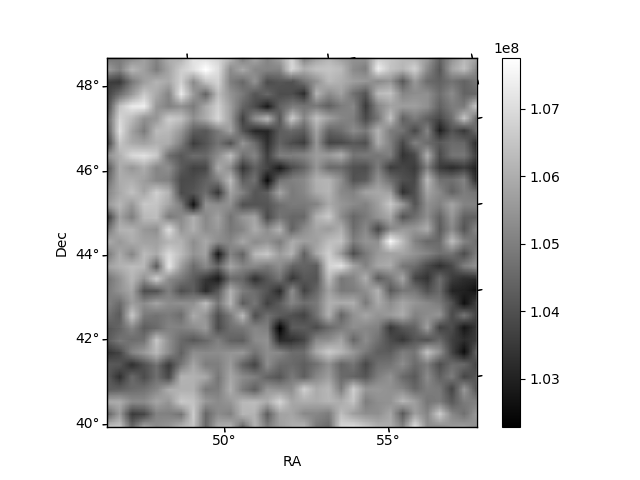
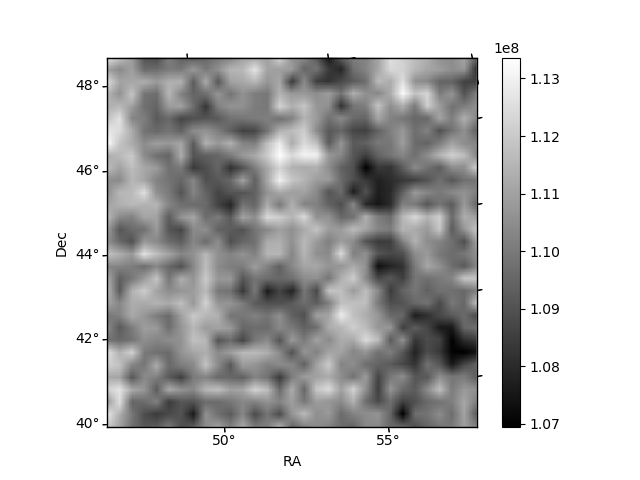
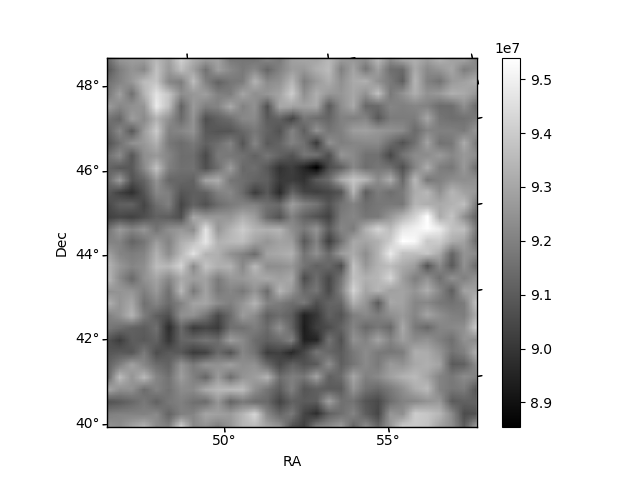
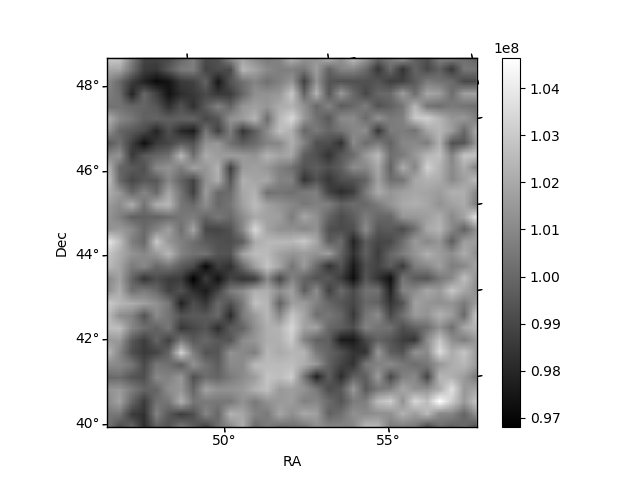
Histogram calculated using DETX and DETY for each event in the final _common_clean file
| Quadrant A | 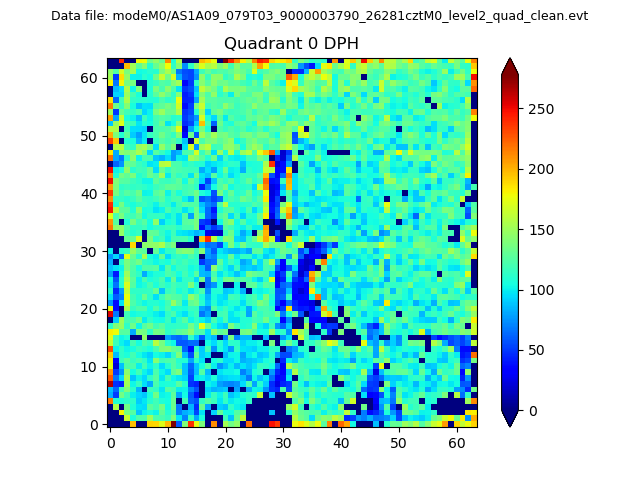 |
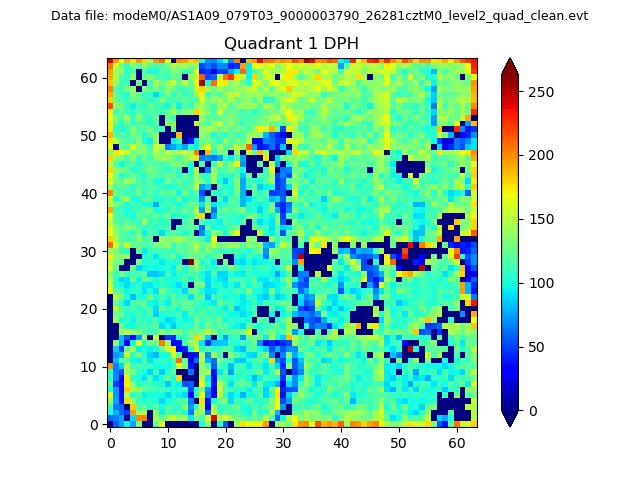 |
Quadrant B |
|---|---|---|---|
| Quadrant D | 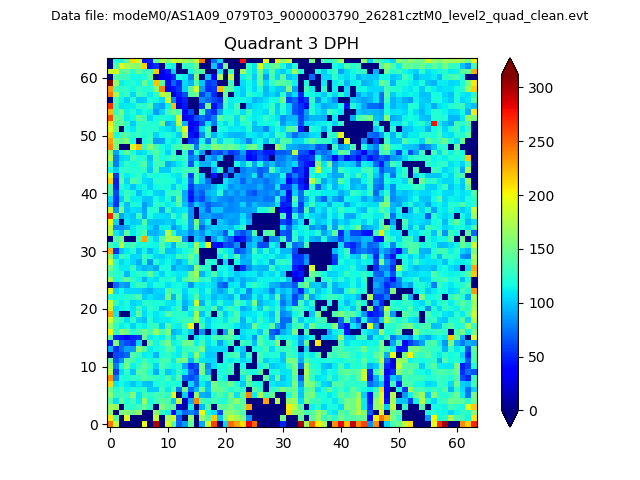 |
 |
Quadrant C |
| Plot type | Count rate plots | Images |
|---|---|---|
| Comparison with Poisson distribution Blue bars denote a histogram of data divided into 1 sec bins. Red curve is a Poisson curve with rate = median count rate of data. |
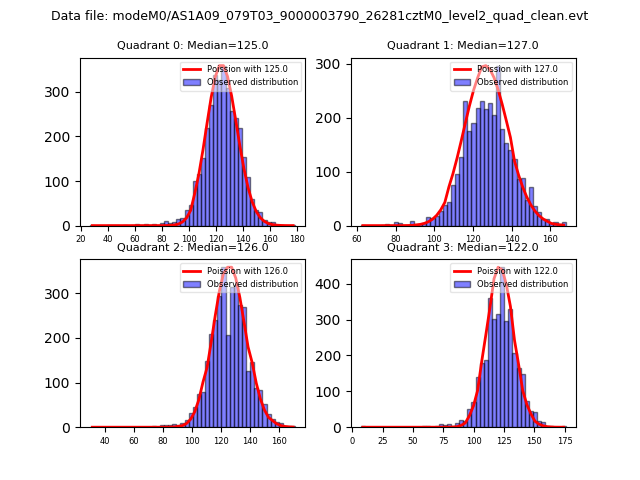 |
 |
| Quadrant-wise count rates Data is divided into 100 sec bins |
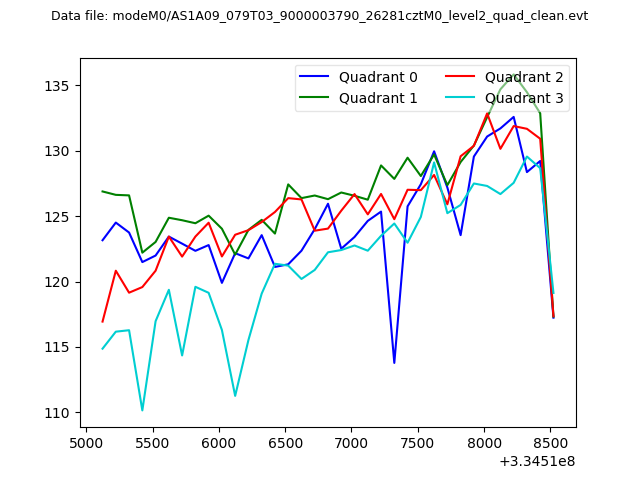 |
|
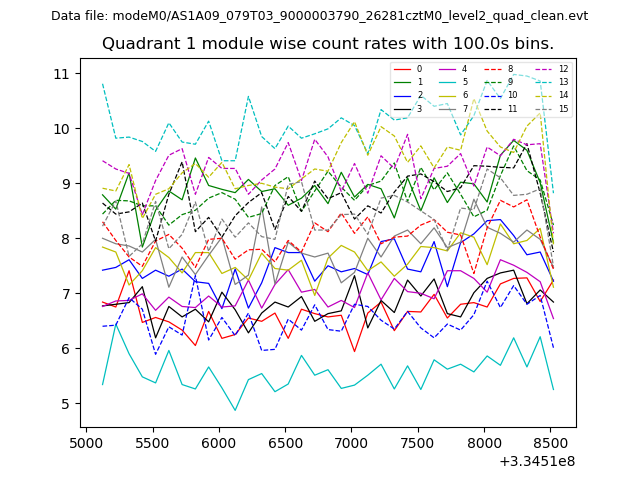
| Module-wise count rates for Quadrant A Data is divided into 100 sec bins |
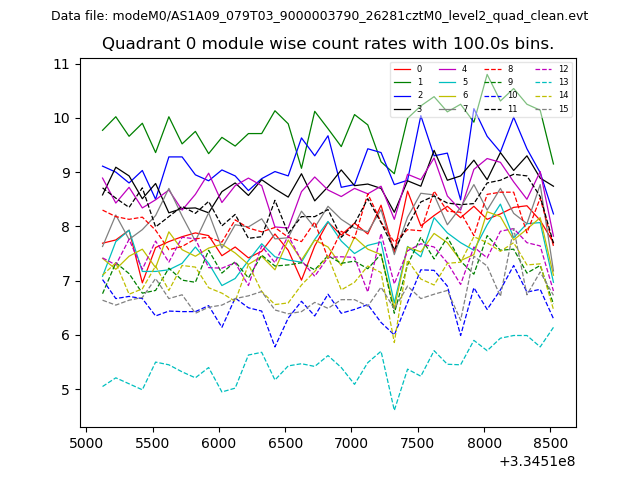 |
 |
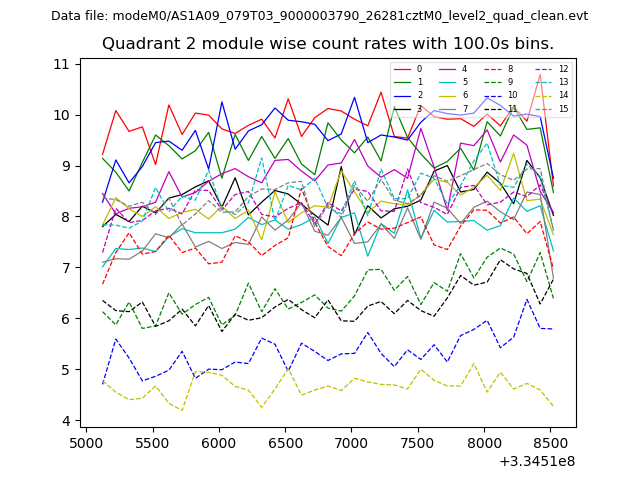
| Module-wise count rates for Quadrant B Data is divided into 100 sec bins |
 |
 |
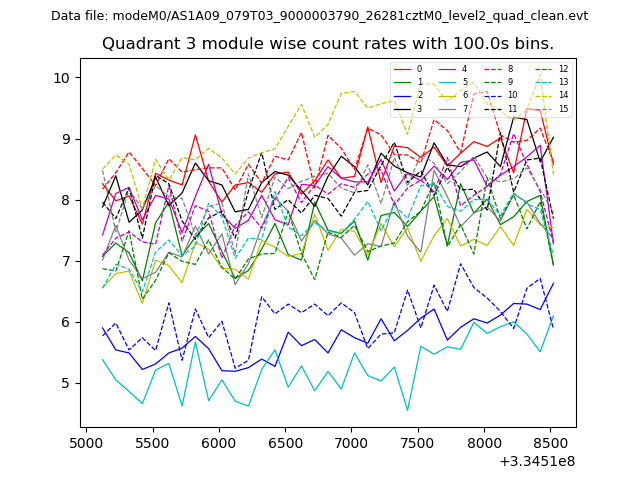
| Module-wise count rates for Quadrant C Data is divided into 100 sec bins |
 |
 |
| Module-wise count rates for Quadrant D Data is divided into 100 sec bins |
 |
 |
| Parameter | Plot |
|---|---|
| CZT HV Monitor | 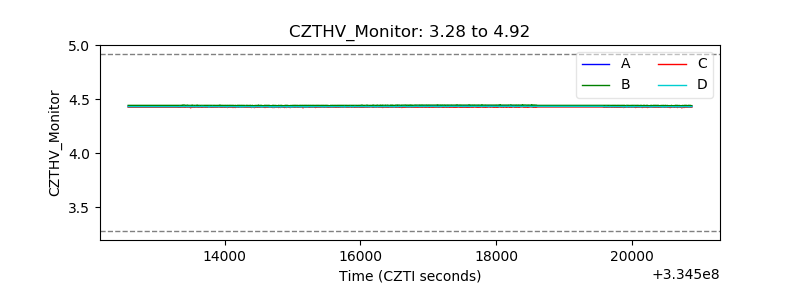 |
| D_VDD | 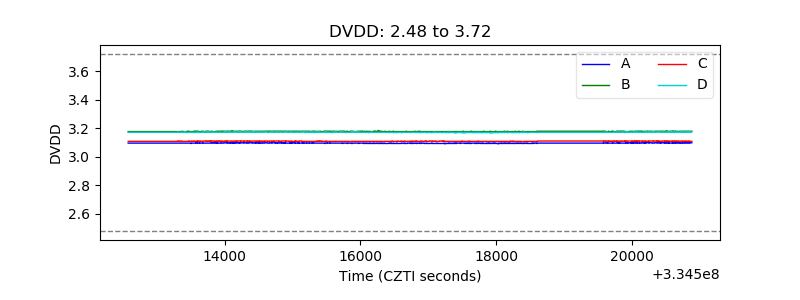 |
| Temperature 1 | 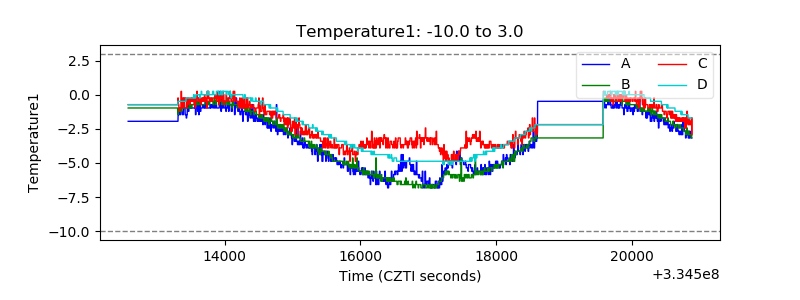 |
| Veto HV Monitor | 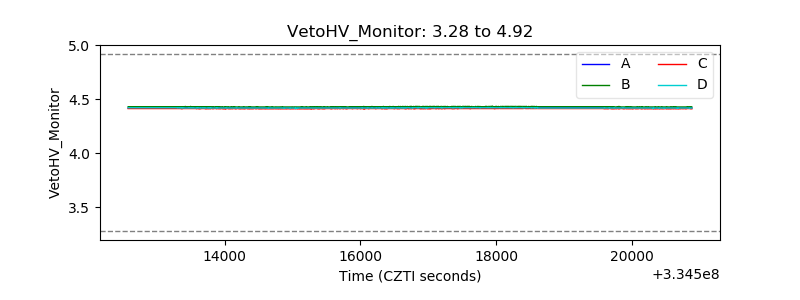 |
| Veto LLD | 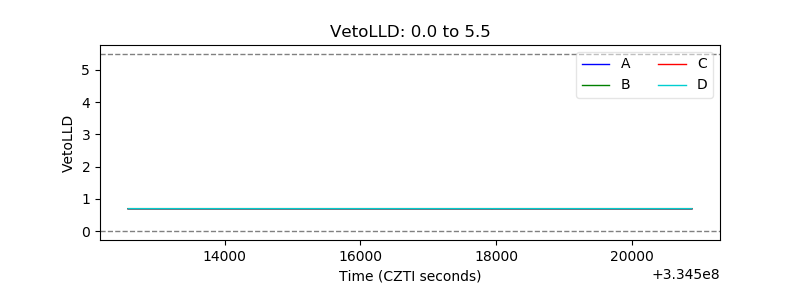 |
| Alpha Counter | 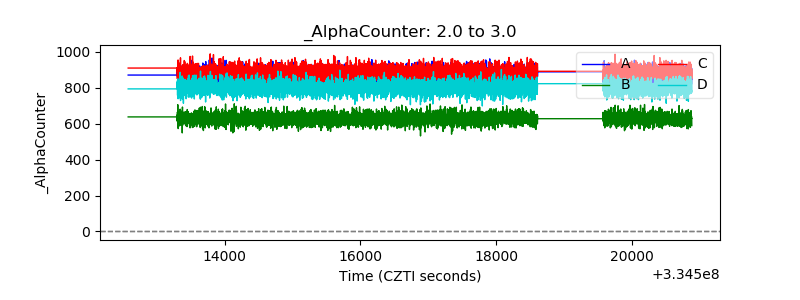 |
| _CPM_Rate | 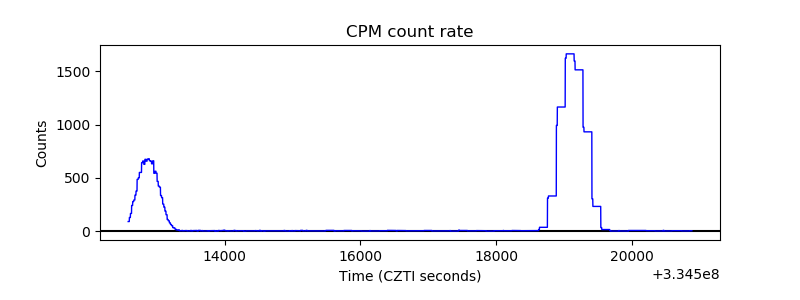 |
| CZT Counter | 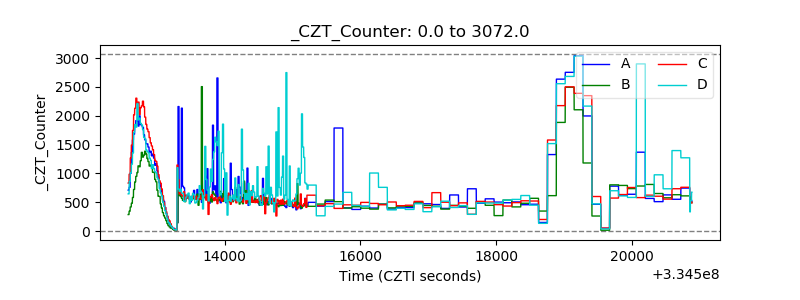 |
| +2.5 Volts monitor |  |
| +5 Volts monitor |  |
| _ROLL_ROT | 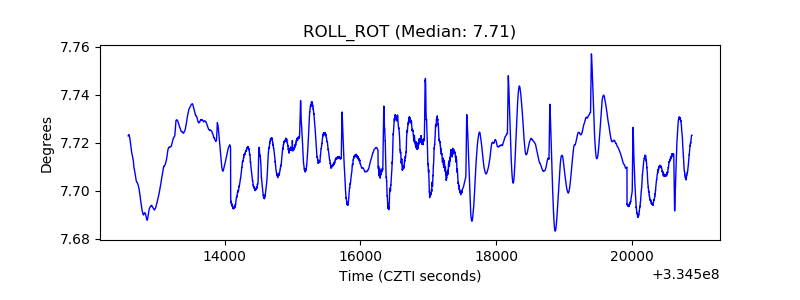 |
| _Roll_DEC | 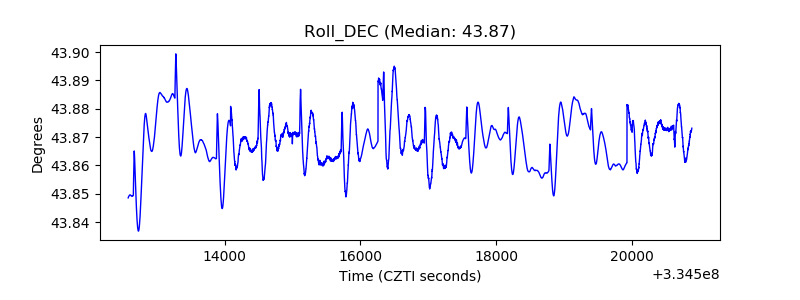 |
| _Roll_RA | 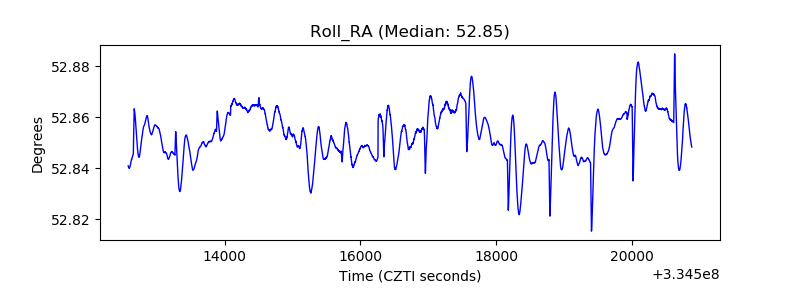 |
| Veto Counter | 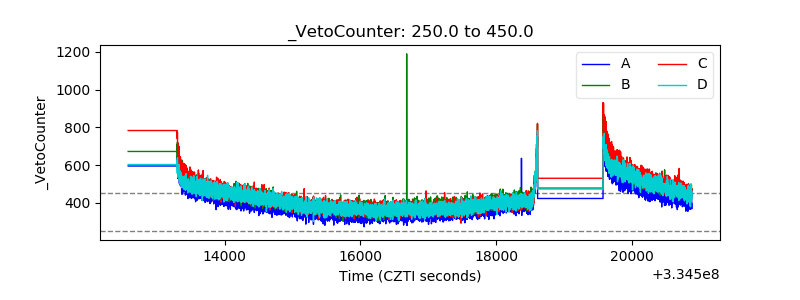 |