| Param | Original file | Final file |
|---|---|---|
| Filename | modeM0/AS1A09_079T03_9000003790_26283cztM0_level2.evt | modeM0/AS1A09_079T03_9000003790_26283cztM0_level2_quad_clean.evt |
| Size (bytes) | 534,427,200 | 86,014,080 |
| Size | 509.7 MB | 82.0 MB |
| Events in quadrant A | 3,802,937 | 536,276 |
| Events in quadrant B | 3,617,226 | 551,469 |
| Events in quadrant C | 3,775,486 | 537,910 |
| Events in quadrant D | 4,548,027 | 525,066 |
| Mode M0 | |||
|---|---|---|---|
| Quadrant | BADHDUFLAG | Total packets | Discarded packets |
| A | 0 | 15774 | 0 |
| B | 0 | 15159 | 0 |
| C | 0 | 15605 | 0 |
| D | 0 | 18061 | 0 |
| Mode M9 | |||
|---|---|---|---|
| Quadrant | BADHDUFLAG | Total packets | Discarded packets |
| A | 0 | 20 | 0 |
| B | 0 | 21 | 0 |
| C | 0 | 21 | 0 |
| D | 0 | 21 | 0 |
| Quadrant | Total seconds | Saturated seconds | Saturation percentage |
|---|---|---|---|
| A | 6511 | 134 | 2.058056% |
| B | 6511 | 121 | 1.858393% |
| C | 6510 | 178 | 2.734255% |
| D | 6510 | 366 | 5.622120% |
Noise dominated data is calculated using 1-second bins in cleaned event files. If a bin has >2000 counts, and if more than 50% of those come from <1% of pixels, then it is considered to be noise-dominated and hence unusable.
| Quadrant | # 1 sec bins | Bins with >0 counts | Bins with >2000 counts | High rate bins dominated by noise | Noise dominated (total time) | Noise dominated (detector-on time) | Marked lightcurve |
|---|---|---|---|---|---|---|---|
| A | 7621 | 6512 | 48 | 48 | 0.63% | 0.74% | 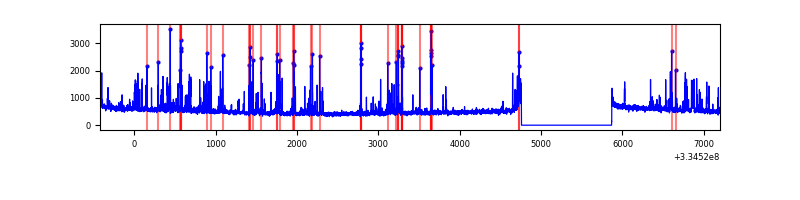 |
| B | 7621 | 6512 | 32 | 32 | 0.42% | 0.49% | 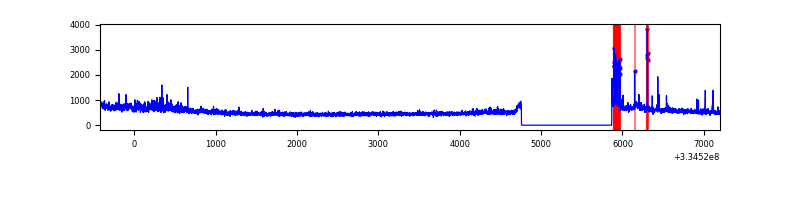 |
| C | 7620 | 6511 | 21 | 21 | 0.28% | 0.32% | 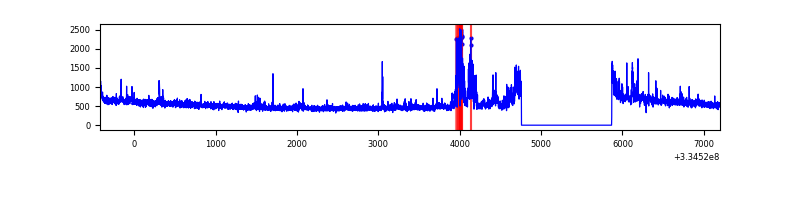 |
| D | 7620 | 6511 | 230 | 230 | 3.02% | 3.53% | 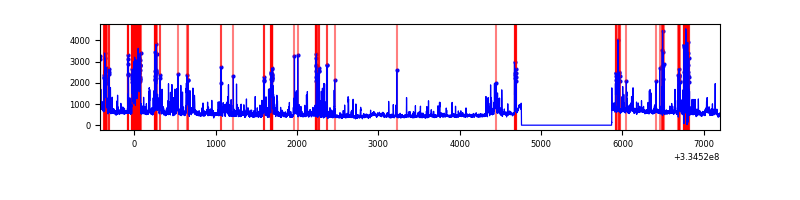 |
Top three noisy pixels from each quadrant. If the there are fewer than three noisy pixels in the level2.evt file, extra rows are filled as -1
| Pixel properties | Quadrant properties | ||||||
|---|---|---|---|---|---|---|---|
| Quadrant | DetID | PixID | Counts | Sigma | Mean | Median | Sigma |
| A | 0 | 13 | 567205 | 3350.34 | 838 | 818 | 169.1 |
| A | 13 | 254 | 11148 | 61.1 | 838 | 818 | 169.1 |
| A | 3 | 137 | 7513 | 39.6 | 838 | 818 | 169.1 |
| B | 5 | 172 | 171996 | 1072.08 | 841 | 822 | 159.7 |
| B | 6 | 203 | 141651 | 882.03 | 841 | 822 | 159.7 |
| B | 12 | 111 | 18161 | 108.6 | 841 | 822 | 159.7 |
| C | 3 | 233 | 256948 | 1341.02 | 820 | 827 | 191.0 |
| C | 0 | 239 | 167599 | 873.2 | 820 | 827 | 191.0 |
| C | 14 | 238 | 131087 | 682.03 | 820 | 827 | 191.0 |
| D | 1 | 52 | 1404441 | 7248.3 | 805 | 787 | 193.7 |
| D | 2 | 234 | 29224 | 146.85 | 805 | 787 | 193.7 |
| D | 13 | 168 | 21157 | 105.19 | 805 | 787 | 193.7 |
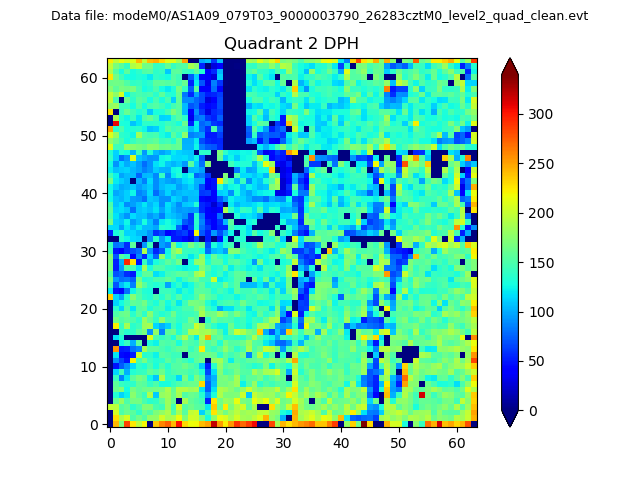
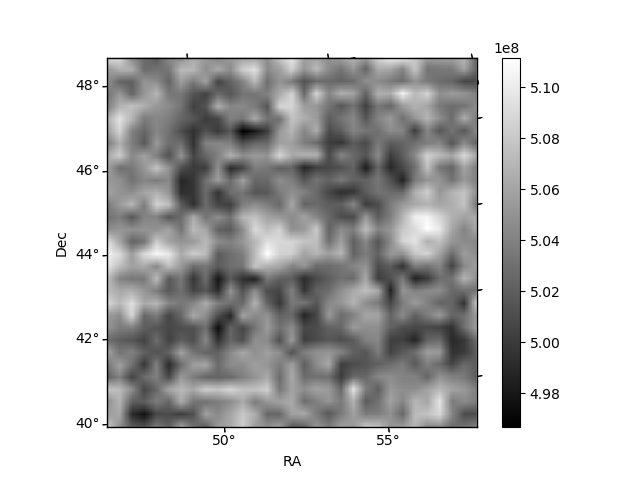
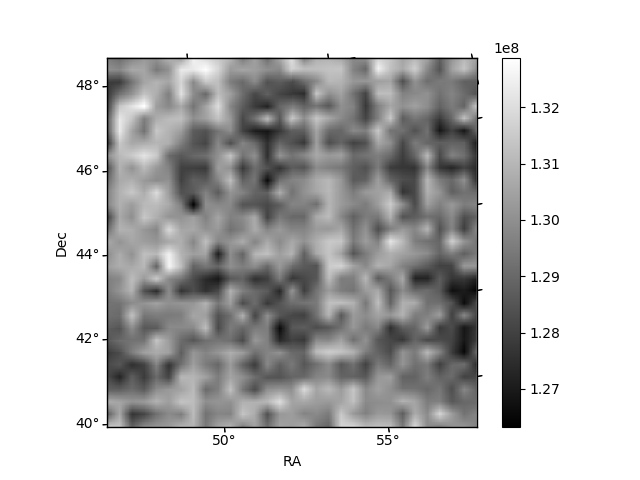
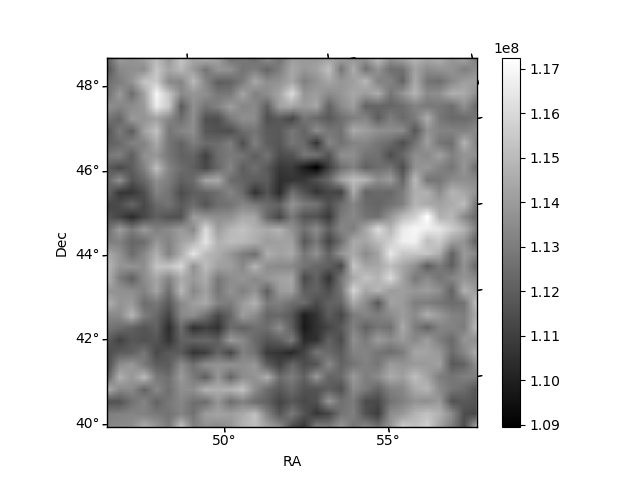
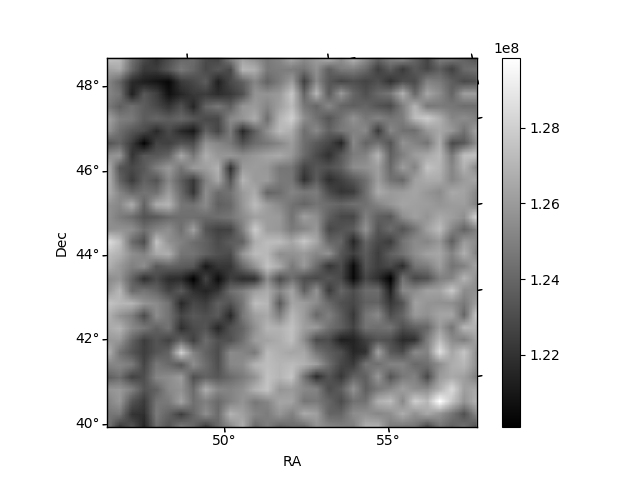
Histogram calculated using DETX and DETY for each event in the final _common_clean file
| Quadrant A | 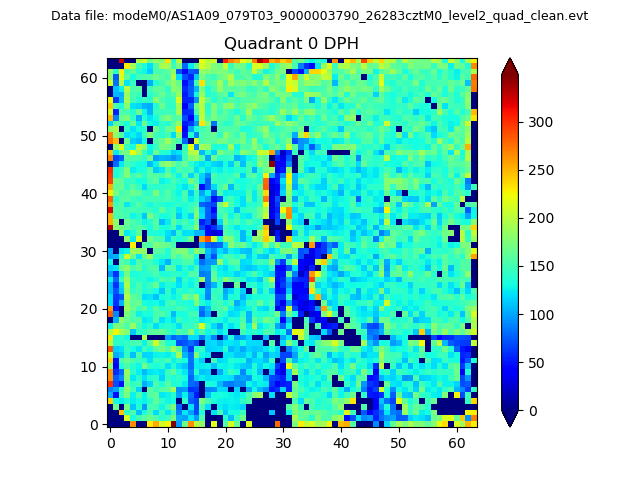 |
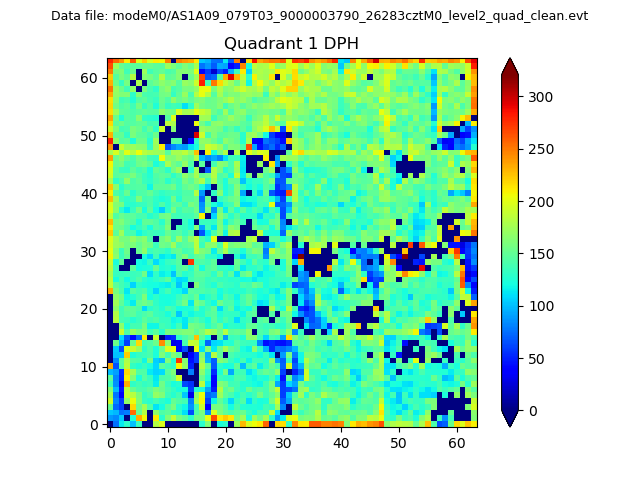 |
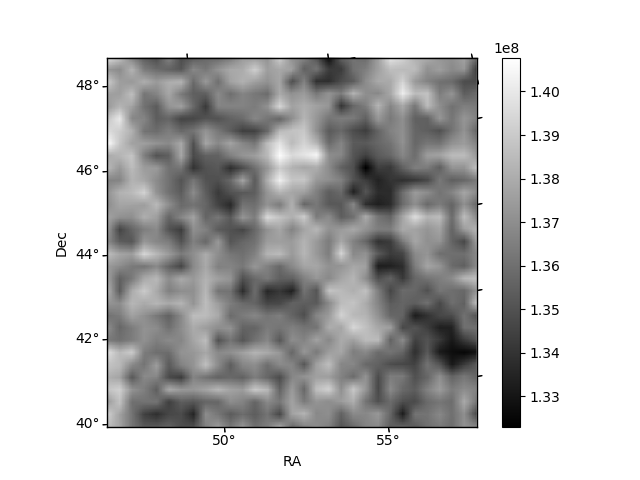
Quadrant B |
|---|---|---|---|
| Quadrant D | 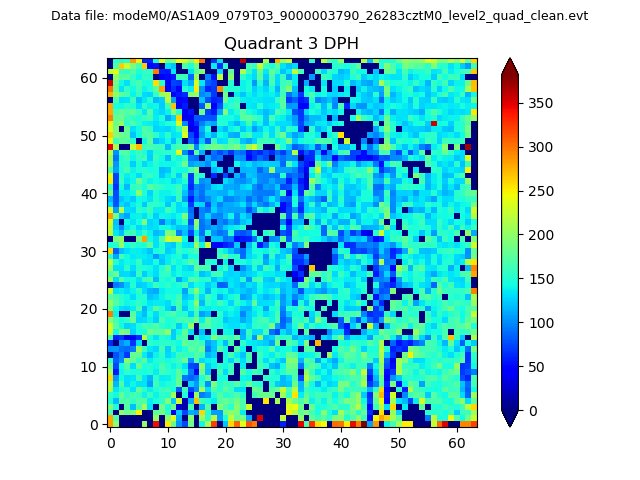 |
 |
Quadrant C |
| Plot type | Count rate plots | Images |
|---|---|---|
| Comparison with Poisson distribution Blue bars denote a histogram of data divided into 1 sec bins. Red curve is a Poisson curve with rate = median count rate of data. |
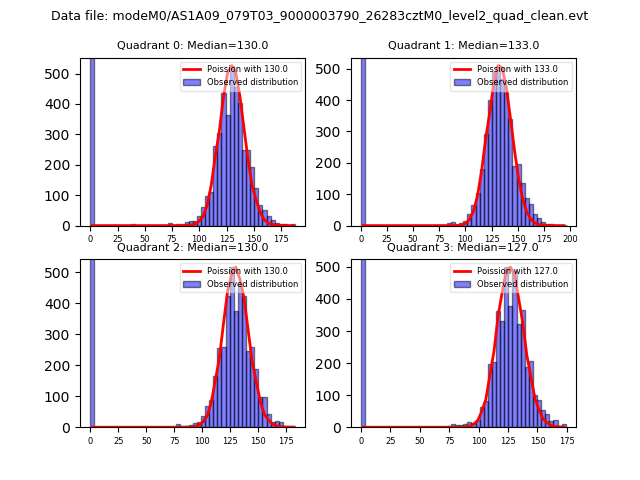 |
 |
| Quadrant-wise count rates Data is divided into 100 sec bins |
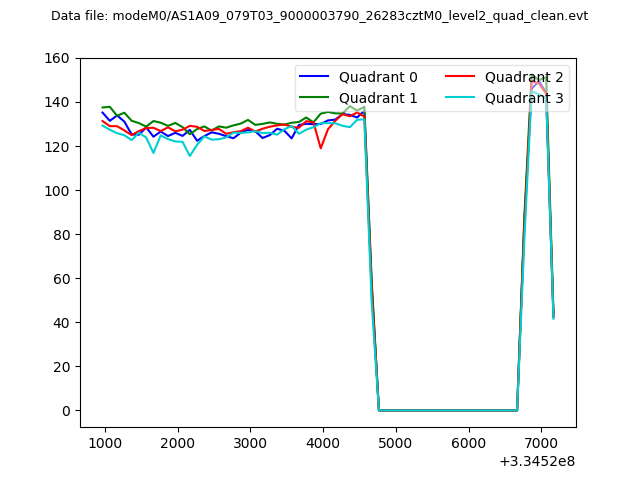 |
|
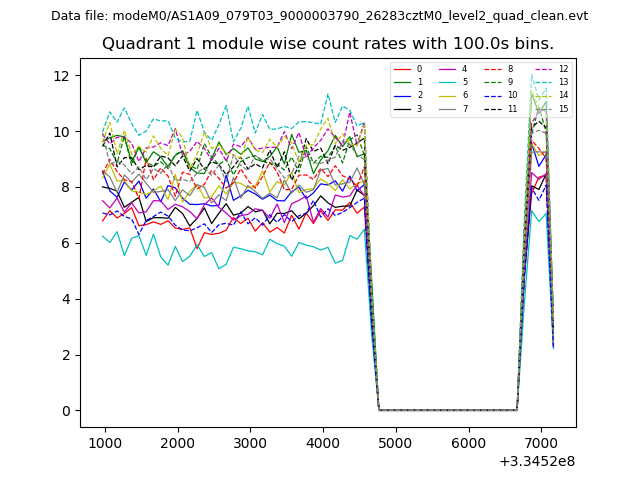
| Module-wise count rates for Quadrant A Data is divided into 100 sec bins |
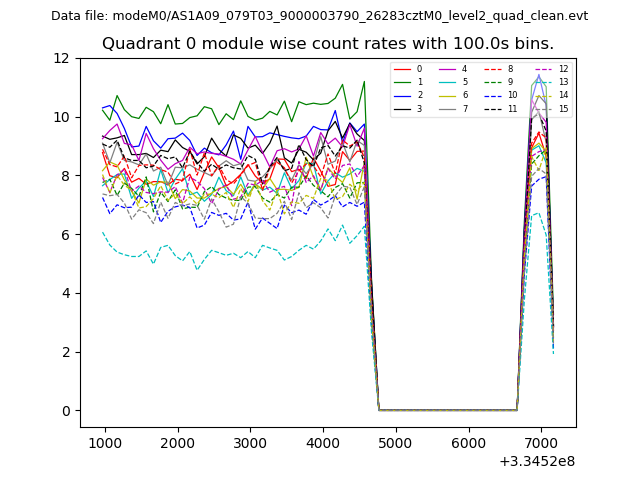 |
 |
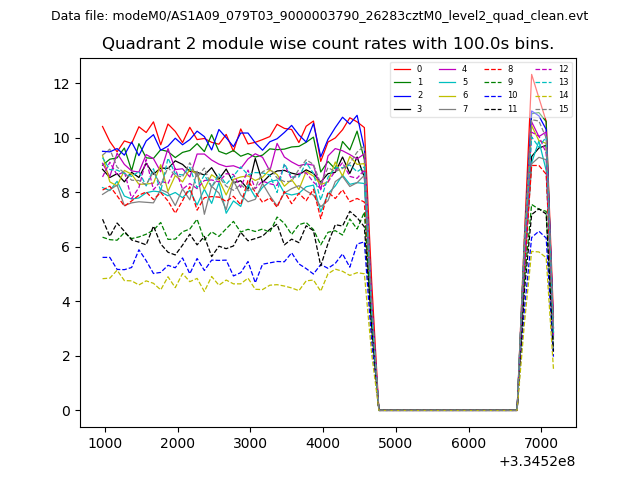
| Module-wise count rates for Quadrant B Data is divided into 100 sec bins |
 |
 |
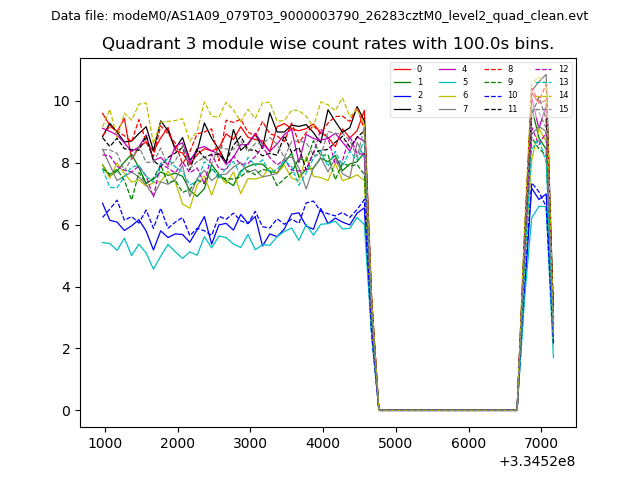
| Module-wise count rates for Quadrant C Data is divided into 100 sec bins |
 |
 |
| Module-wise count rates for Quadrant D Data is divided into 100 sec bins |
 |
 |
| Parameter | Plot |
|---|---|
| CZT HV Monitor | 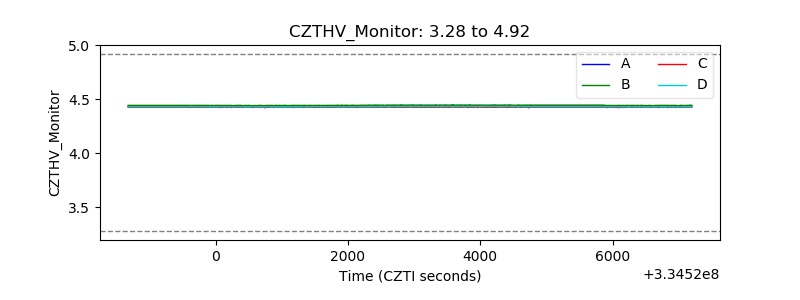 |
| D_VDD | 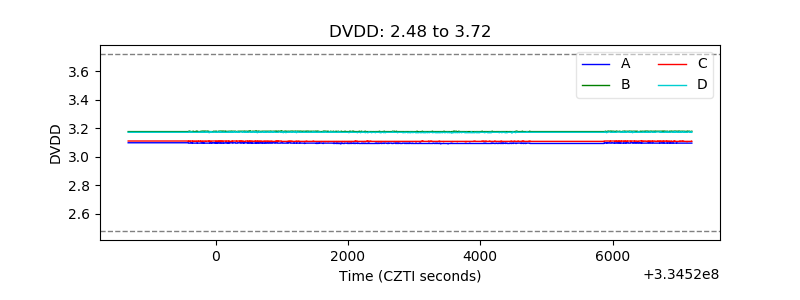 |
| Temperature 1 | 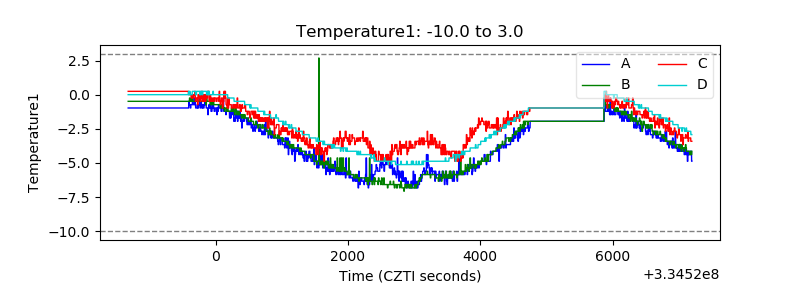 |
| Veto HV Monitor | 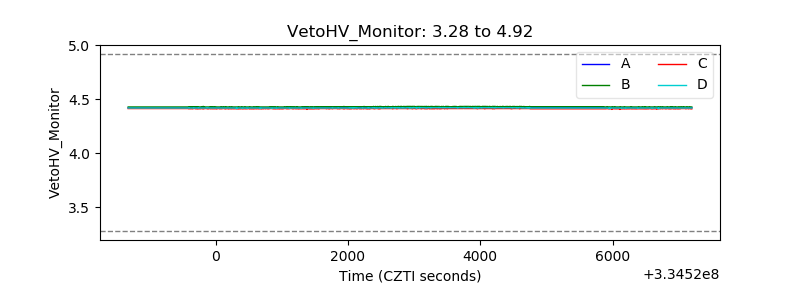 |
| Veto LLD | 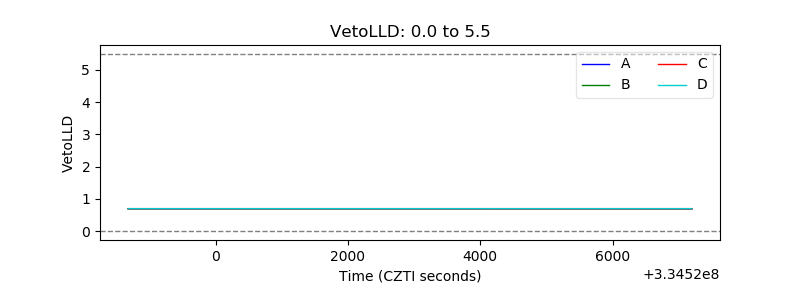 |
| Alpha Counter | 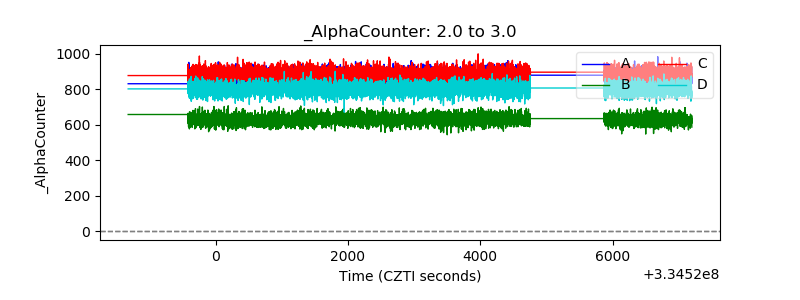 |
| _CPM_Rate | 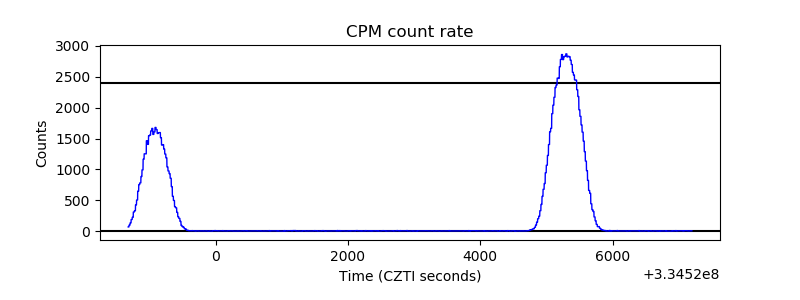 |
| CZT Counter | 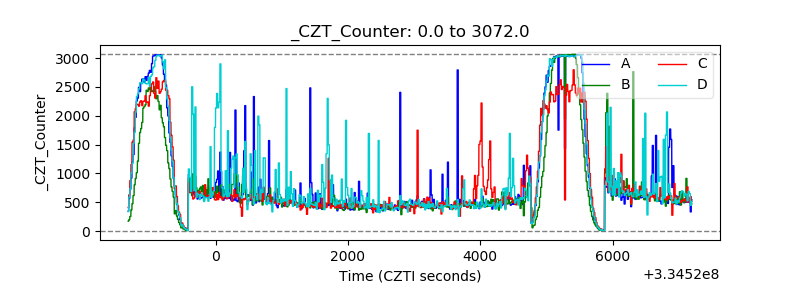 |
| +2.5 Volts monitor | 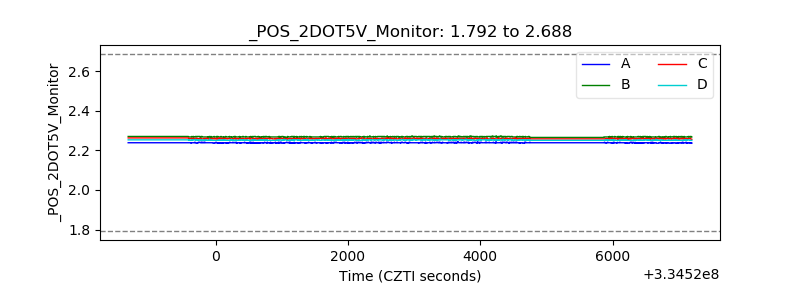 |
| +5 Volts monitor | 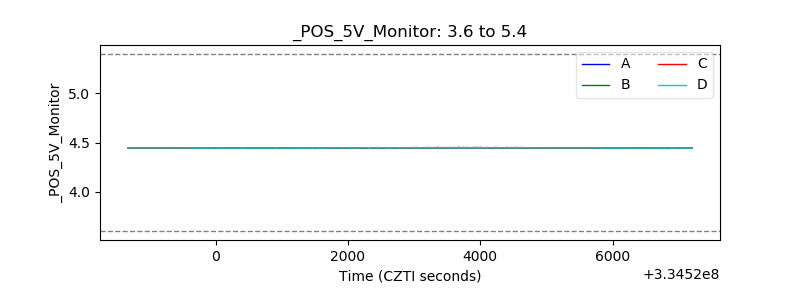 |
| _ROLL_ROT | 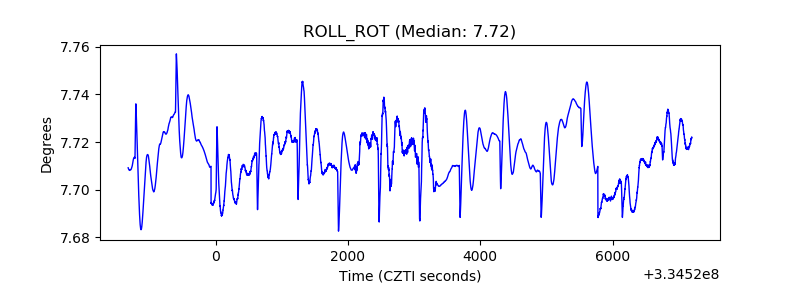 |
| _Roll_DEC | 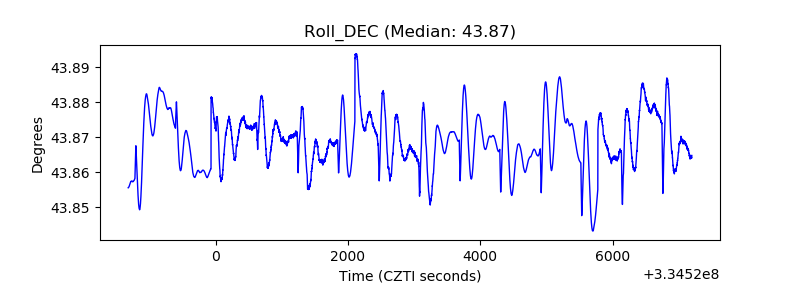 |
| _Roll_RA | 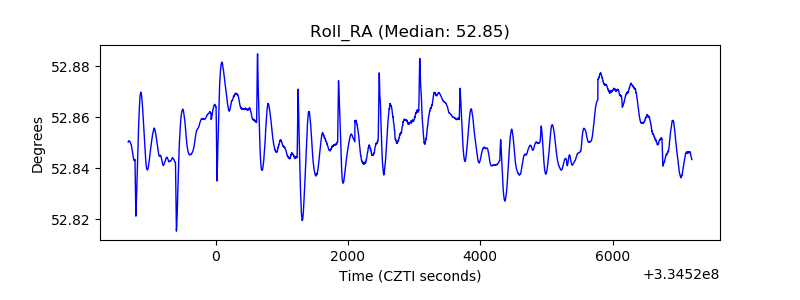 |
| Veto Counter | 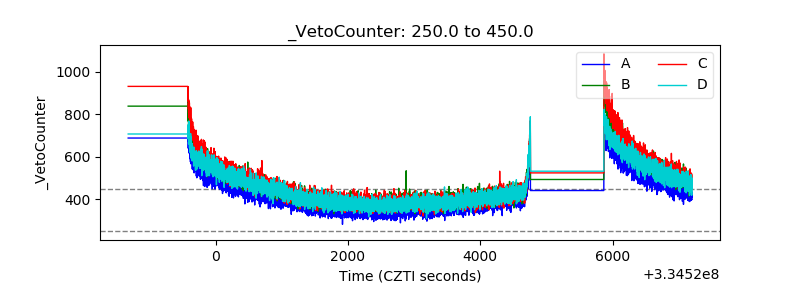 |