| Param | Original file | Final file |
|---|---|---|
| Filename | modeM0/AS1A09_079T03_9000003790_26284cztM0_level2.evt | modeM0/AS1A09_079T03_9000003790_26284cztM0_level2_quad_clean.evt |
| Size (bytes) | 513,990,720 | 94,792,320 |
| Size | 490.2 MB | 90.4 MB |
| Events in quadrant A | 3,638,944 | 602,608 |
| Events in quadrant B | 3,407,854 | 626,899 |
| Events in quadrant C | 3,643,536 | 615,437 |
| Events in quadrant D | 4,453,911 | 591,600 |
| Mode M0 | |||
|---|---|---|---|
| Quadrant | BADHDUFLAG | Total packets | Discarded packets |
| A | 0 | 15114 | 0 |
| B | 0 | 14225 | 0 |
| C | 0 | 14987 | 0 |
| D | 0 | 17543 | 0 |
| Mode M9 | |||
|---|---|---|---|
| Quadrant | BADHDUFLAG | Total packets | Discarded packets |
| A | 0 | 23 | 0 |
| B | 0 | 23 | 0 |
| C | 0 | 23 | 0 |
| D | 0 | 23 | 0 |
| Quadrant | Total seconds | Saturated seconds | Saturation percentage |
|---|---|---|---|
| A | 6215 | 122 | 1.962993% |
| B | 6215 | 122 | 1.962993% |
| C | 6216 | 191 | 3.072716% |
| D | 6216 | 206 | 3.314028% |
Noise dominated data is calculated using 1-second bins in cleaned event files. If a bin has >2000 counts, and if more than 50% of those come from <1% of pixels, then it is considered to be noise-dominated and hence unusable.
| Quadrant | # 1 sec bins | Bins with >0 counts | Bins with >2000 counts | High rate bins dominated by noise | Noise dominated (total time) | Noise dominated (detector-on time) | Marked lightcurve |
|---|---|---|---|---|---|---|---|
| A | 8550 | 6217 | 56 | 56 | 0.65% | 0.90% | 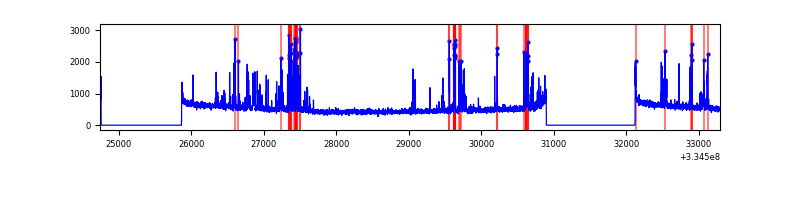 |
| B | 8550 | 6217 | 32 | 32 | 0.37% | 0.51% | 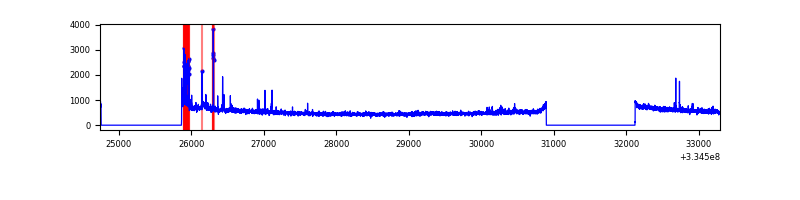 |
| C | 8551 | 6218 | 8 | 8 | 0.09% | 0.13% | 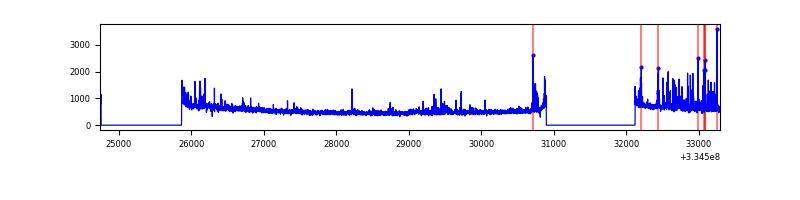 |
| D | 8551 | 6218 | 133 | 133 | 1.56% | 2.14% | 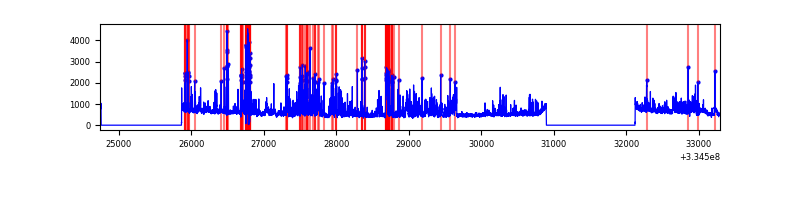 |
Top three noisy pixels from each quadrant. If the there are fewer than three noisy pixels in the level2.evt file, extra rows are filled as -1
| Pixel properties | Quadrant properties | ||||||
|---|---|---|---|---|---|---|---|
| Quadrant | DetID | PixID | Counts | Sigma | Mean | Median | Sigma |
| A | 0 | 13 | 475558 | 2913.31 | 820 | 804 | 163.0 |
| A | 13 | 254 | 10959 | 62.31 | 820 | 804 | 163.0 |
| A | 3 | 137 | 7149 | 38.93 | 820 | 804 | 163.0 |
| B | 5 | 172 | 170215 | 1098.64 | 824 | 804 | 154.2 |
| B | 12 | 111 | 17445 | 107.91 | 824 | 804 | 154.2 |
| B | 0 | 230 | 15485 | 95.2 | 824 | 804 | 154.2 |
| C | 4 | 254 | 210641 | 1129.55 | 808 | 812 | 185.8 |
| C | 3 | 233 | 152067 | 814.23 | 808 | 812 | 185.8 |
| C | 14 | 238 | 128850 | 689.25 | 808 | 812 | 185.8 |
| D | 1 | 52 | 1221145 | 6431.82 | 801 | 784 | 189.7 |
| D | 13 | 168 | 105113 | 549.86 | 801 | 784 | 189.7 |
| D | 2 | 234 | 28641 | 146.82 | 801 | 784 | 189.7 |
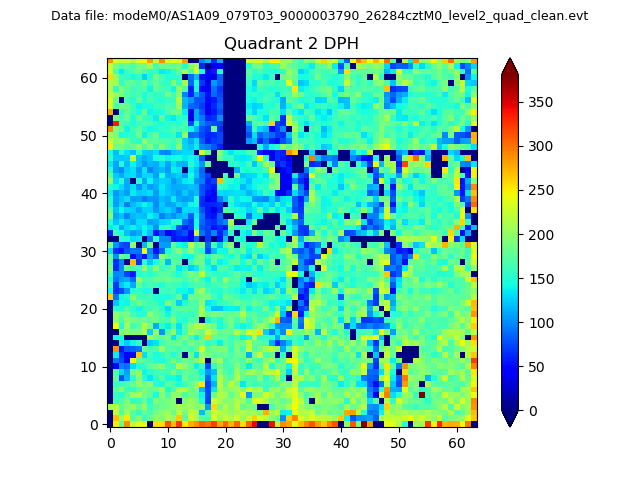
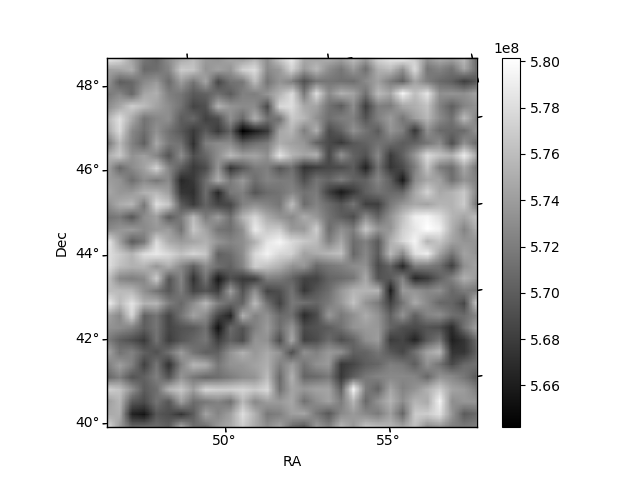
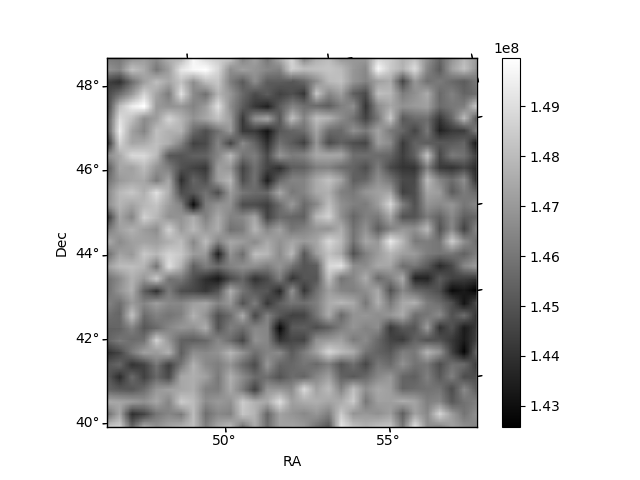
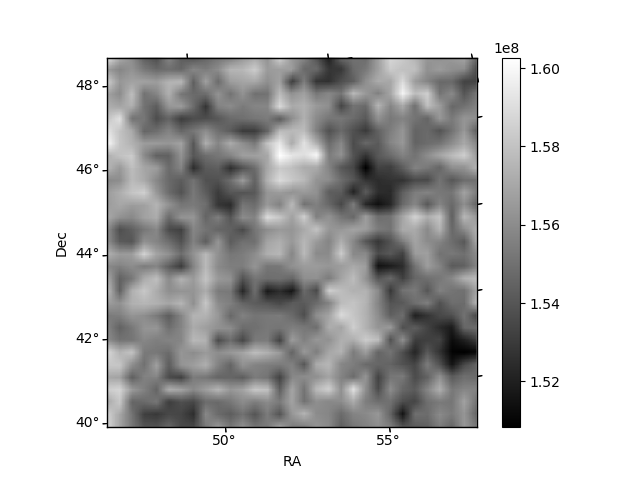
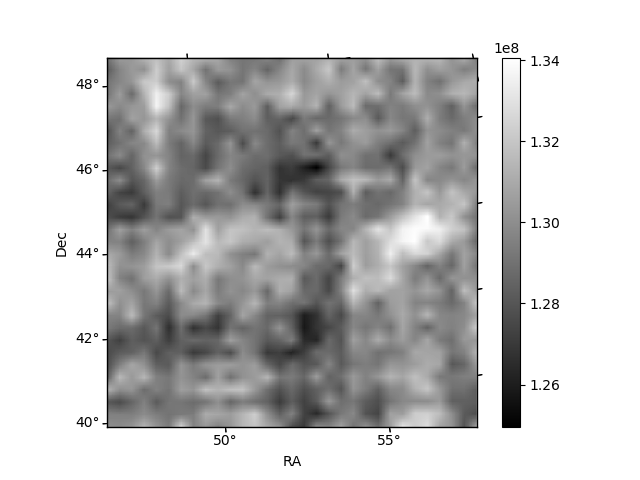
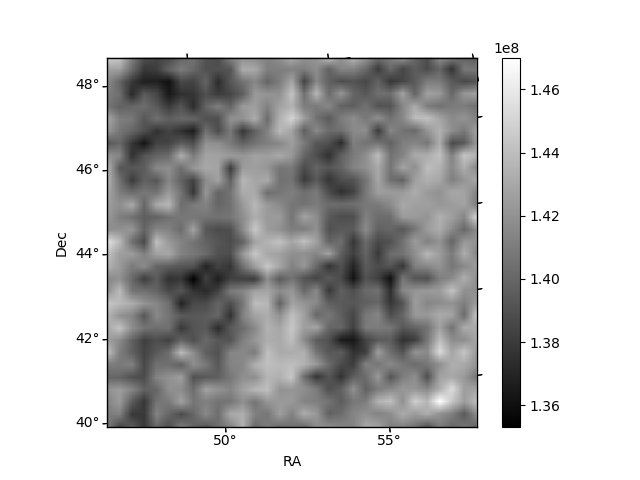
Histogram calculated using DETX and DETY for each event in the final _common_clean file
| Quadrant A | 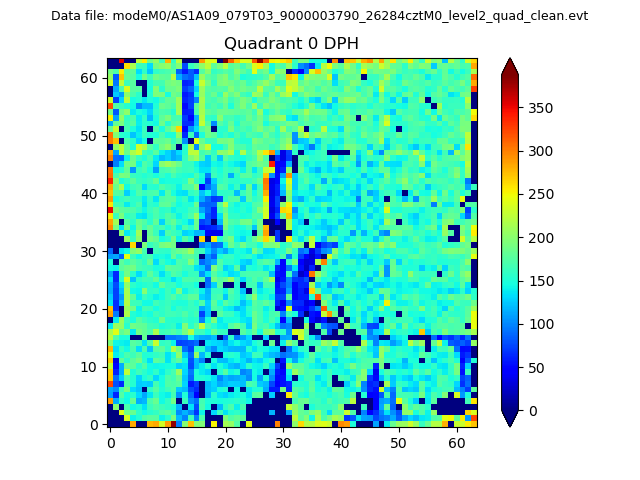 |
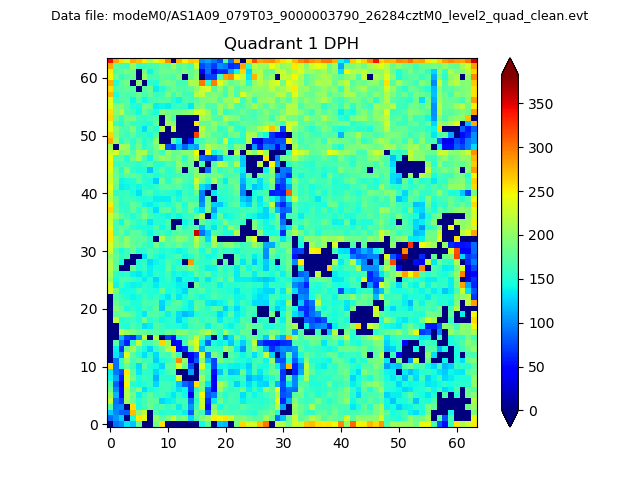 |
Quadrant B |
|---|---|---|---|
| Quadrant D | 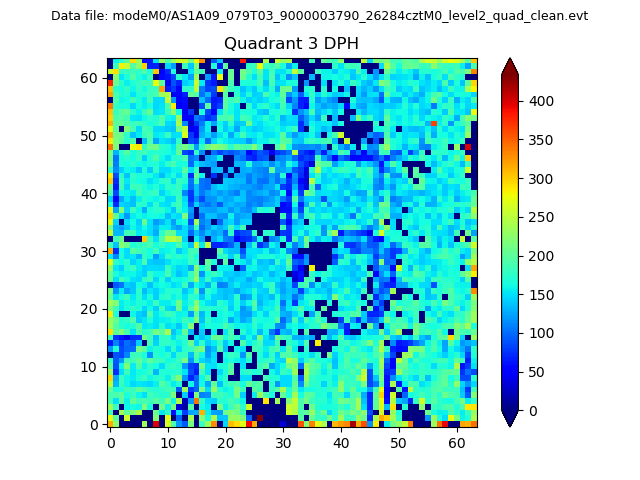 |
 |
Quadrant C |
| Plot type | Count rate plots | Images |
|---|---|---|
| Comparison with Poisson distribution Blue bars denote a histogram of data divided into 1 sec bins. Red curve is a Poisson curve with rate = median count rate of data. |
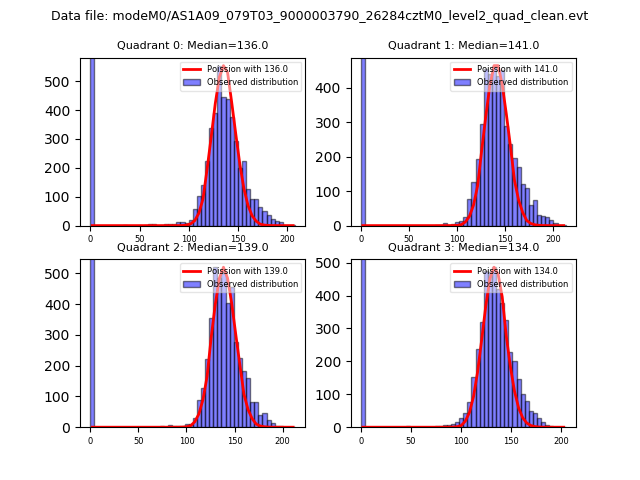 |
 |
| Quadrant-wise count rates Data is divided into 100 sec bins |
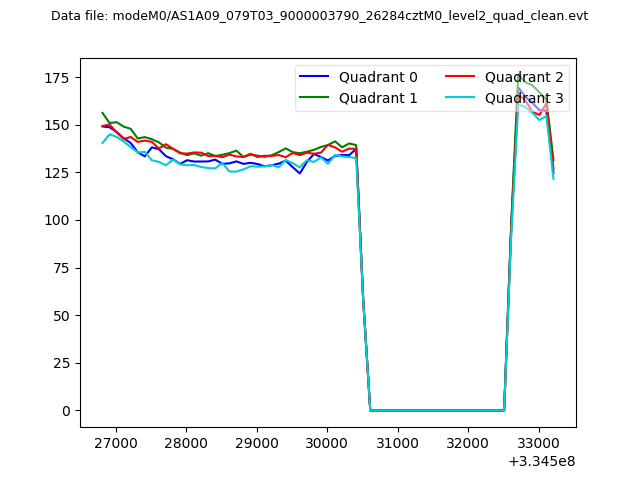 |
|
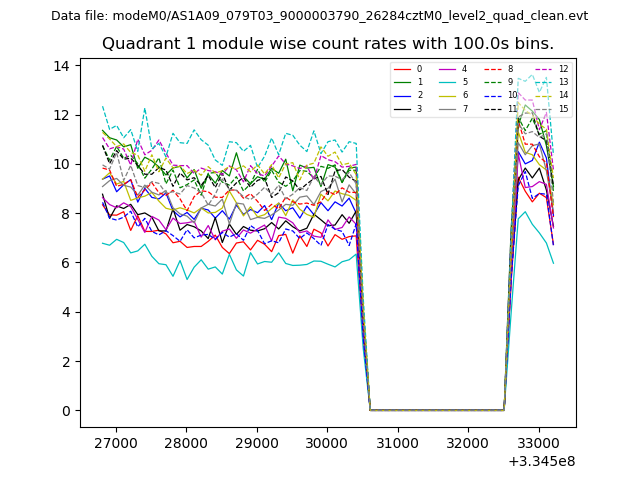
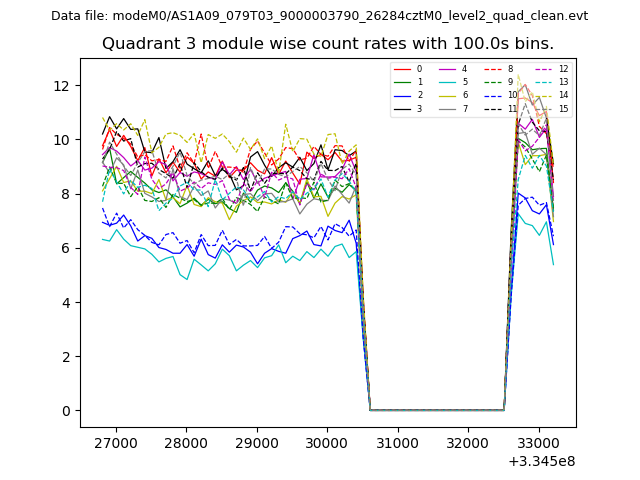
| Module-wise count rates for Quadrant A Data is divided into 100 sec bins |
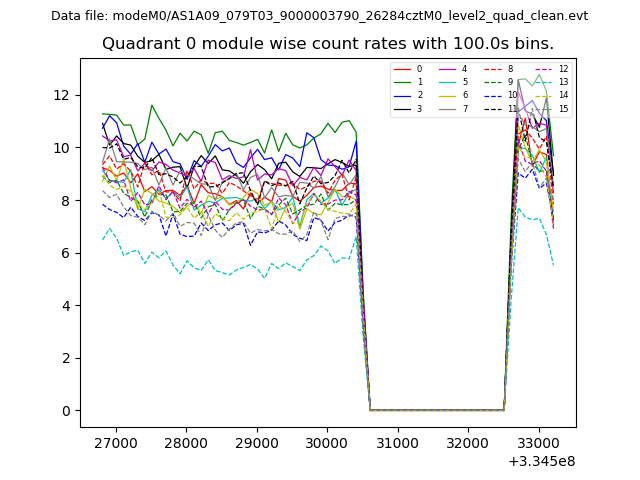 |
 |
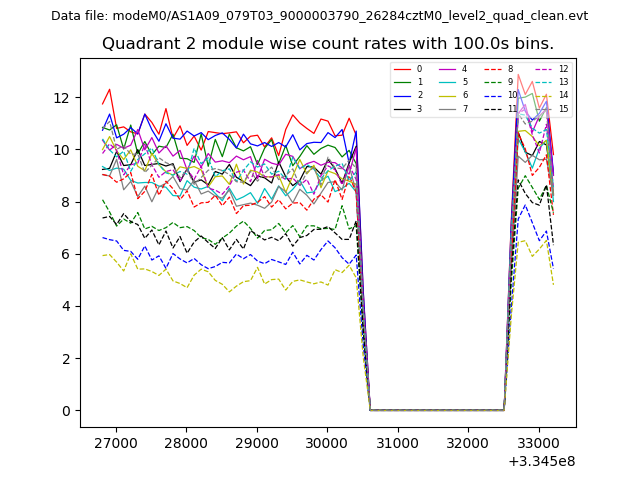
| Module-wise count rates for Quadrant B Data is divided into 100 sec bins |
 |
 |
| Module-wise count rates for Quadrant C Data is divided into 100 sec bins |
 |
 |
| Module-wise count rates for Quadrant D Data is divided into 100 sec bins |
 |
 |
| Parameter | Plot |
|---|---|
| CZT HV Monitor | 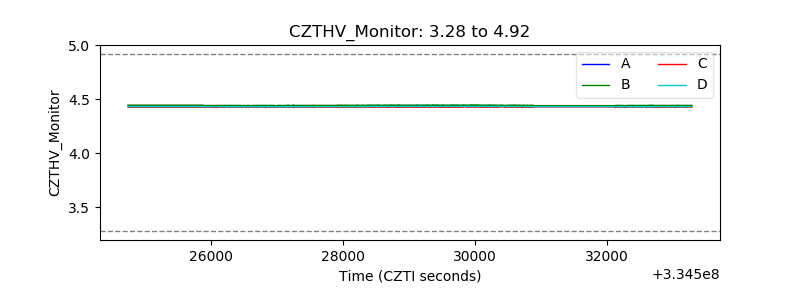 |
| D_VDD | 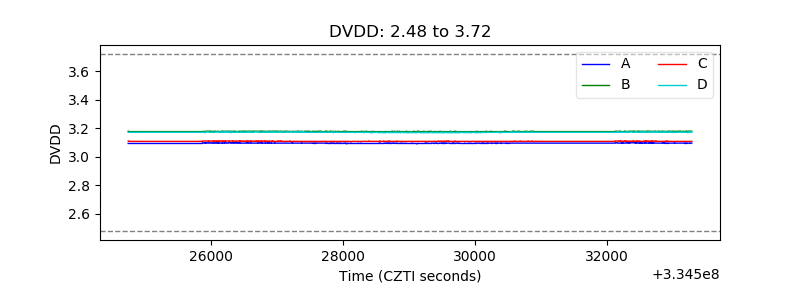 |
| Temperature 1 | 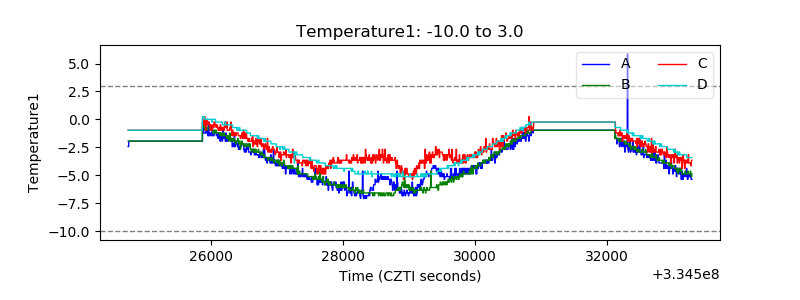 |
| Veto HV Monitor | 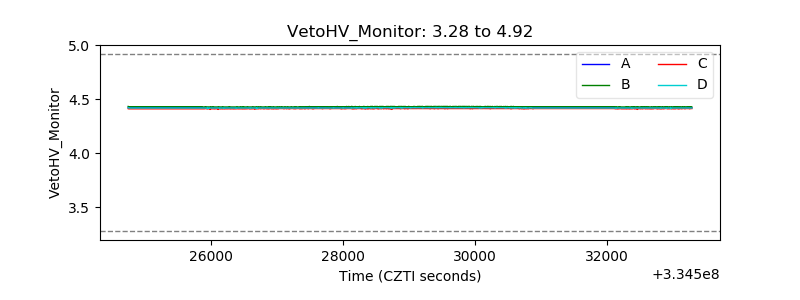 |
| Veto LLD | 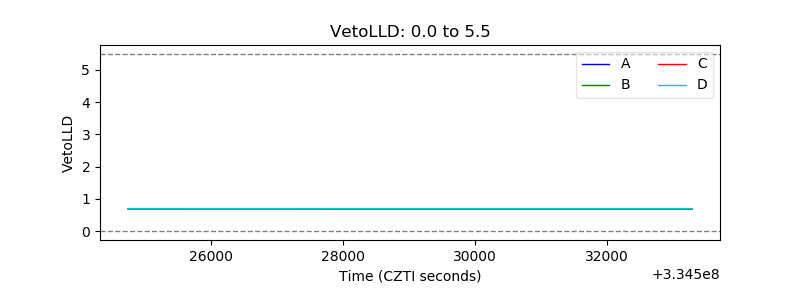 |
| Alpha Counter | 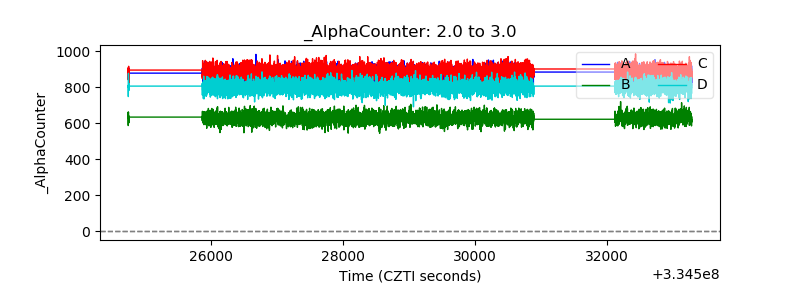 |
| _CPM_Rate | 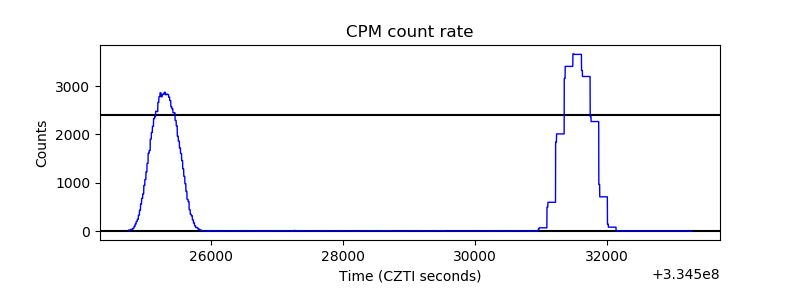 |
| CZT Counter | 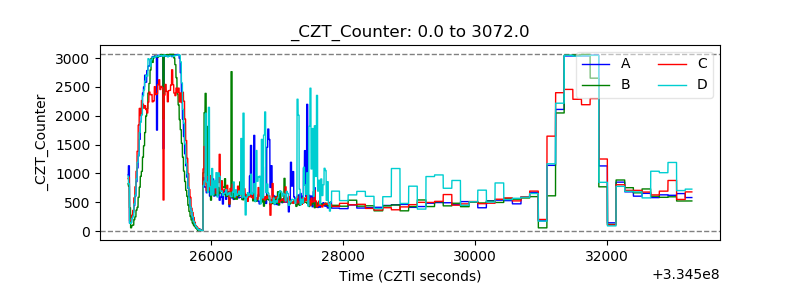 |
| +2.5 Volts monitor | 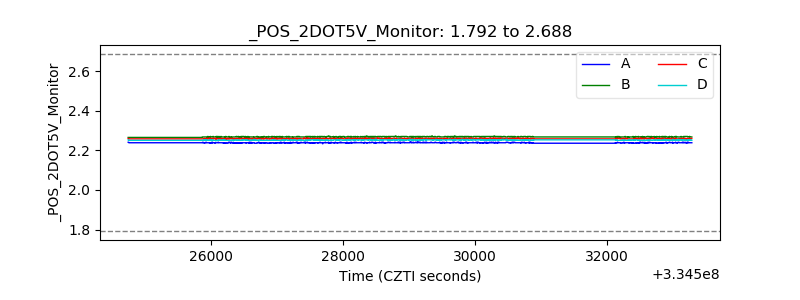 |
| +5 Volts monitor |  |
| _ROLL_ROT | 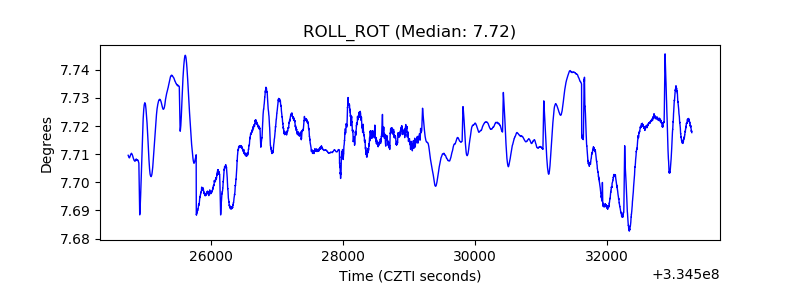 |
| _Roll_DEC | 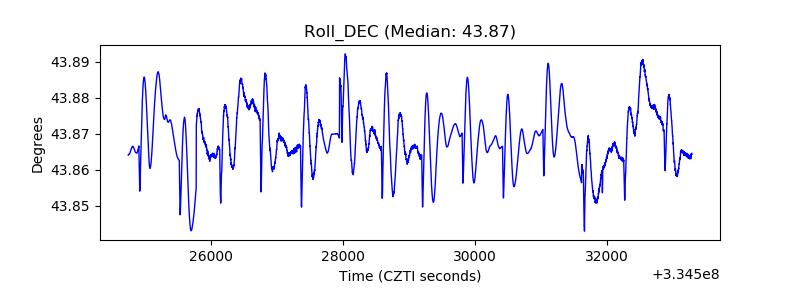 |
| _Roll_RA | 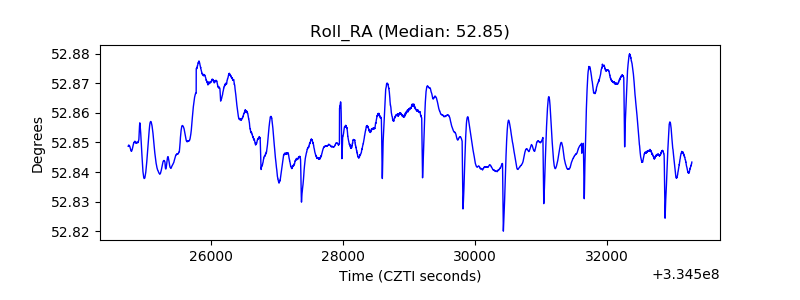 |
| Veto Counter | 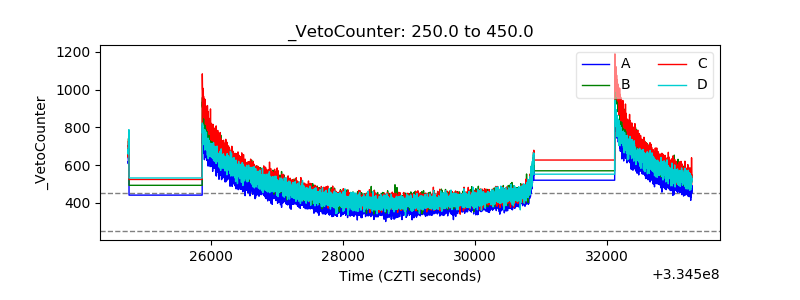 |