| Param | Original file | Final file |
|---|---|---|
| Filename | modeM0/AS1A09_079T03_9000003790_26285cztM0_level2.evt | modeM0/AS1A09_079T03_9000003790_26285cztM0_level2_quad_clean.evt |
| Size (bytes) | 386,190,720 | 81,832,320 |
| Size | 368.3 MB | 78.0 MB |
| Events in quadrant A | 2,847,855 | 527,001 |
| Events in quadrant B | 2,469,706 | 553,547 |
| Events in quadrant C | 3,020,168 | 536,549 |
| Events in quadrant D | 3,029,252 | 521,832 |
| Mode M0 | |||
|---|---|---|---|
| Quadrant | BADHDUFLAG | Total packets | Discarded packets |
| A | 0 | 11627 | 0 |
| B | 0 | 10415 | 0 |
| C | 0 | 12119 | 0 |
| D | 0 | 12218 | 0 |
| Mode M9 | |||
|---|---|---|---|
| Quadrant | BADHDUFLAG | Total packets | Discarded packets |
| A | 0 | 12 | 0 |
| B | 0 | 12 | 0 |
| C | 0 | 12 | 0 |
| D | 0 | 12 | 0 |
| Quadrant | Total seconds | Saturated seconds | Saturation percentage |
|---|---|---|---|
| A | 4830 | 109 | 2.256729% |
| B | 4830 | 28 | 0.579710% |
| C | 4830 | 182 | 3.768116% |
| D | 4830 | 97 | 2.008282% |
Noise dominated data is calculated using 1-second bins in cleaned event files. If a bin has >2000 counts, and if more than 50% of those come from <1% of pixels, then it is considered to be noise-dominated and hence unusable.
| Quadrant | # 1 sec bins | Bins with >0 counts | Bins with >2000 counts | High rate bins dominated by noise | Noise dominated (total time) | Noise dominated (detector-on time) | Marked lightcurve |
|---|---|---|---|---|---|---|---|
| A | 6055 | 4831 | 60 | 60 | 0.99% | 1.24% | 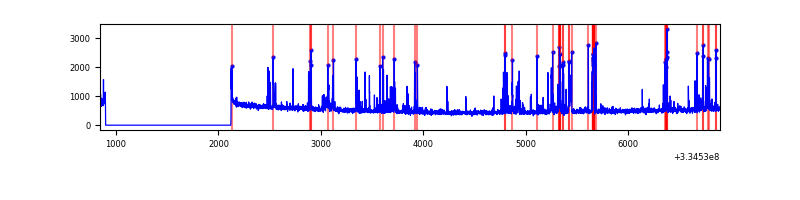 |
| B | 6055 | 4831 | 0 | 0 | 0.00% | 0.00% | 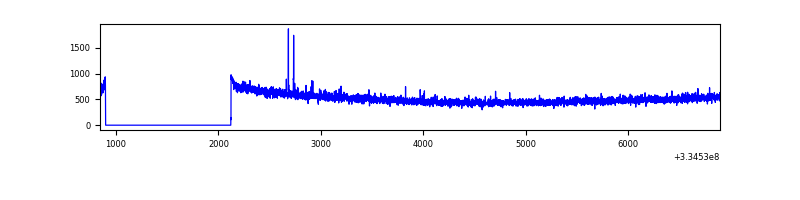 |
| C | 6055 | 4831 | 69 | 69 | 1.14% | 1.43% | 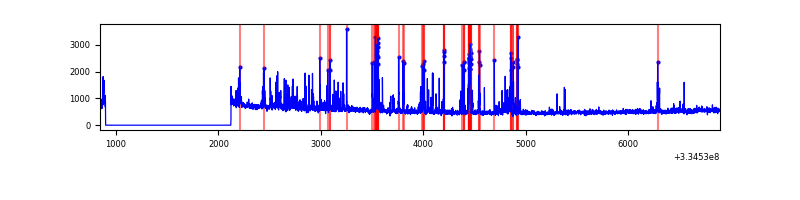 |
| D | 6055 | 4831 | 80 | 80 | 1.32% | 1.66% | 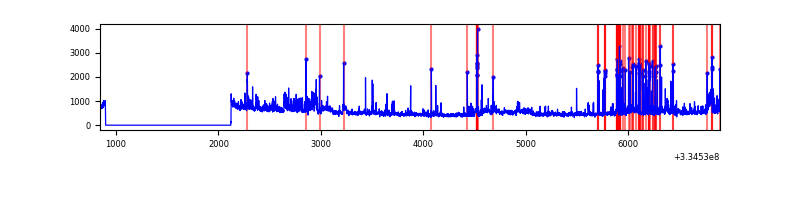 |
Top three noisy pixels from each quadrant. If the there are fewer than three noisy pixels in the level2.evt file, extra rows are filled as -1
| Pixel properties | Quadrant properties | ||||||
|---|---|---|---|---|---|---|---|
| Quadrant | DetID | PixID | Counts | Sigma | Mean | Median | Sigma |
| A | 0 | 13 | 450071 | 3649.95 | 620 | 609 | 123.1 |
| A | 13 | 254 | 8744 | 66.06 | 620 | 609 | 123.1 |
| A | 3 | 137 | 5511 | 39.81 | 620 | 609 | 123.1 |
| B | 12 | 111 | 13342 | 106.86 | 630 | 616 | 119.1 |
| B | 11 | 111 | 11723 | 93.26 | 630 | 616 | 119.1 |
| B | 14 | 111 | 10301 | 81.32 | 630 | 616 | 119.1 |
| C | 4 | 254 | 510233 | 3593.75 | 610 | 616 | 141.8 |
| C | 14 | 238 | 98261 | 688.58 | 610 | 616 | 141.8 |
| C | 3 | 233 | 30887 | 213.47 | 610 | 616 | 141.8 |
| D | 1 | 52 | 590163 | 4069.02 | 610 | 596 | 144.9 |
| D | 6 | 17 | 71993 | 492.76 | 610 | 596 | 144.9 |
| D | 11 | 176 | 32827 | 222.45 | 610 | 596 | 144.9 |
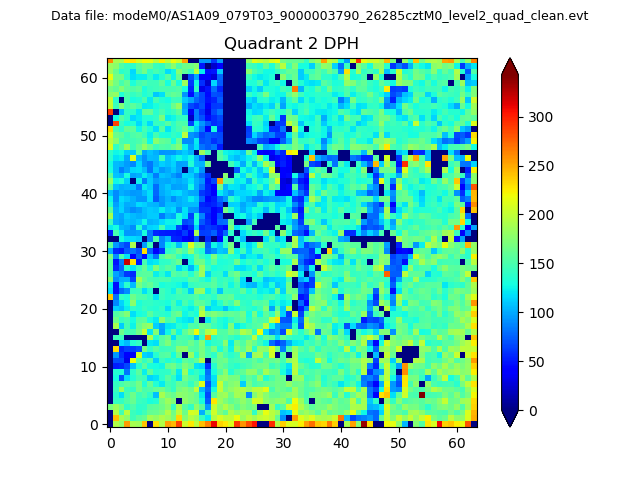
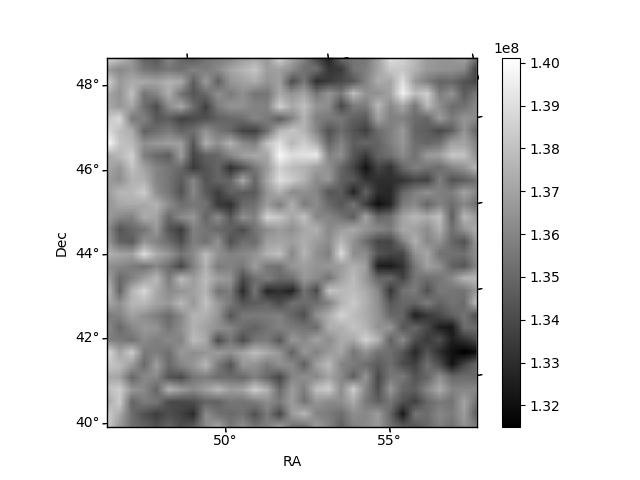
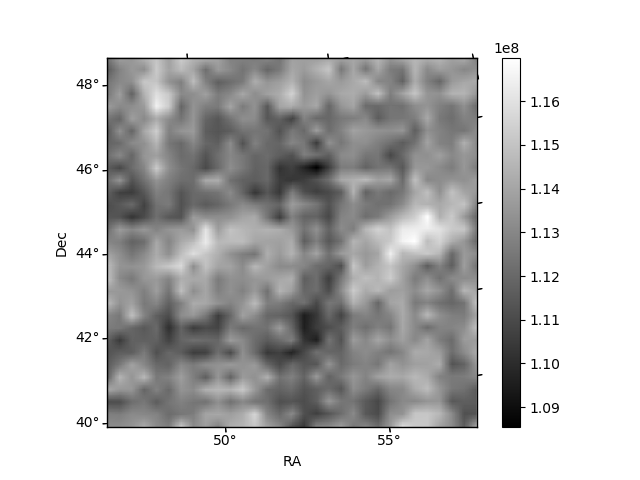
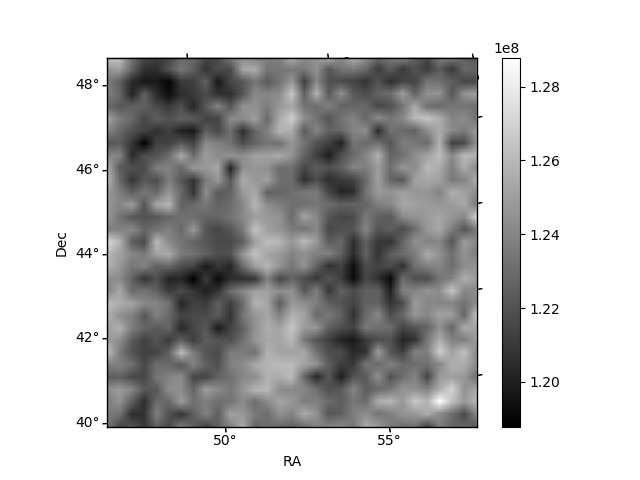
Histogram calculated using DETX and DETY for each event in the final _common_clean file
| Quadrant A | 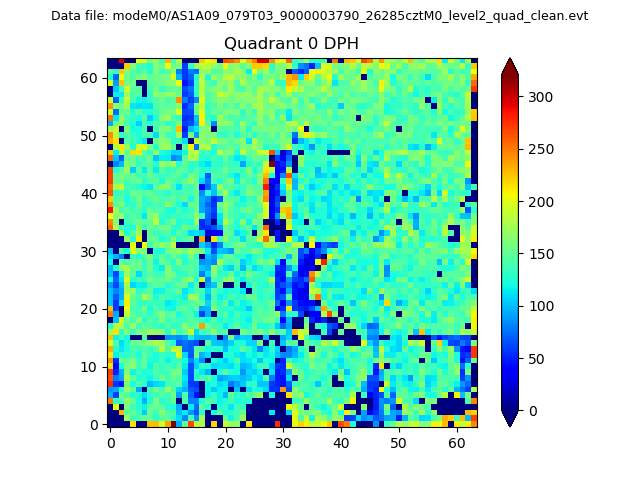 |
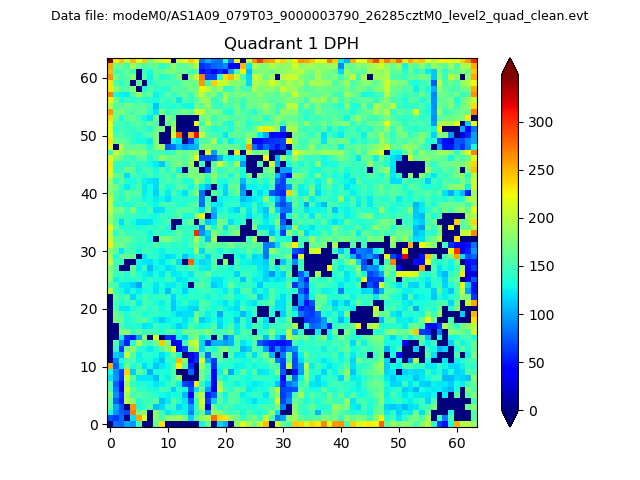 |
Quadrant B |
|---|---|---|---|
| Quadrant D | 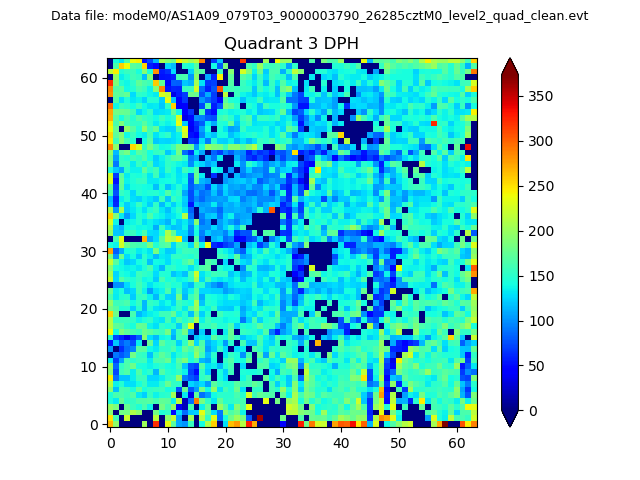 |
 |
Quadrant C |
| Plot type | Count rate plots | Images |
|---|---|---|
| Comparison with Poisson distribution Blue bars denote a histogram of data divided into 1 sec bins. Red curve is a Poisson curve with rate = median count rate of data. |
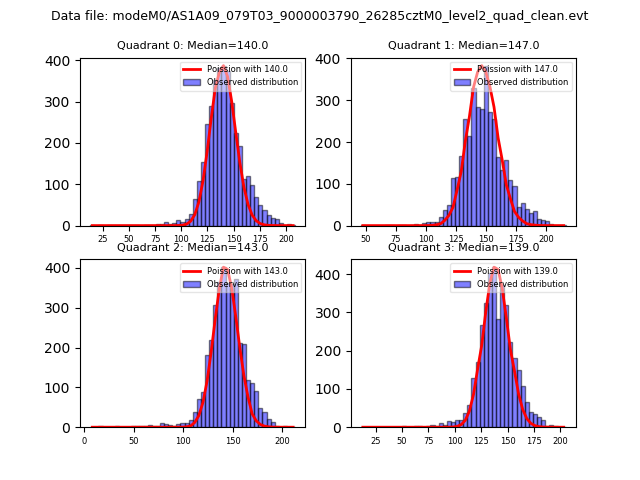 |
 |
| Quadrant-wise count rates Data is divided into 100 sec bins |
 |
|
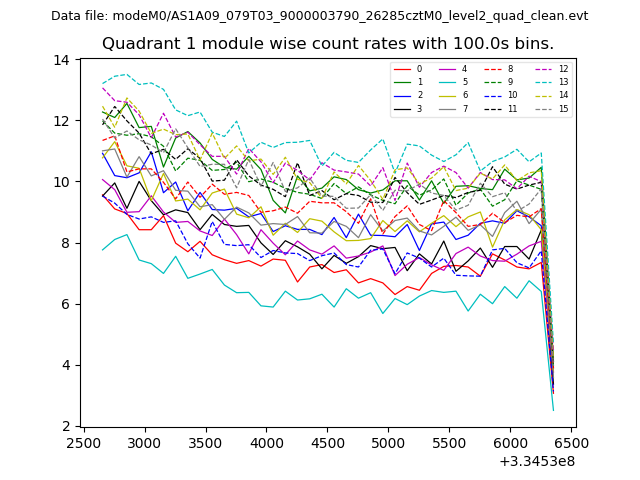
| Module-wise count rates for Quadrant A Data is divided into 100 sec bins |
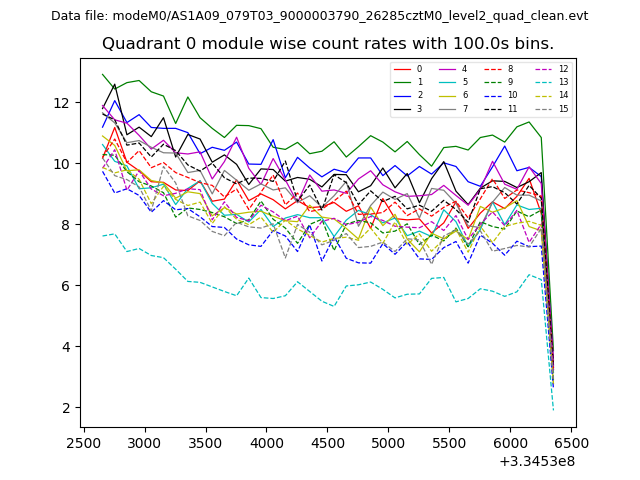 |
 |
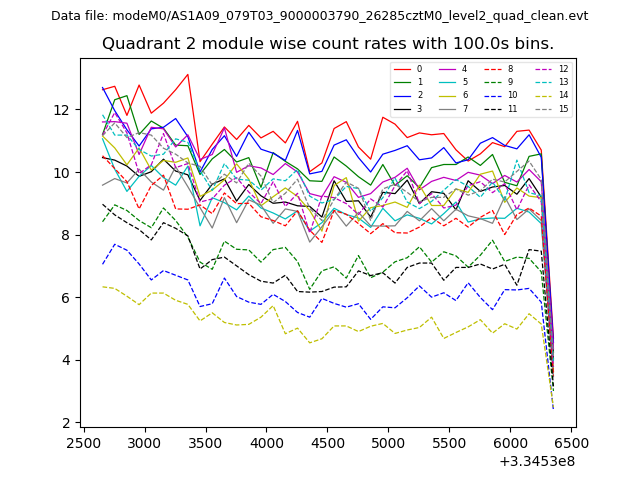
| Module-wise count rates for Quadrant B Data is divided into 100 sec bins |
 |
 |
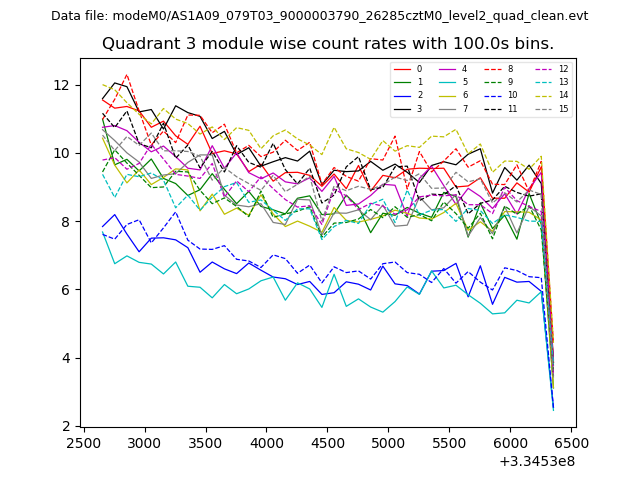
| Module-wise count rates for Quadrant C Data is divided into 100 sec bins |
 |
 |
| Module-wise count rates for Quadrant D Data is divided into 100 sec bins |
 |
 |
| Parameter | Plot |
|---|---|
| CZT HV Monitor | 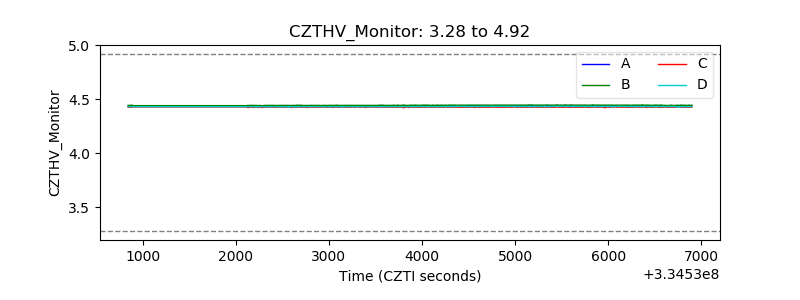 |
| D_VDD | 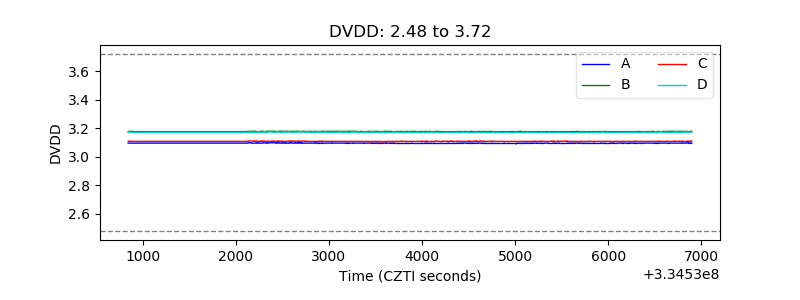 |
| Temperature 1 | 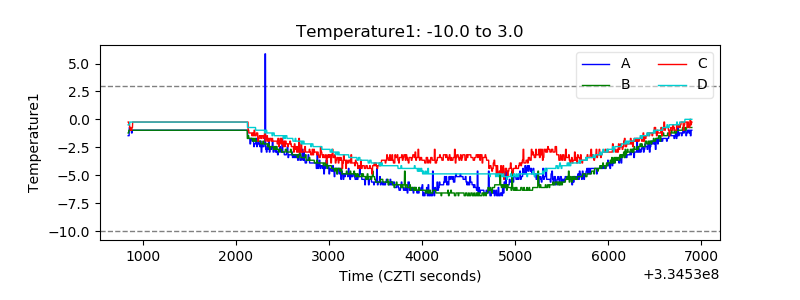 |
| Veto HV Monitor | 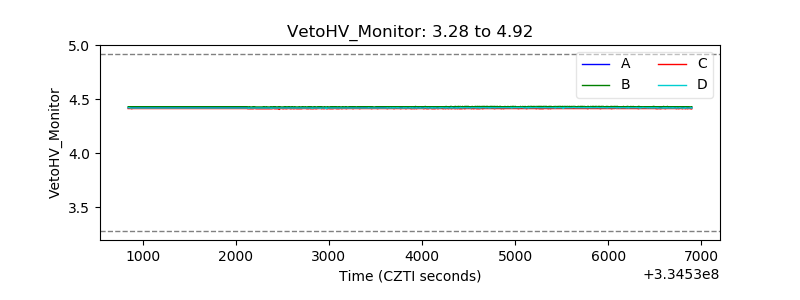 |
| Veto LLD | 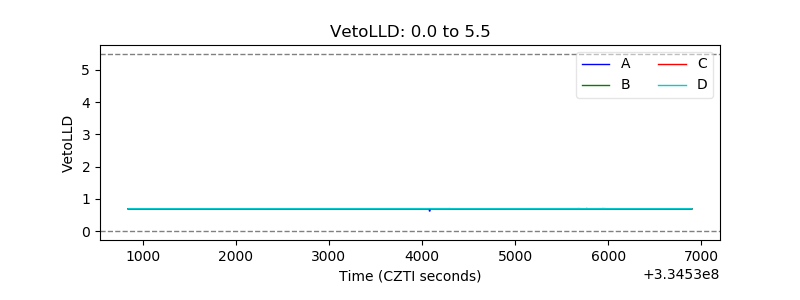 |
| Alpha Counter | 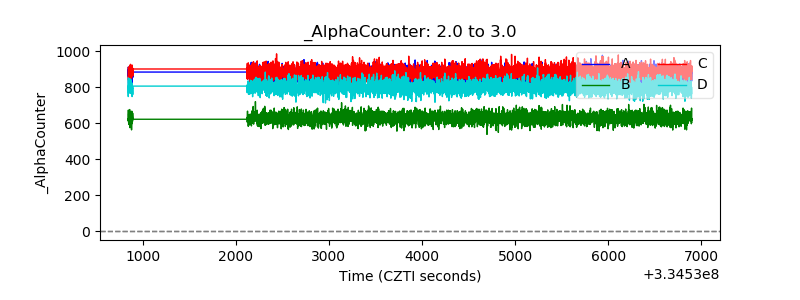 |
| _CPM_Rate | 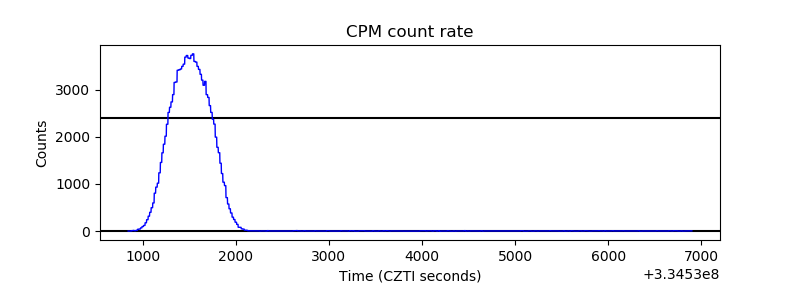 |
| CZT Counter | 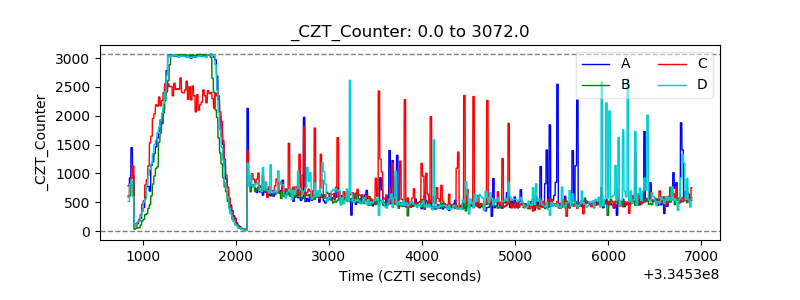 |
| +2.5 Volts monitor |  |
| +5 Volts monitor |  |
| _ROLL_ROT | 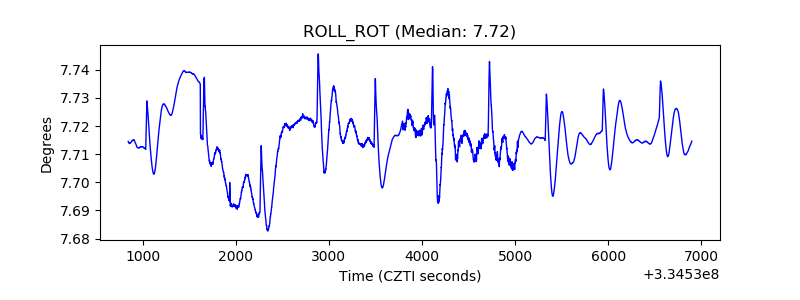 |
| _Roll_DEC | 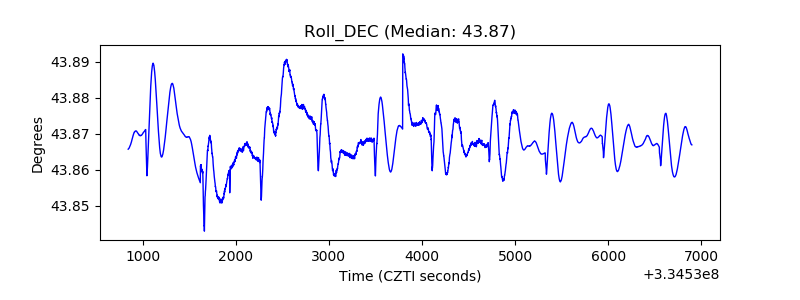 |
| _Roll_RA | 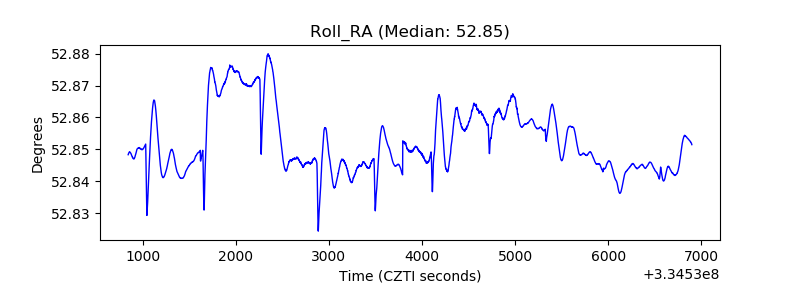 |
| Veto Counter | 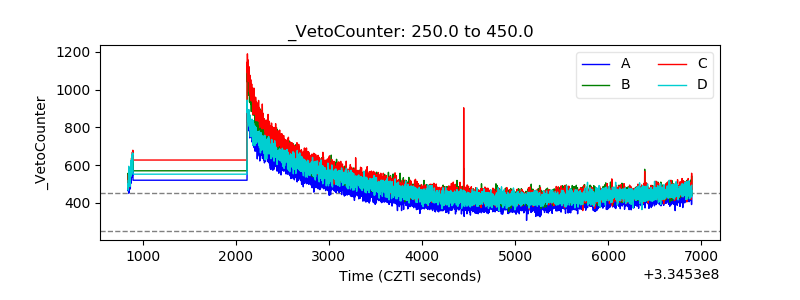 |