| Param | Original file | Final file |
|---|---|---|
| Filename | modeM0/AS1A09_044T01_9000003792cztM0_level2.fits | modeM0/AS1A09_044T01_9000003792cztM0_level2_quad_clean.evt |
| Size (bytes) | 398,344,320 | 324,316,800 |
| Size | 379.9 MB | 309.3 MB |
| Events in quadrant A | 2,481,170 | 1,900,642 |
| Events in quadrant B | 2,412,526 | 1,936,866 |
| Events in quadrant C | 2,431,216 | 1,853,968 |
| Events in quadrant D | 1,995,004 | 1,387,675 |
| Mode M0 | |||
|---|---|---|---|
| Quadrant | BADHDUFLAG | Total packets | Discarded packets |
| A | 0 | 87517 | 0 |
| B | 0 | 83032 | 0 |
| C | 0 | 90680 | 0 |
| D | 0 | 135261 | 0 |
| Mode SS | |||
|---|---|---|---|
| Quadrant | BADHDUFLAG | Total packets | Discarded packets |
| A | 0 | 812 | 0 |
| B | 0 | 812 | 0 |
| C | 0 | 812 | 0 |
| D | 0 | 812 | 0 |
| Mode M9 | |||
|---|---|---|---|
| Quadrant | BADHDUFLAG | Total packets | Discarded packets |
| A | 0 | 57 | 0 |
| B | 0 | 57 | 0 |
| C | 0 | 57 | 0 |
| D | 0 | 57 | 0 |
| Quadrant | Total seconds | Saturated seconds | Saturation percentage |
|---|---|---|---|
| A | 39923 | 745 | 1.866092% |
| B | 39922 | 596 | 1.492911% |
| C | 39923 | 1619 | 4.055306% |
| D | 39923 | 5667 | 14.194825% |
Noise dominated data is calculated using 1-second bins in cleaned event files. If a bin has >2000 counts, and if more than 50% of those come from <1% of pixels, then it is considered to be noise-dominated and hence unusable.
| Quadrant | # 1 sec bins | Bins with >0 counts | Bins with >2000 counts | High rate bins dominated by noise | Noise dominated (total time) | Noise dominated (detector-on time) | Marked lightcurve |
|---|---|---|---|---|---|---|---|
| A | 45609 | 39924 | 0 | 0 | 0.00% | 0.00% |  |
| B | 45609 | 39924 | 0 | 0 | 0.00% | 0.00% |  |
| C | 45609 | 39900 | 0 | 0 | 0.00% | 0.00% |  |
| D | 45609 | 39836 | 0 | 0 | 0.00% | 0.00% |  |
Top three noisy pixels from each quadrant. If the there are fewer than three noisy pixels in the level2.evt file, extra rows are filled as -1
| Pixel properties | Quadrant properties | ||||||
|---|---|---|---|---|---|---|---|
| Quadrant | DetID | PixID | Counts | Sigma | Mean | Median | Sigma |
| A | 0 | 29 | 2038 | 8.95 | 646 | 606 | 160.0 |
| A | 7 | 110 | 2002 | 8.72 | 646 | 606 | 160.0 |
| A | 9 | 19 | 1897 | 8.07 | 646 | 606 | 160.0 |
| B | 2 | 9 | 1920 | 10.49 | 637 | 609 | 125.0 |
| B | 5 | 128 | 1639 | 8.24 | 637 | 609 | 125.0 |
| B | 5 | 232 | 1613 | 8.03 | 637 | 609 | 125.0 |
| C | 12 | 241 | 1698 | 6.76 | 643 | 604 | 161.9 |
| C | 3 | 126 | 1676 | 6.62 | 643 | 604 | 161.9 |
| C | 2 | 191 | 1660 | 6.52 | 643 | 604 | 161.9 |
| D | 7 | 3 | 1428 | 6.07 | 568 | 518 | 150.0 |
| D | 6 | 231 | 1408 | 5.93 | 568 | 518 | 150.0 |
| D | 10 | 189 | 1397 | 5.86 | 568 | 518 | 150.0 |
Histogram calculated using DETX and DETY for each event in the final _common_clean file
| Quadrant A |  |
 |
Quadrant B |
|---|---|---|---|
| Quadrant D |  |
 |
Quadrant C |
| Plot type | Count rate plots | Images |
|---|---|---|
| Comparison with Poisson distribution Blue bars denote a histogram of data divided into 1 sec bins. Red curve is a Poisson curve with rate = median count rate of data. |
 |
 |
| Quadrant-wise count rates Data is divided into 100 sec bins |
 |
|
| Module-wise count rates for Quadrant A Data is divided into 100 sec bins |
 |
 |
| Module-wise count rates for Quadrant B Data is divided into 100 sec bins |
 |
 |
| Module-wise count rates for Quadrant C Data is divided into 100 sec bins |
 |
 |
| Module-wise count rates for Quadrant D Data is divided into 100 sec bins |
 |
 |
| Parameter | Plot |
|---|---|
| CZT HV Monitor |  |
| D_VDD | 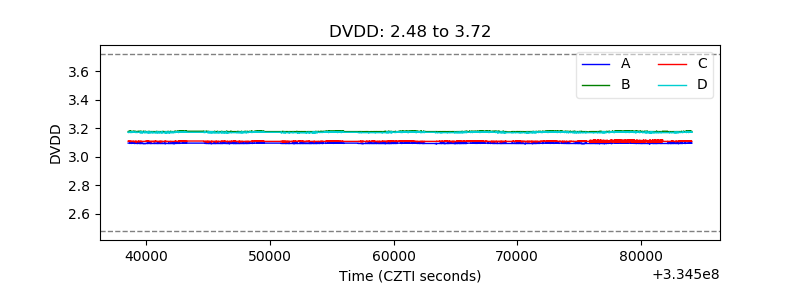 |
| Temperature 1 |  |
| Veto HV Monitor |  |
| Veto LLD |  |
| Alpha Counter |  |
| _CPM_Rate |  |
| CZT Counter |  |
| +2.5 Volts monitor |  |
| +5 Volts monitor |  |
| _ROLL_ROT |  |
| _Roll_DEC |  |
| _Roll_RA |  |
| Veto Counter |  |