| Param | Original file | Final file |
|---|---|---|
| Filename | modeM0/AS1A09_044T01_9000003792_26285cztM0_level2.evt | modeM0/AS1A09_044T01_9000003792_26285cztM0_level2_quad_clean.evt |
| Size (bytes) | 81,826,560 | 26,389,440 |
| Size | 78.0 MB | 25.2 MB |
| Events in quadrant A | 601,327 | 177,742 |
| Events in quadrant B | 597,415 | 187,665 |
| Events in quadrant C | 589,086 | 178,882 |
| Events in quadrant D | 614,597 | 172,824 |
| Mode M0 | |||
|---|---|---|---|
| Quadrant | BADHDUFLAG | Total packets | Discarded packets |
| A | 0 | 2396 | 0 |
| B | 0 | 2391 | 0 |
| C | 0 | 2360 | 0 |
| D | 0 | 2452 | 0 |
| Quadrant | Total seconds | Saturated seconds | Saturation percentage |
|---|---|---|---|
| A | 1065 | 2 | 0.187793% |
| B | 1065 | 0 | 0.000000% |
| C | 1065 | 5 | 0.469484% |
| D | 1065 | 3 | 0.281690% |
Noise dominated data is calculated using 1-second bins in cleaned event files. If a bin has >2000 counts, and if more than 50% of those come from <1% of pixels, then it is considered to be noise-dominated and hence unusable.
| Quadrant | # 1 sec bins | Bins with >0 counts | Bins with >2000 counts | High rate bins dominated by noise | Noise dominated (total time) | Noise dominated (detector-on time) | Marked lightcurve |
|---|---|---|---|---|---|---|---|
| A | 1065 | 1065 | 4 | 4 | 0.38% | 0.38% | 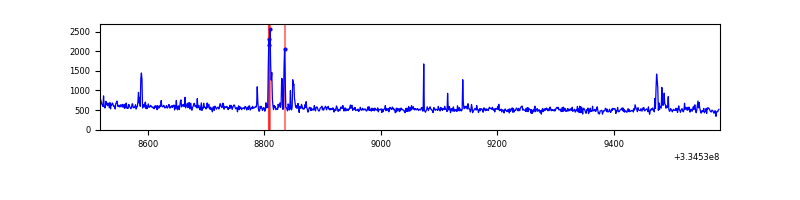 |
| B | 1065 | 1065 | 0 | 0 | 0.00% | 0.00% | 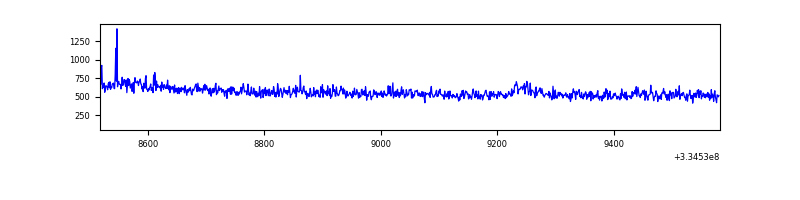 |
| C | 1065 | 1065 | 0 | 0 | 0.00% | 0.00% |  |
| D | 1065 | 1065 | 2 | 2 | 0.19% | 0.19% | 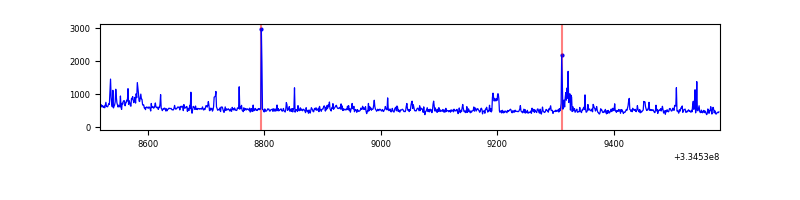 |
Top three noisy pixels from each quadrant. If the there are fewer than three noisy pixels in the level2.evt file, extra rows are filled as -1
| Pixel properties | Quadrant properties | ||||||
|---|---|---|---|---|---|---|---|
| Quadrant | DetID | PixID | Counts | Sigma | Mean | Median | Sigma |
| A | 0 | 13 | 38040 | 1223.09 | 145 | 143 | 31.0 |
| A | 13 | 254 | 2298 | 69.55 | 145 | 143 | 31.0 |
| A | 0 | 226 | 1294 | 37.15 | 145 | 143 | 31.0 |
| B | 7 | 219 | 6943 | 230.81 | 149 | 147 | 29.4 |
| B | 0 | 230 | 3658 | 119.24 | 149 | 147 | 29.4 |
| B | 7 | 235 | 3371 | 109.49 | 149 | 147 | 29.4 |
| C | 14 | 238 | 23561 | 665.9 | 142 | 144 | 35.2 |
| C | 4 | 254 | 5538 | 153.39 | 142 | 144 | 35.2 |
| C | 3 | 233 | 3982 | 109.14 | 142 | 144 | 35.2 |
| D | 1 | 52 | 71596 | 2049.67 | 140 | 137 | 34.9 |
| D | 8 | 195 | 5795 | 162.29 | 140 | 137 | 34.9 |
| D | 2 | 234 | 4444 | 123.54 | 140 | 137 | 34.9 |
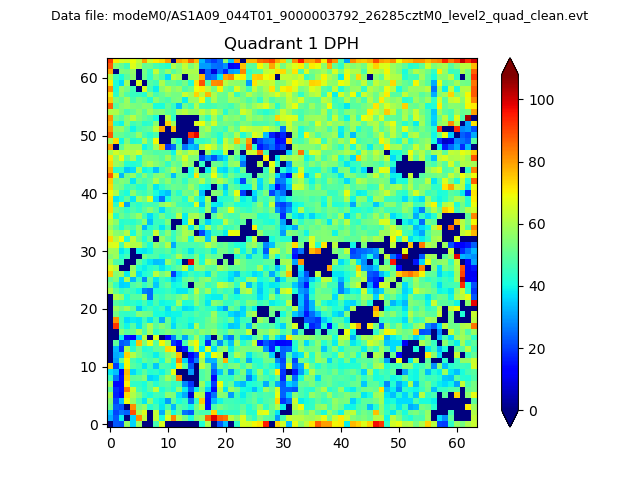
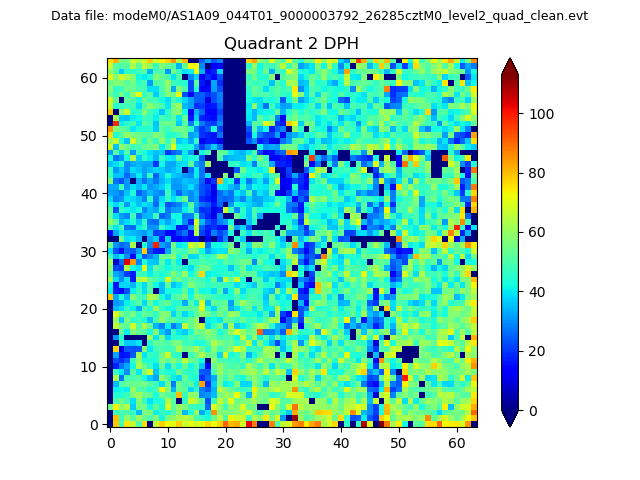
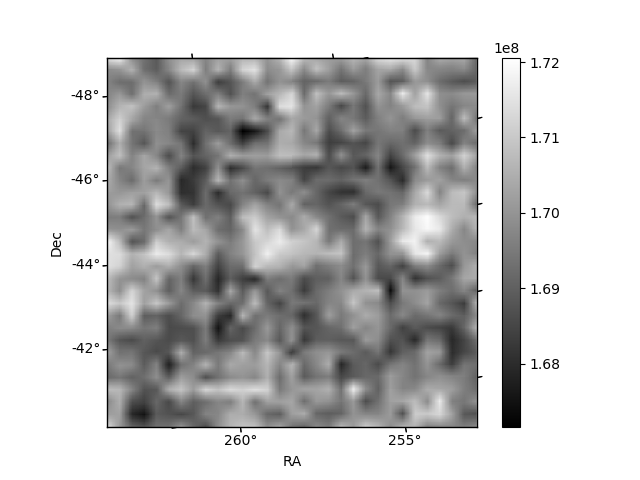
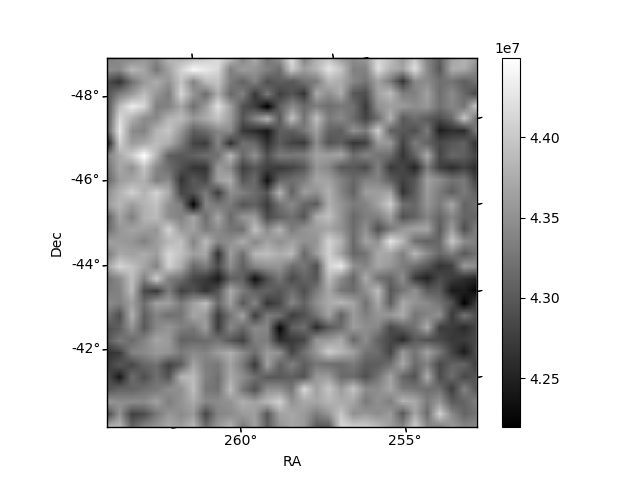
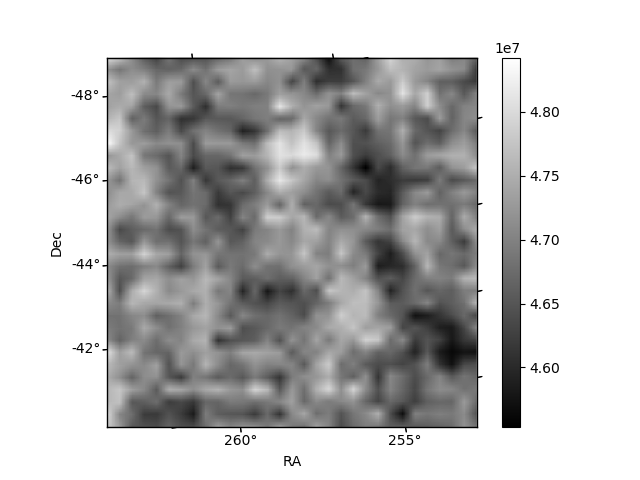
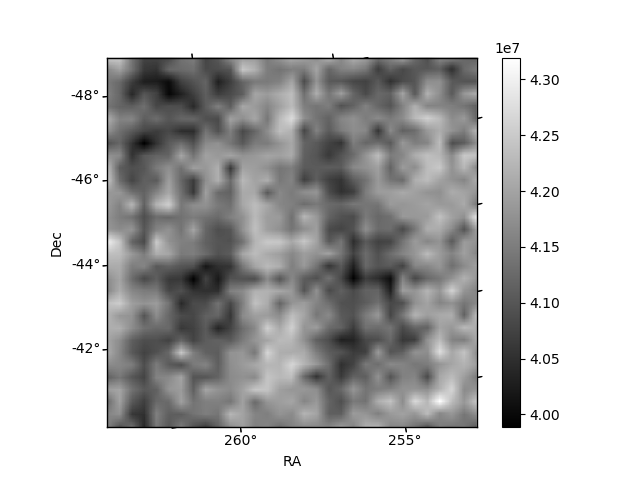
Histogram calculated using DETX and DETY for each event in the final _common_clean file
| Quadrant A | 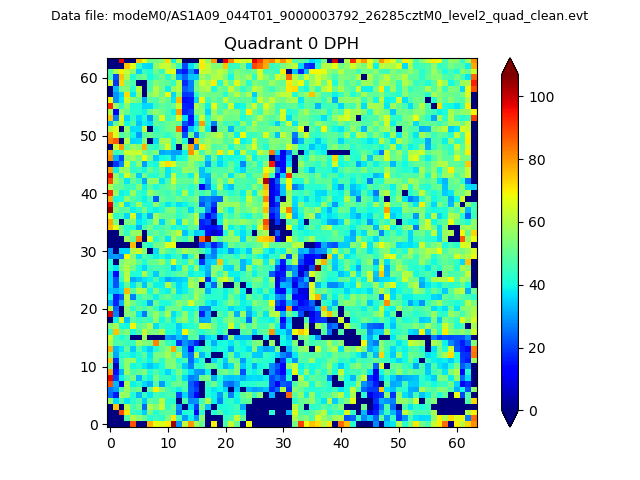 |
 |
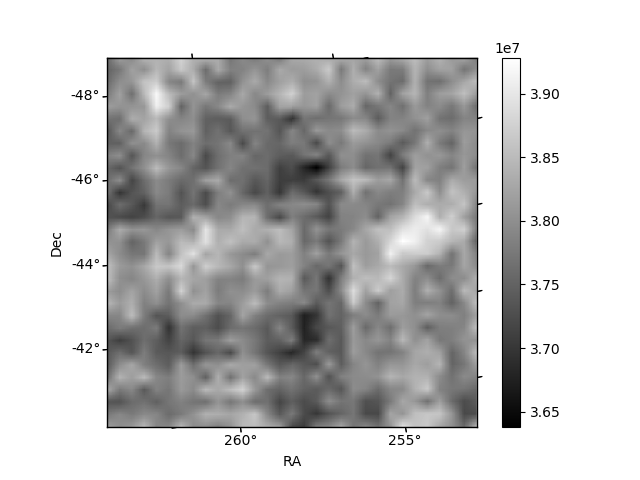
Quadrant B |
|---|---|---|---|
| Quadrant D | 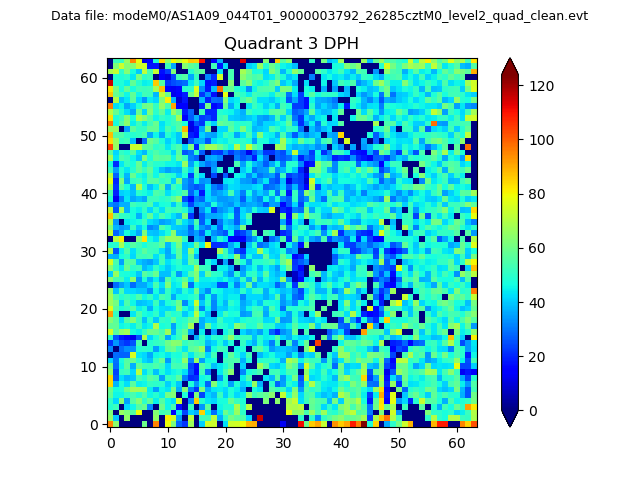 |
 |
Quadrant C |
| Plot type | Count rate plots | Images |
|---|---|---|
| Comparison with Poisson distribution Blue bars denote a histogram of data divided into 1 sec bins. Red curve is a Poisson curve with rate = median count rate of data. |
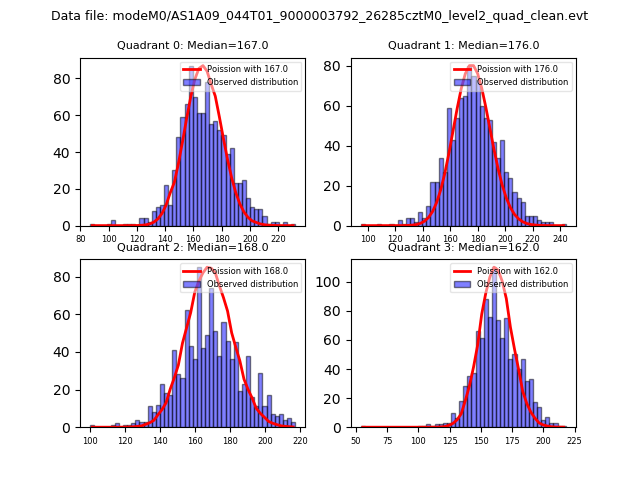 |
 |
| Quadrant-wise count rates Data is divided into 100 sec bins |
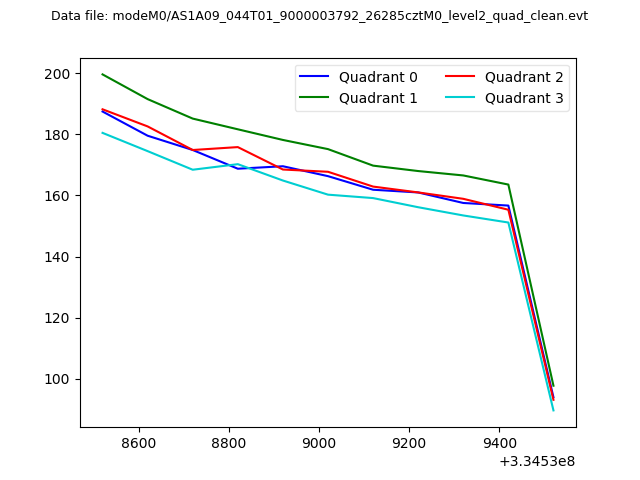 |
|
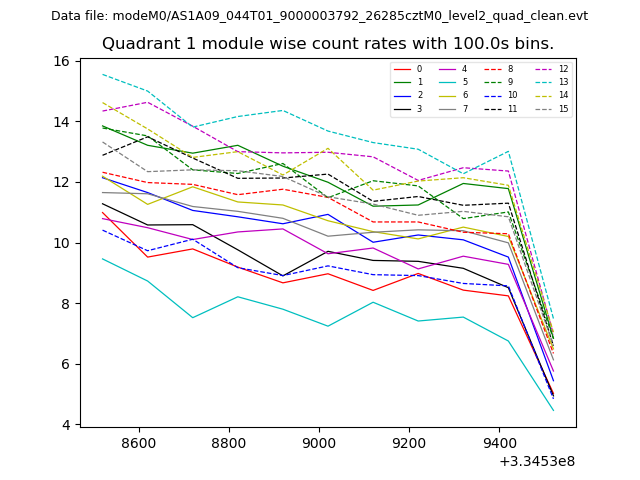
| Module-wise count rates for Quadrant A Data is divided into 100 sec bins |
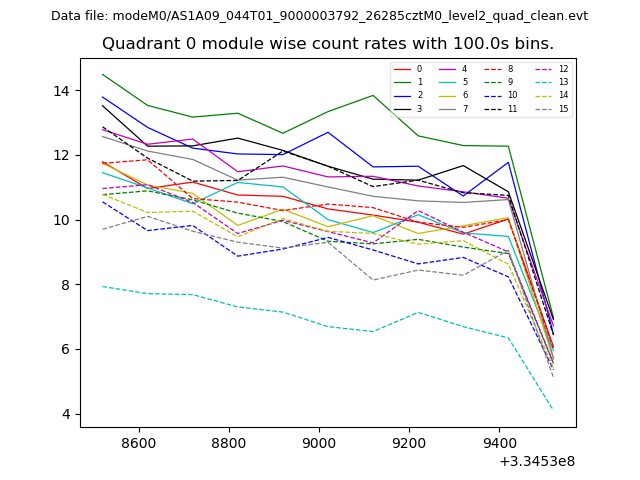 |
 |
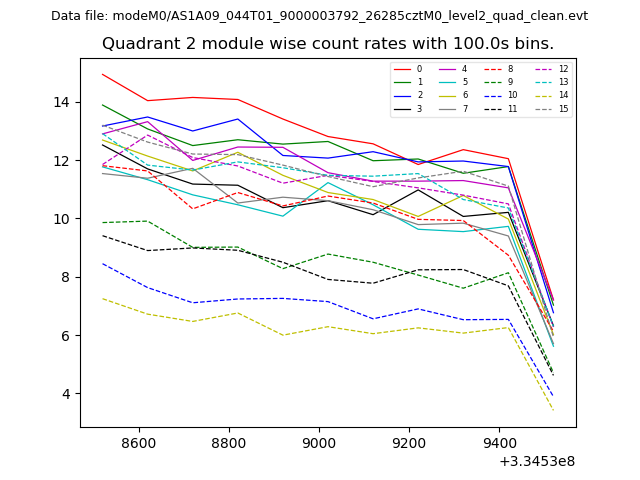
| Module-wise count rates for Quadrant B Data is divided into 100 sec bins |
 |
 |
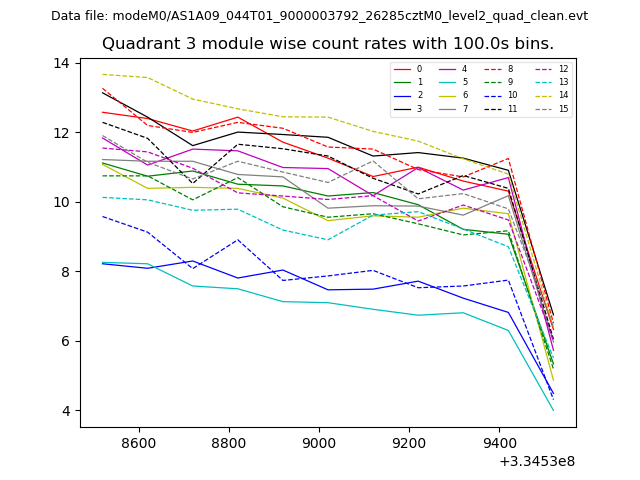
| Module-wise count rates for Quadrant C Data is divided into 100 sec bins |
 |
 |
| Module-wise count rates for Quadrant D Data is divided into 100 sec bins |
 |
 |
| Parameter | Plot |
|---|---|
| CZT HV Monitor | 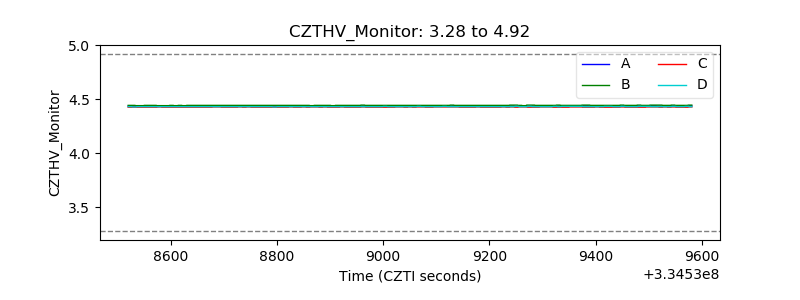 |
| D_VDD | 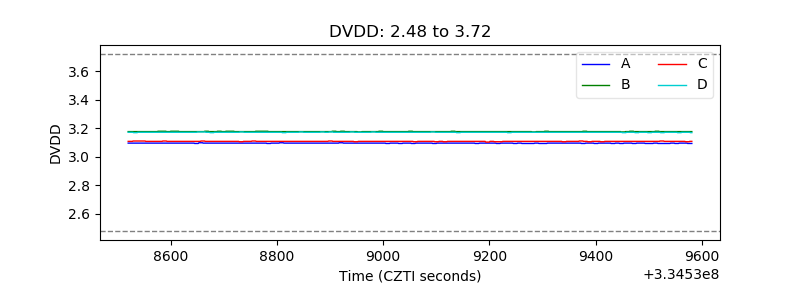 |
| Temperature 1 |  |
| Veto HV Monitor | 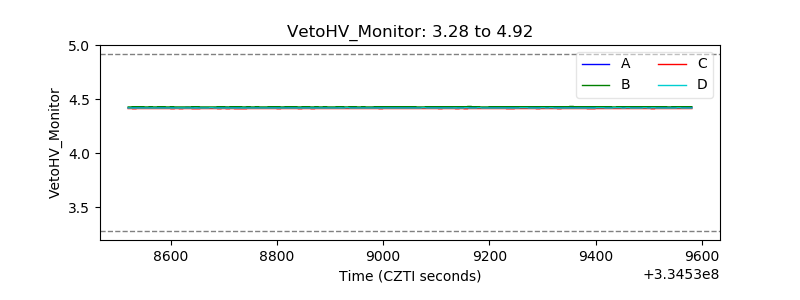 |
| Veto LLD | 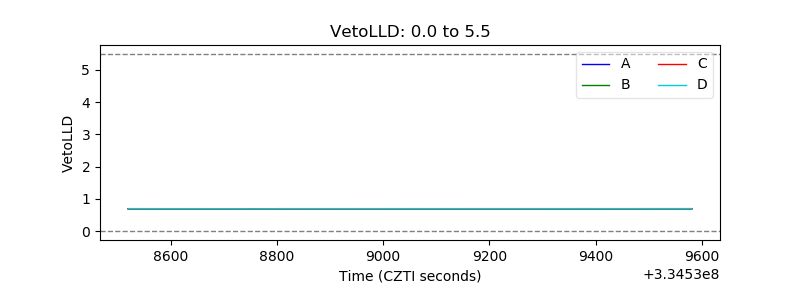 |
| Alpha Counter | 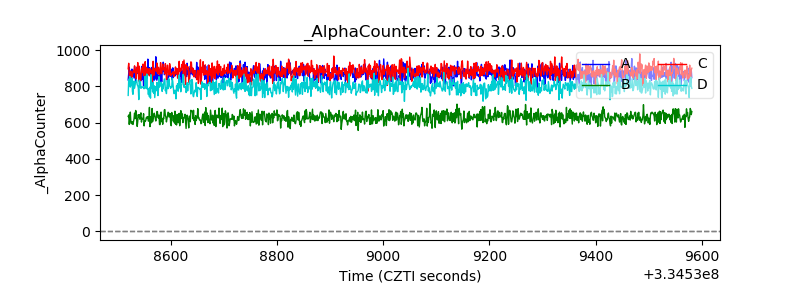 |
| _CPM_Rate |  |
| CZT Counter | 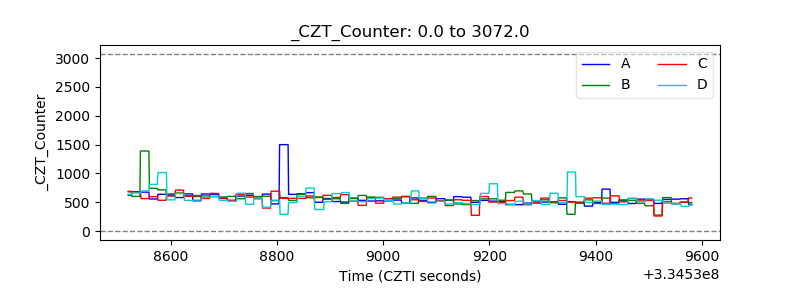 |
| +2.5 Volts monitor |  |
| +5 Volts monitor | 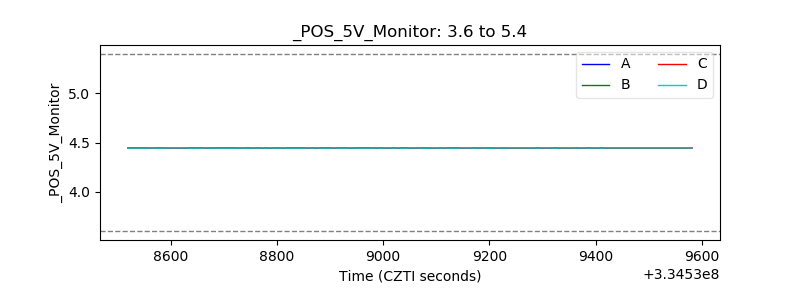 |
| _ROLL_ROT | 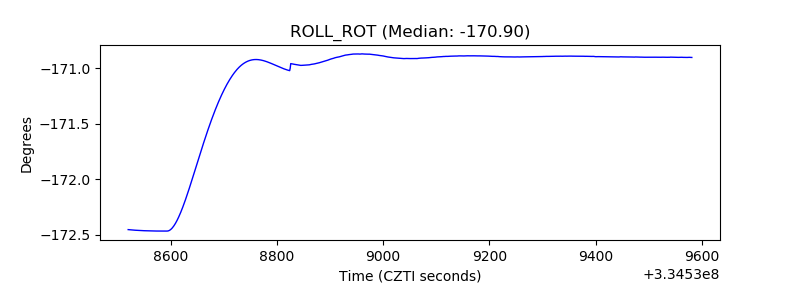 |
| _Roll_DEC | 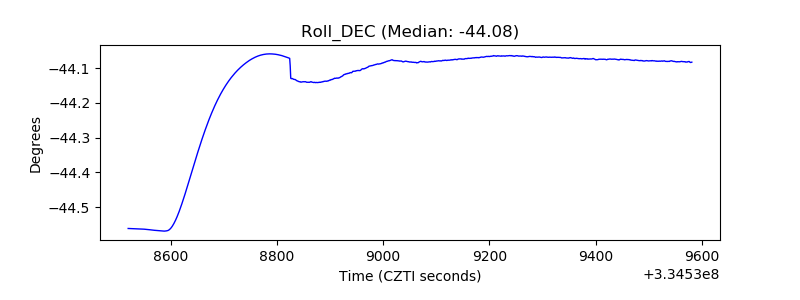 |
| _Roll_RA | 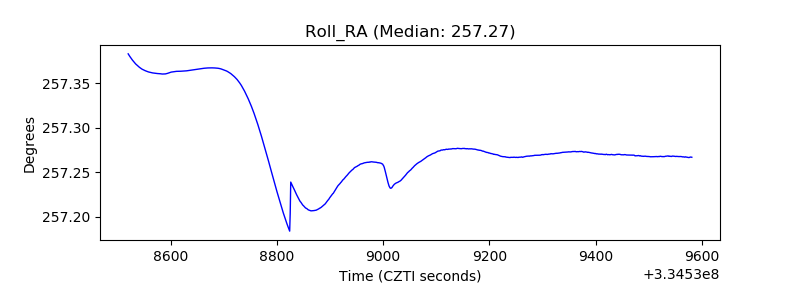 |
| Veto Counter | 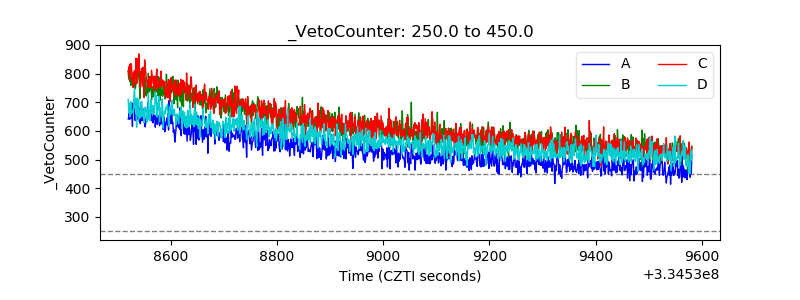 |