| Param | Original file | Final file |
|---|---|---|
| Filename | modeM0/AS1A09_044T01_9000003792_26286cztM0_level2.evt | modeM0/AS1A09_044T01_9000003792_26286cztM0_level2_quad_clean.evt |
| Size (bytes) | 490,656,960 | 88,873,920 |
| Size | 467.9 MB | 84.8 MB |
| Events in quadrant A | 3,232,141 | 565,248 |
| Events in quadrant B | 3,238,282 | 593,570 |
| Events in quadrant C | 3,261,629 | 569,150 |
| Events in quadrant D | 4,714,557 | 538,298 |
| Mode M0 | |||
|---|---|---|---|
| Quadrant | BADHDUFLAG | Total packets | Discarded packets |
| A | 0 | 13205 | 0 |
| B | 0 | 13123 | 0 |
| C | 0 | 13115 | 0 |
| D | 0 | 17911 | 0 |
| Mode M9 | |||
|---|---|---|---|
| Quadrant | BADHDUFLAG | Total packets | Discarded packets |
| A | 0 | 14 | 0 |
| B | 0 | 14 | 0 |
| C | 0 | 14 | 0 |
| D | 0 | 14 | 0 |
| Quadrant | Total seconds | Saturated seconds | Saturation percentage |
|---|---|---|---|
| A | 6096 | 21 | 0.344488% |
| B | 6096 | 31 | 0.508530% |
| C | 6095 | 60 | 0.984413% |
| D | 6095 | 347 | 5.693191% |
Noise dominated data is calculated using 1-second bins in cleaned event files. If a bin has >2000 counts, and if more than 50% of those come from <1% of pixels, then it is considered to be noise-dominated and hence unusable.
| Quadrant | # 1 sec bins | Bins with >0 counts | Bins with >2000 counts | High rate bins dominated by noise | Noise dominated (total time) | Noise dominated (detector-on time) | Marked lightcurve |
|---|---|---|---|---|---|---|---|
| A | 7446 | 6097 | 7 | 7 | 0.09% | 0.11% | 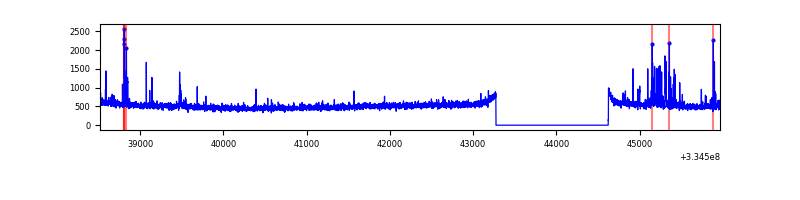 |
| B | 7446 | 6097 | 1 | 1 | 0.01% | 0.02% | 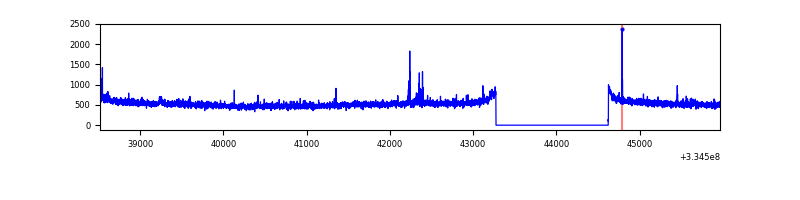 |
| C | 7445 | 6096 | 0 | 0 | 0.00% | 0.00% | 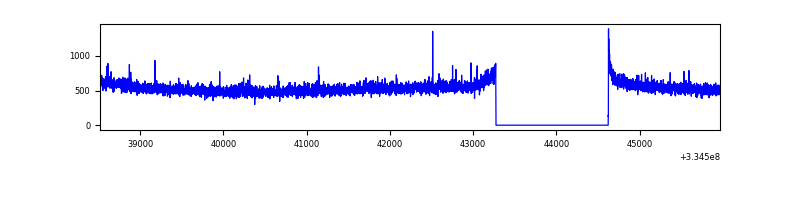 |
| D | 7445 | 6096 | 289 | 289 | 3.88% | 4.74% | 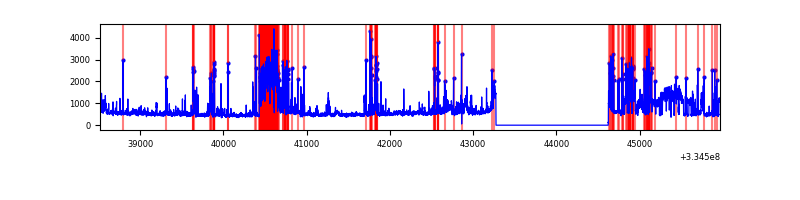 |
Top three noisy pixels from each quadrant. If the there are fewer than three noisy pixels in the level2.evt file, extra rows are filled as -1
| Pixel properties | Quadrant properties | ||||||
|---|---|---|---|---|---|---|---|
| Quadrant | DetID | PixID | Counts | Sigma | Mean | Median | Sigma |
| A | 0 | 13 | 123104 | 758.56 | 806 | 794 | 161.2 |
| A | 13 | 254 | 11170 | 64.35 | 806 | 794 | 161.2 |
| A | 3 | 137 | 6968 | 38.29 | 806 | 794 | 161.2 |
| B | 0 | 230 | 36650 | 236.58 | 817 | 800 | 151.5 |
| B | 12 | 111 | 17489 | 110.13 | 817 | 800 | 151.5 |
| B | 11 | 111 | 15153 | 94.72 | 817 | 800 | 151.5 |
| C | 14 | 238 | 129515 | 699.21 | 792 | 800 | 184.1 |
| C | 3 | 233 | 29148 | 153.99 | 792 | 800 | 184.1 |
| C | 4 | 254 | 16761 | 86.7 | 792 | 800 | 184.1 |
| D | 1 | 52 | 1666399 | 9147.41 | 768 | 751 | 182.1 |
| D | 13 | 168 | 49787 | 269.3 | 768 | 751 | 182.1 |
| D | 6 | 17 | 32272 | 173.11 | 768 | 751 | 182.1 |
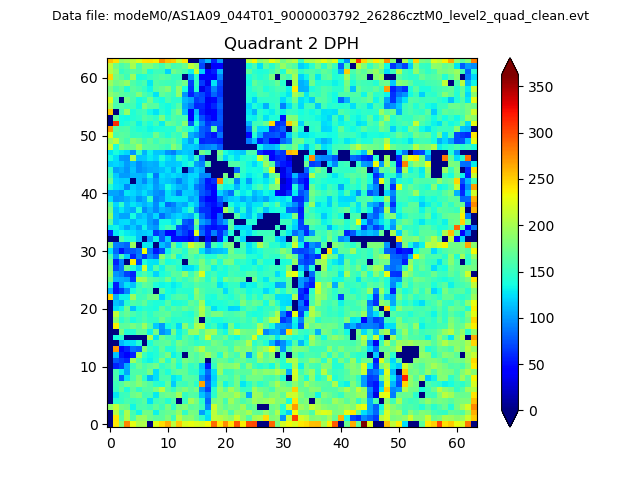
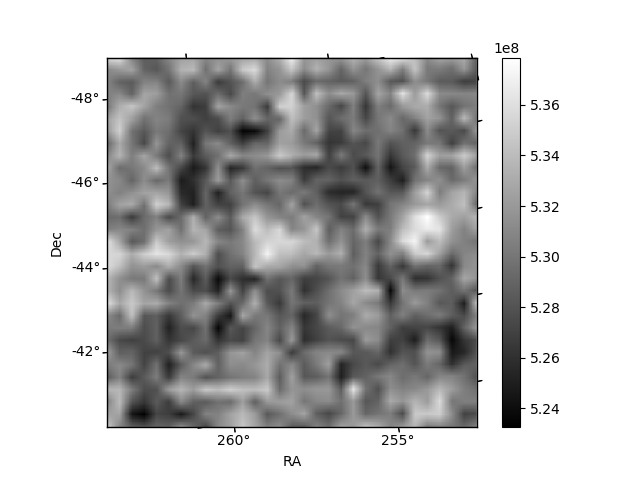
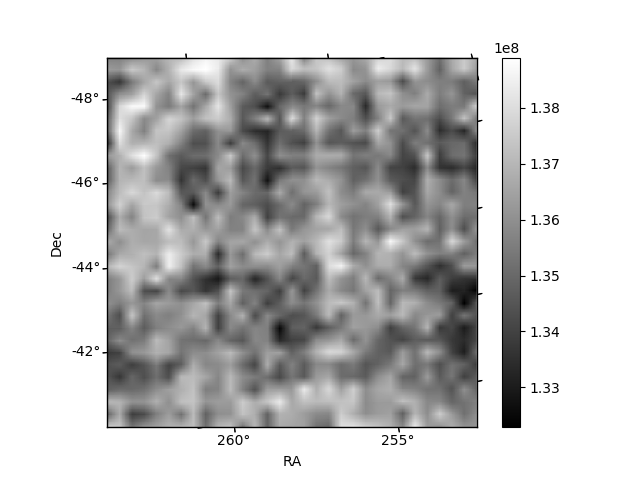
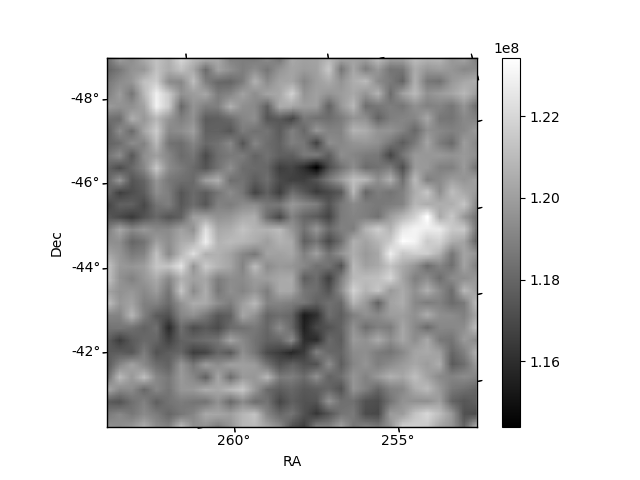
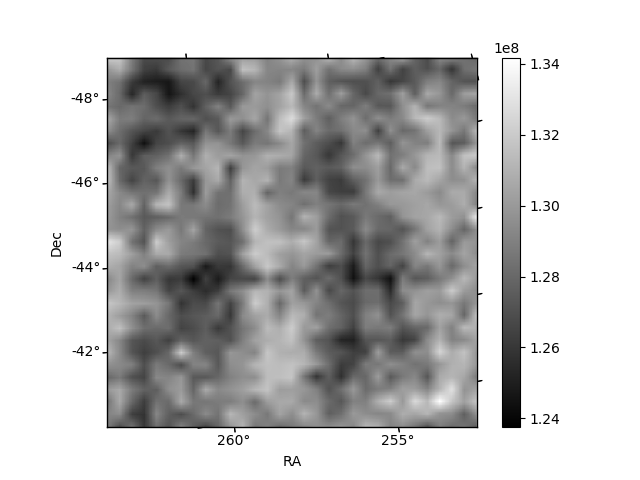
Histogram calculated using DETX and DETY for each event in the final _common_clean file
| Quadrant A | 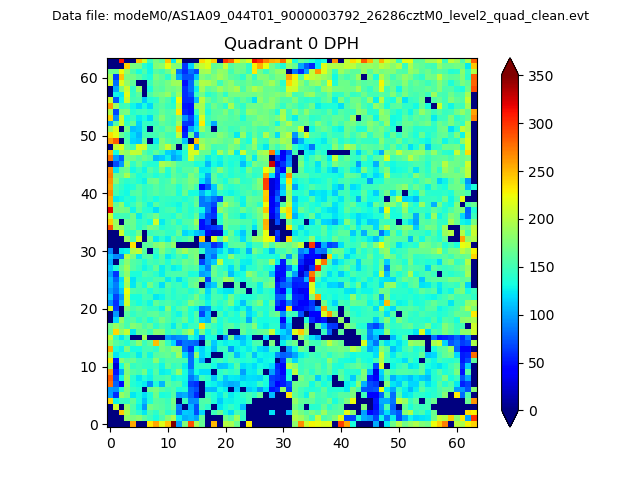 |
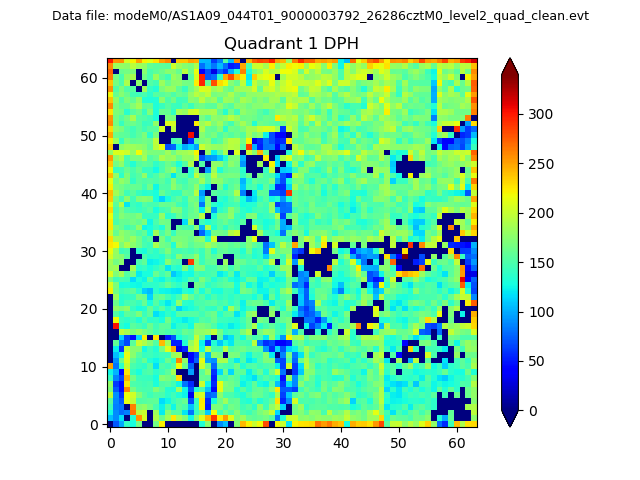 |
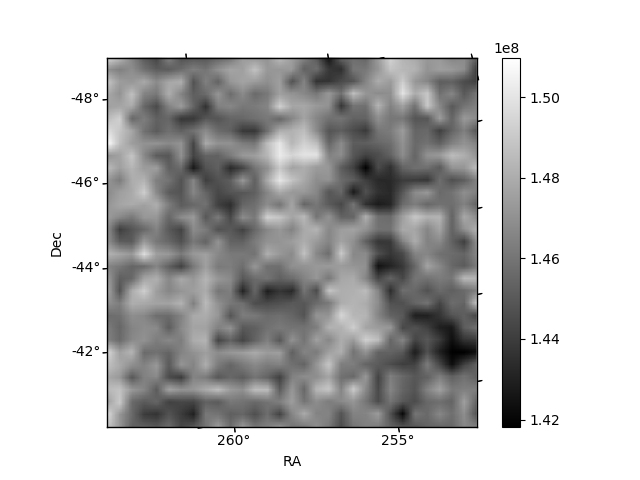
Quadrant B |
|---|---|---|---|
| Quadrant D | 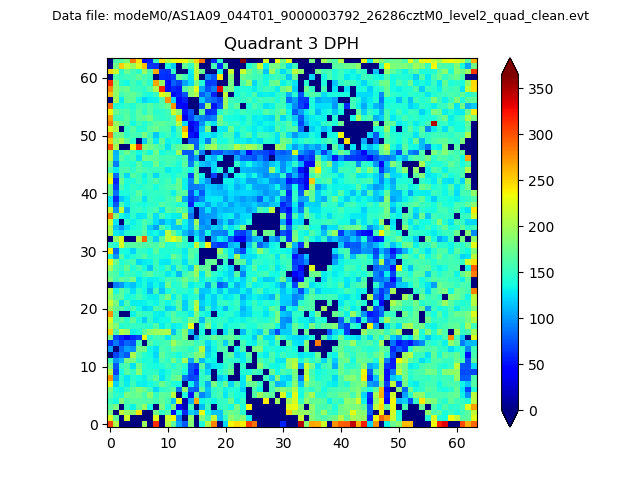 |
 |
Quadrant C |
| Plot type | Count rate plots | Images |
|---|---|---|
| Comparison with Poisson distribution Blue bars denote a histogram of data divided into 1 sec bins. Red curve is a Poisson curve with rate = median count rate of data. |
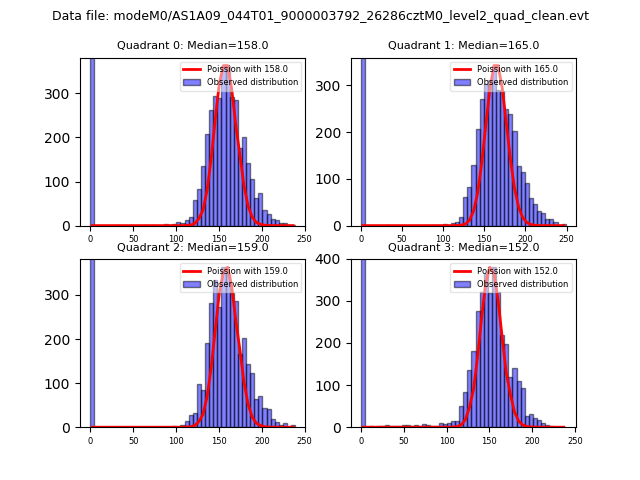 |
 |
| Quadrant-wise count rates Data is divided into 100 sec bins |
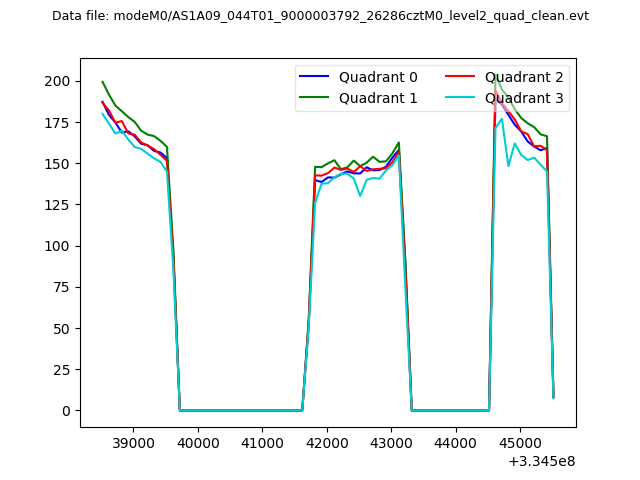 |
|
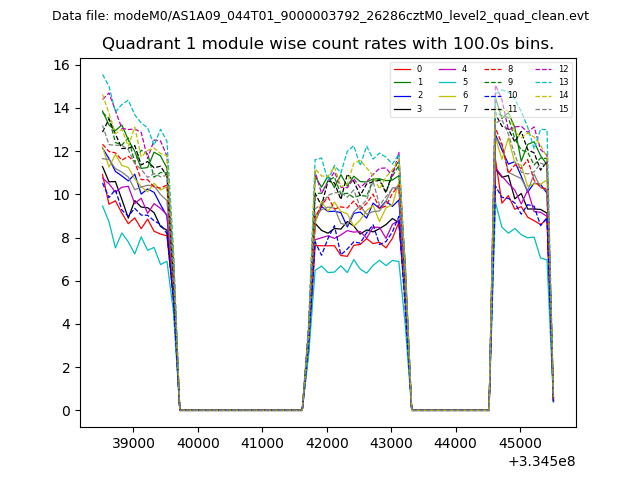
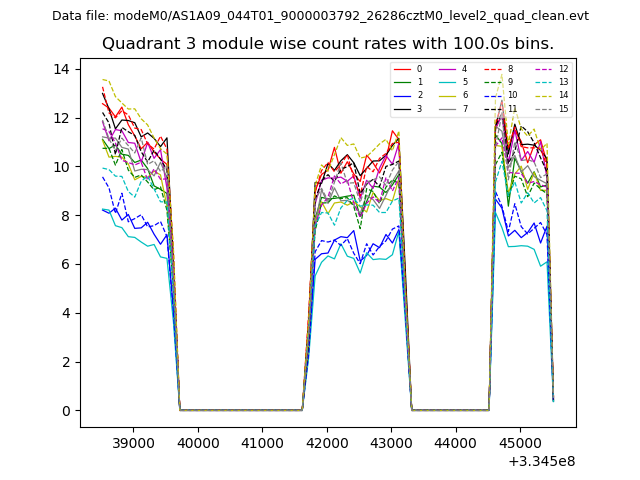
| Module-wise count rates for Quadrant A Data is divided into 100 sec bins |
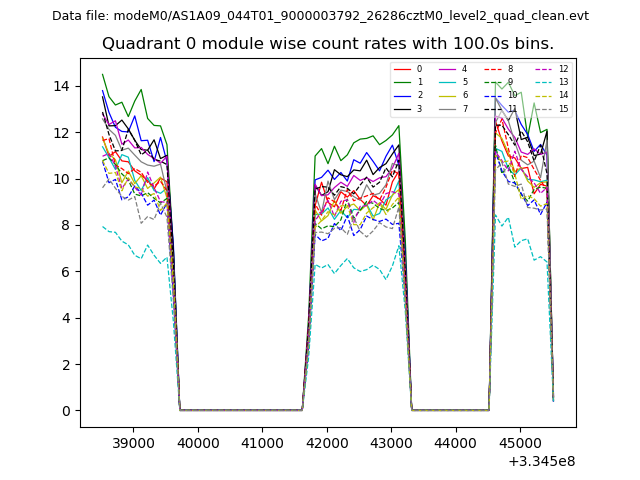 |
 |
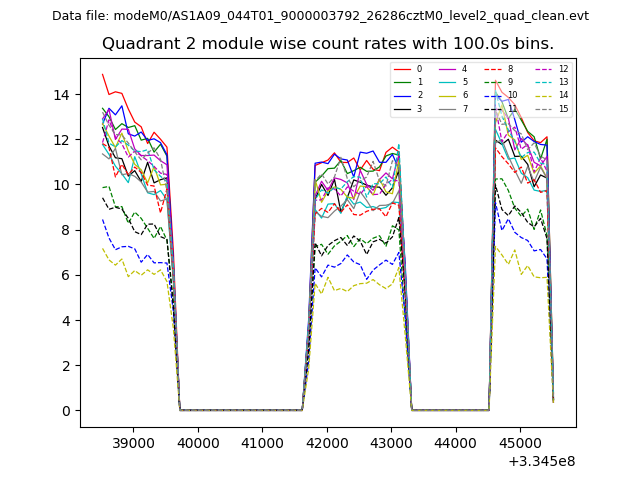
| Module-wise count rates for Quadrant B Data is divided into 100 sec bins |
 |
 |
| Module-wise count rates for Quadrant C Data is divided into 100 sec bins |
 |
 |
| Module-wise count rates for Quadrant D Data is divided into 100 sec bins |
 |
 |
| Parameter | Plot |
|---|---|
| CZT HV Monitor | 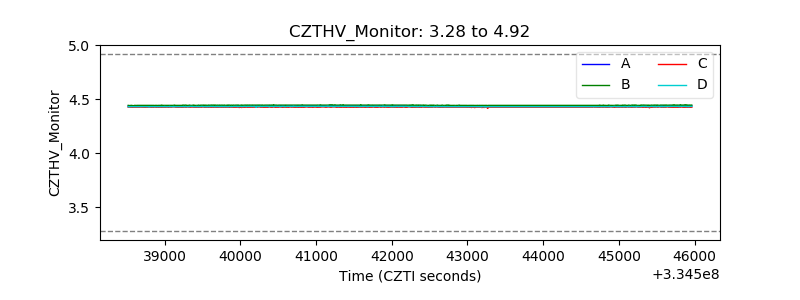 |
| D_VDD | 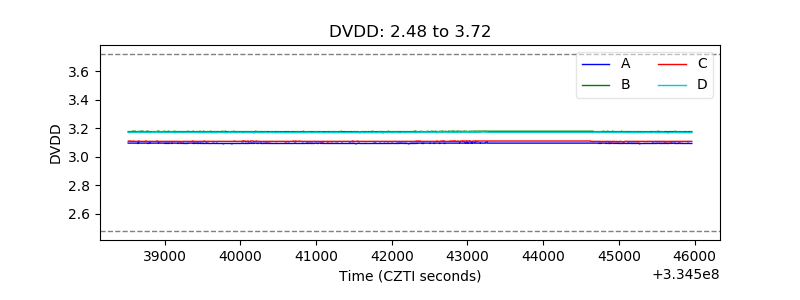 |
| Temperature 1 | 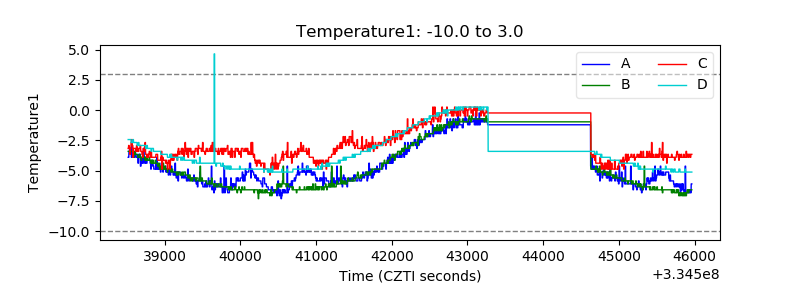 |
| Veto HV Monitor | 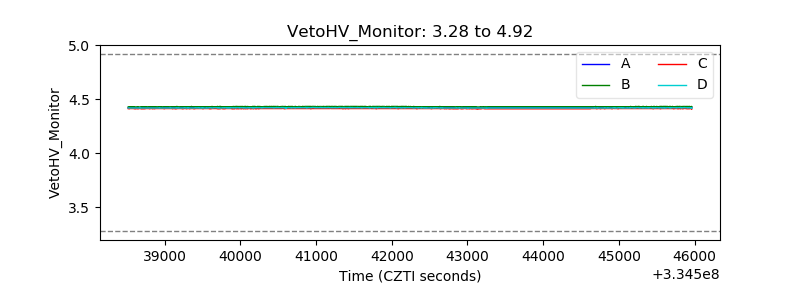 |
| Veto LLD | 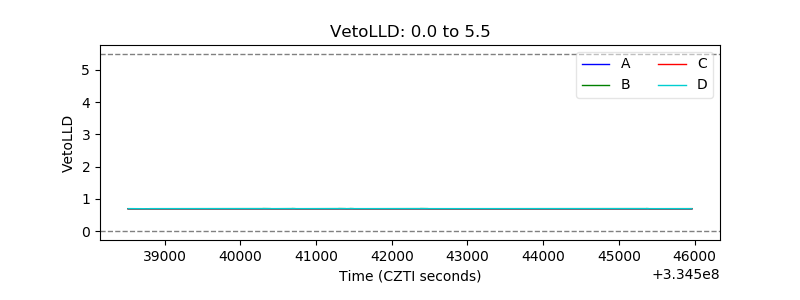 |
| Alpha Counter | 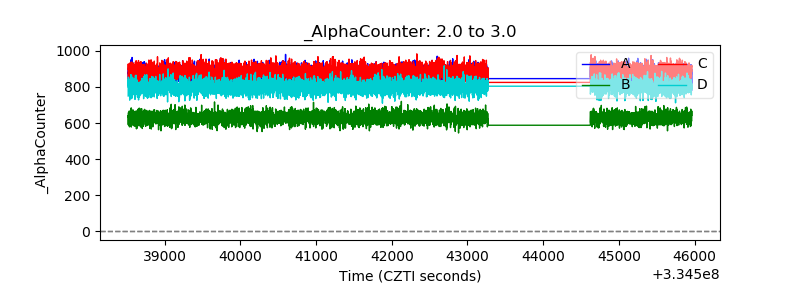 |
| _CPM_Rate | 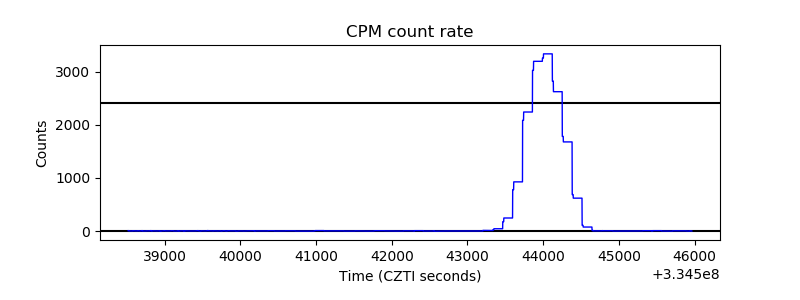 |
| CZT Counter | 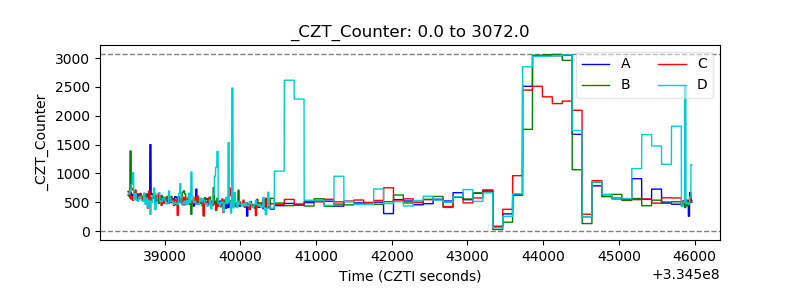 |
| +2.5 Volts monitor | 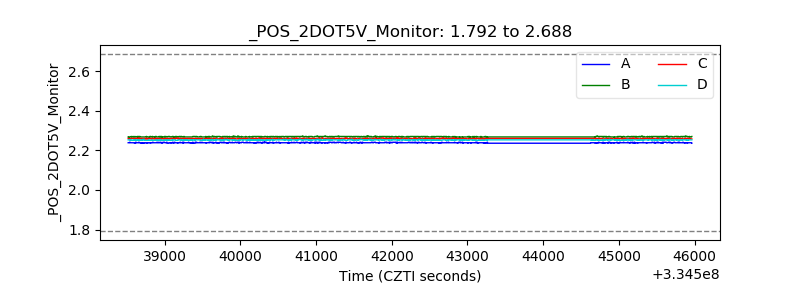 |
| +5 Volts monitor |  |
| _ROLL_ROT | 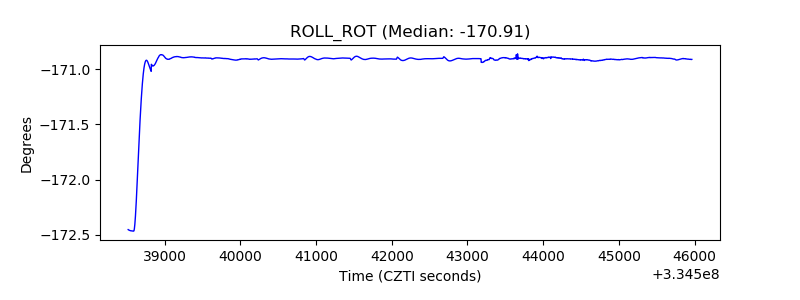 |
| _Roll_DEC | 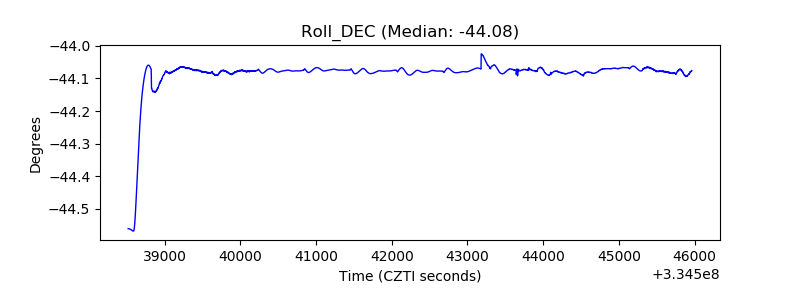 |
| _Roll_RA | 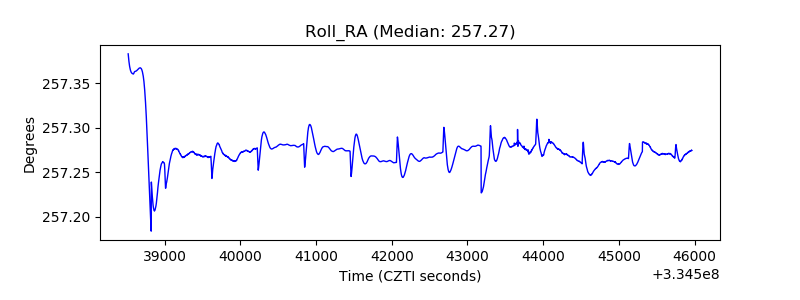 |
| Veto Counter | 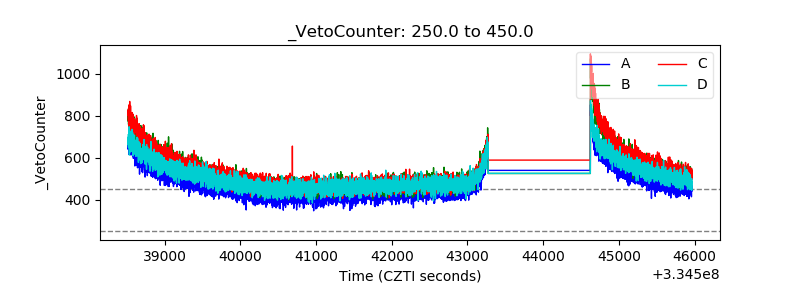 |