| Param | Original file | Final file |
|---|---|---|
| Filename | modeM0/AS1A09_044T01_9000003792_26288cztM0_level2.evt | modeM0/AS1A09_044T01_9000003792_26288cztM0_level2_quad_clean.evt |
| Size (bytes) | 914,042,880 | 128,658,240 |
| Size | 871.7 MB | 122.7 MB |
| Events in quadrant A | 5,817,701 | 782,336 |
| Events in quadrant B | 5,666,433 | 813,676 |
| Events in quadrant C | 5,820,269 | 785,558 |
| Events in quadrant D | 9,626,527 | 745,249 |
| Mode M0 | |||
|---|---|---|---|
| Quadrant | BADHDUFLAG | Total packets | Discarded packets |
| A | 0 | 23766 | 0 |
| B | 0 | 23092 | 0 |
| C | 0 | 23466 | 0 |
| D | 0 | 36119 | 0 |
| Mode M9 | |||
|---|---|---|---|
| Quadrant | BADHDUFLAG | Total packets | Discarded packets |
| A | 0 | 25 | 0 |
| B | 0 | 25 | 0 |
| C | 0 | 25 | 0 |
| D | 0 | 25 | 0 |
| Quadrant | Total seconds | Saturated seconds | Saturation percentage |
|---|---|---|---|
| A | 11114 | 93 | 0.836782% |
| B | 11114 | 100 | 0.899766% |
| C | 11115 | 164 | 1.475484% |
| D | 11115 | 837 | 7.530364% |
Noise dominated data is calculated using 1-second bins in cleaned event files. If a bin has >2000 counts, and if more than 50% of those come from <1% of pixels, then it is considered to be noise-dominated and hence unusable.
| Quadrant | # 1 sec bins | Bins with >0 counts | Bins with >2000 counts | High rate bins dominated by noise | Noise dominated (total time) | Noise dominated (detector-on time) | Marked lightcurve |
|---|---|---|---|---|---|---|---|
| A | 13595 | 11117 | 19 | 19 | 0.14% | 0.17% |  |
| B | 13596 | 11118 | 0 | 0 | 0.00% | 0.00% |  |
| C | 13596 | 11118 | 3 | 3 | 0.02% | 0.03% | 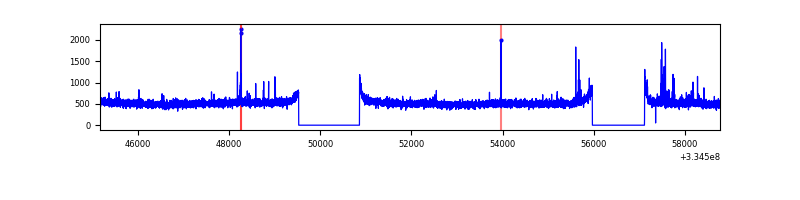 |
| D | 13596 | 11118 | 727 | 727 | 5.35% | 6.54% | 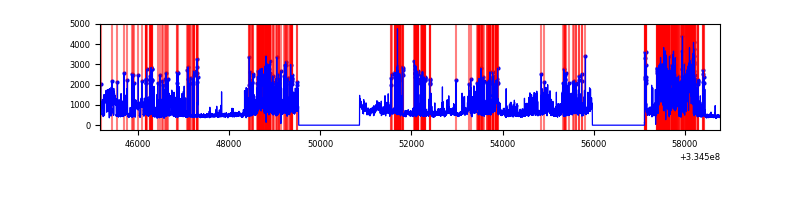 |
Top three noisy pixels from each quadrant. If the there are fewer than three noisy pixels in the level2.evt file, extra rows are filled as -1
| Pixel properties | Quadrant properties | ||||||
|---|---|---|---|---|---|---|---|
| Quadrant | DetID | PixID | Counts | Sigma | Mean | Median | Sigma |
| A | 0 | 13 | 278987 | 972.76 | 1433 | 1409 | 285.4 |
| A | 13 | 254 | 18772 | 60.85 | 1433 | 1409 | 285.4 |
| A | 8 | 192 | 14134 | 44.59 | 1433 | 1409 | 285.4 |
| B | 12 | 111 | 32007 | 114.35 | 1443 | 1408 | 267.6 |
| B | 11 | 111 | 28439 | 101.01 | 1443 | 1408 | 267.6 |
| B | 14 | 111 | 25608 | 90.43 | 1443 | 1408 | 267.6 |
| C | 14 | 238 | 226001 | 697.26 | 1401 | 1414 | 322.1 |
| C | 4 | 254 | 84633 | 258.36 | 1401 | 1414 | 322.1 |
| C | 2 | 16 | 23778 | 69.43 | 1401 | 1414 | 322.1 |
| D | 1 | 52 | 4301300 | 13283.72 | 1365 | 1333 | 323.7 |
| D | 11 | 176 | 53426 | 160.93 | 1365 | 1333 | 323.7 |
| D | 2 | 234 | 42623 | 127.55 | 1365 | 1333 | 323.7 |
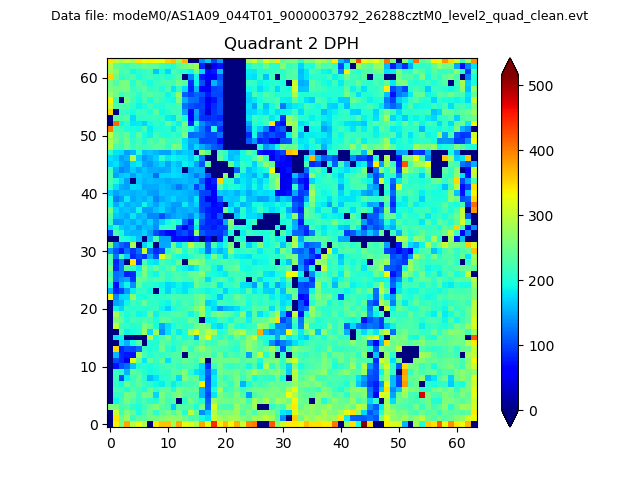
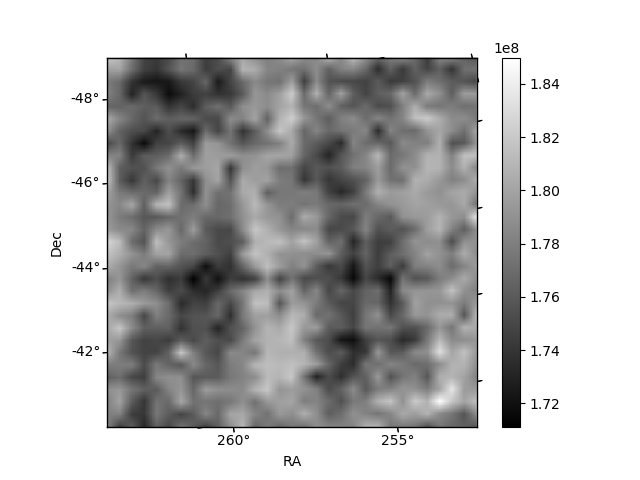
Histogram calculated using DETX and DETY for each event in the final _common_clean file
| Quadrant A | 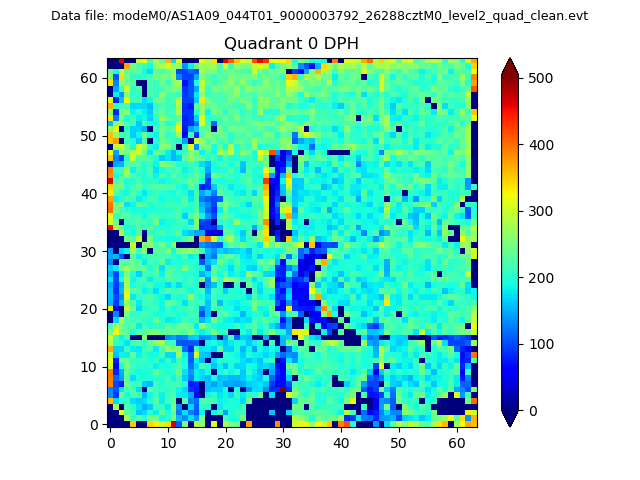 |
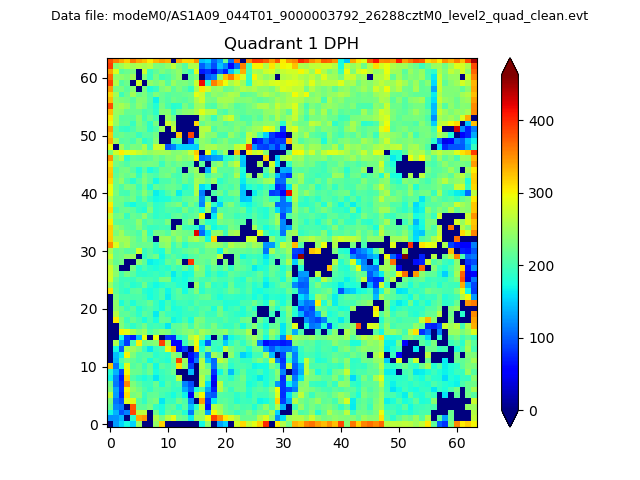 |
Quadrant B |
|---|---|---|---|
| Quadrant D | 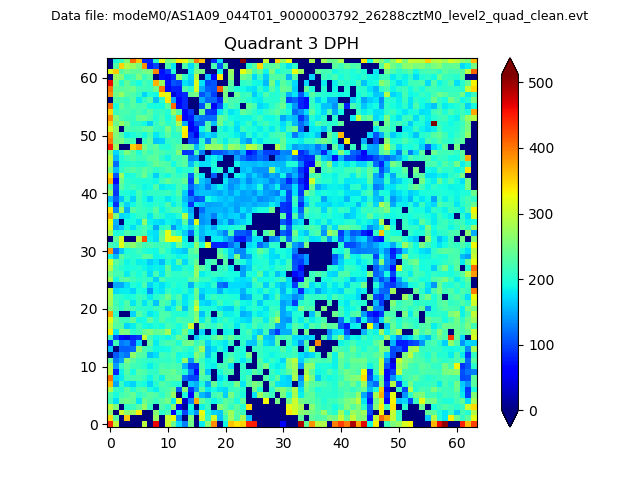 |
 |
Quadrant C |
| Plot type | Count rate plots | Images |
|---|---|---|
| Comparison with Poisson distribution Blue bars denote a histogram of data divided into 1 sec bins. Red curve is a Poisson curve with rate = median count rate of data. |
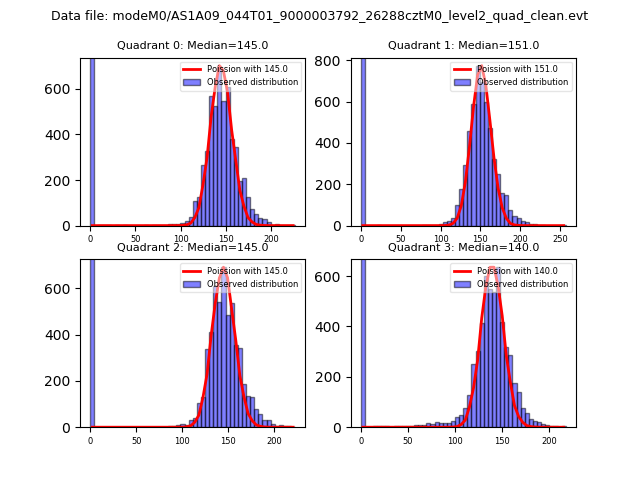 |
 |
| Quadrant-wise count rates Data is divided into 100 sec bins |
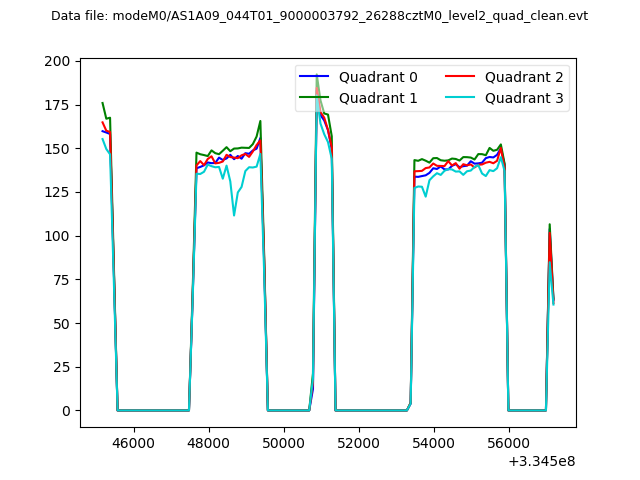 |
|
| Module-wise count rates for Quadrant A Data is divided into 100 sec bins |
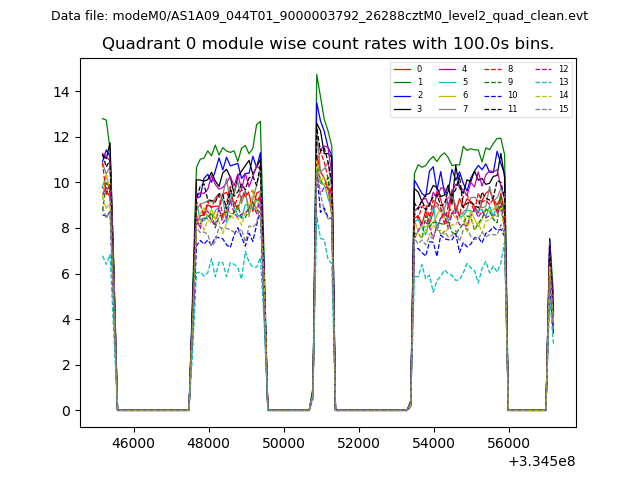 |
 |
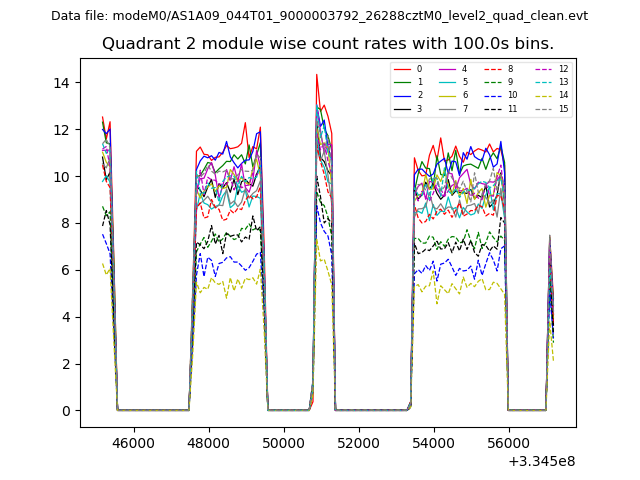
| Module-wise count rates for Quadrant B Data is divided into 100 sec bins |
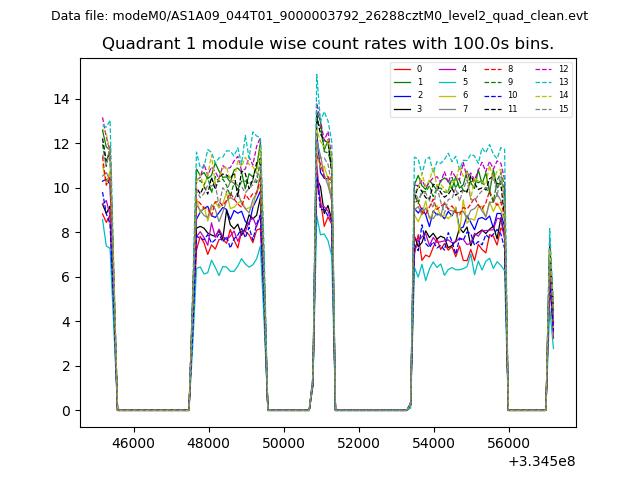 |
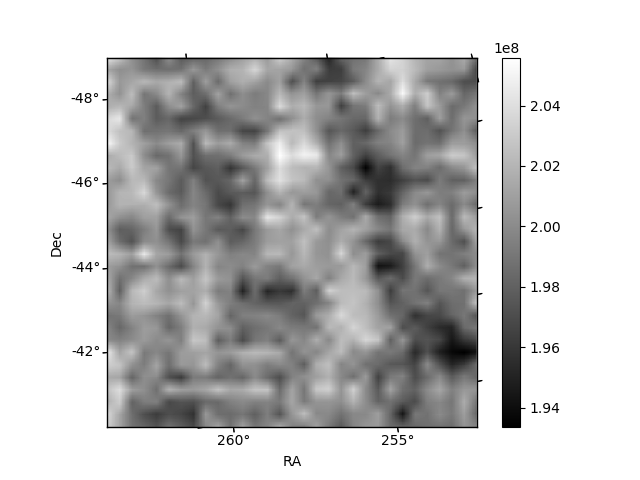 |
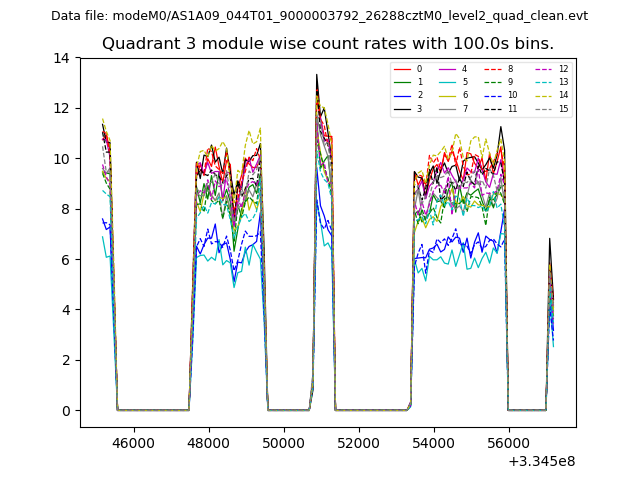
| Module-wise count rates for Quadrant C Data is divided into 100 sec bins |
 |
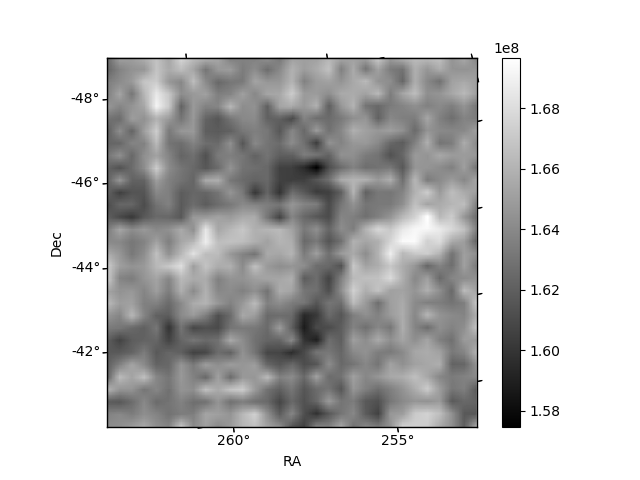 |
| Module-wise count rates for Quadrant D Data is divided into 100 sec bins |
 |
 |
| Parameter | Plot |
|---|---|
| CZT HV Monitor | 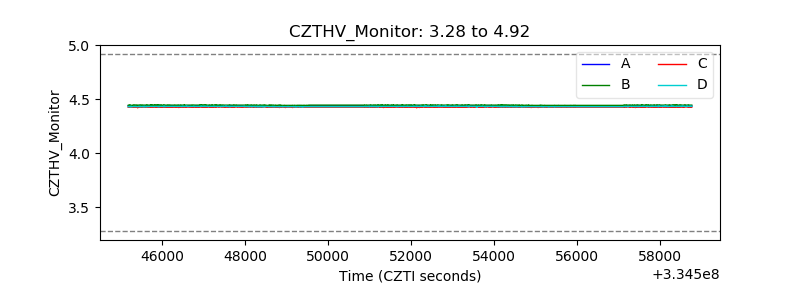 |
| D_VDD | 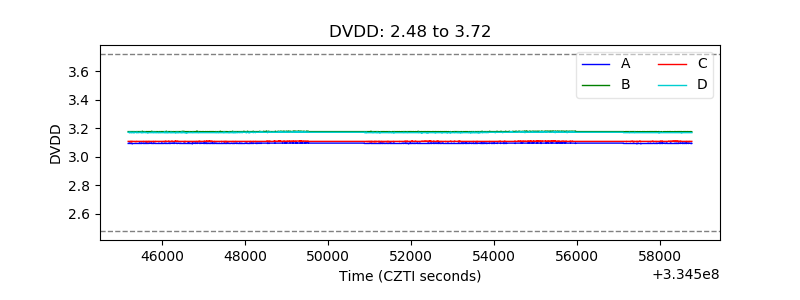 |
| Temperature 1 | 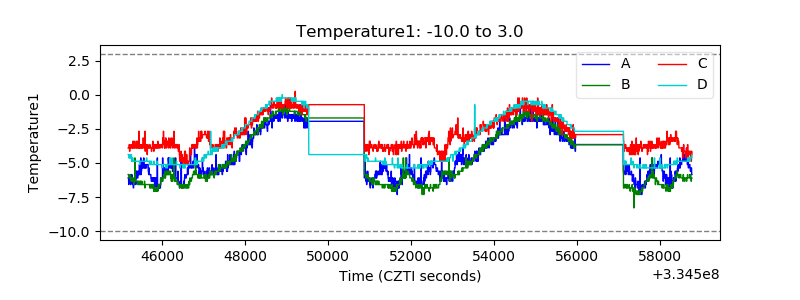 |
| Veto HV Monitor |  |
| Veto LLD | 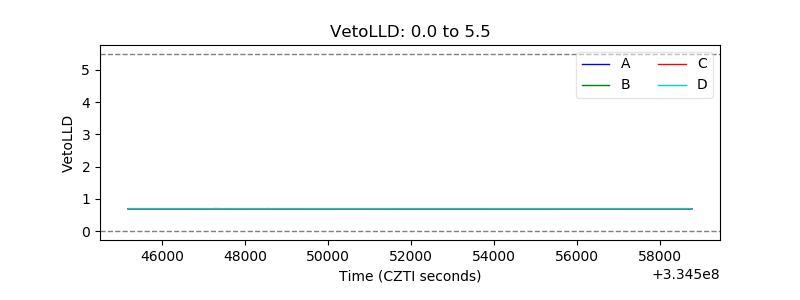 |
| Alpha Counter | 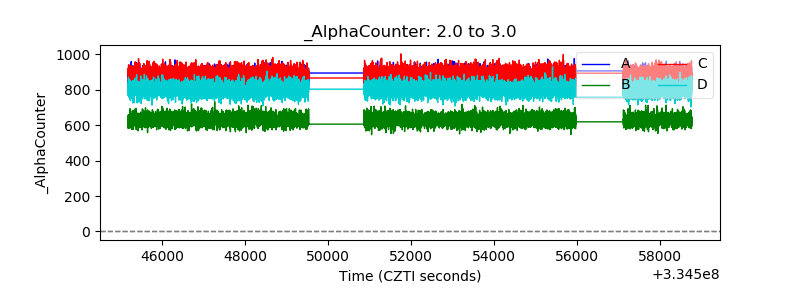 |
| _CPM_Rate | 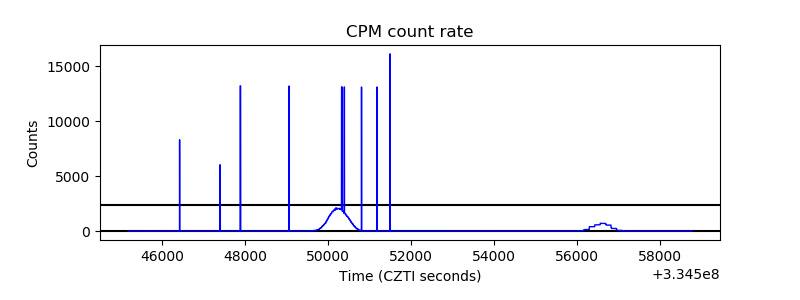 |
| CZT Counter | 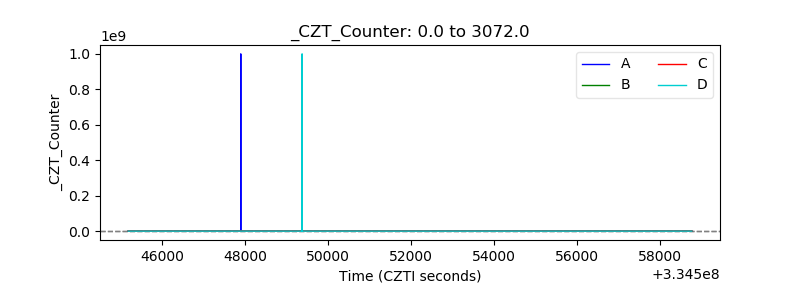 |
| +2.5 Volts monitor |  |
| +5 Volts monitor |  |
| _ROLL_ROT | 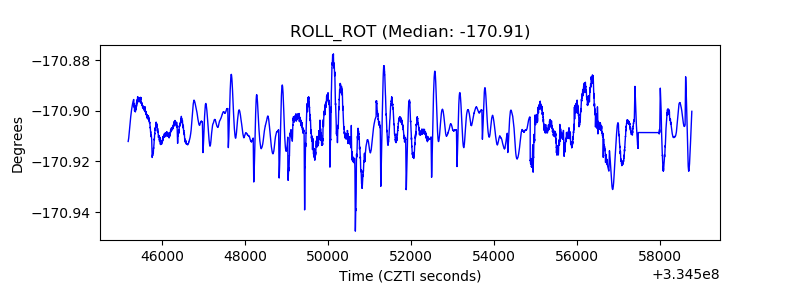 |
| _Roll_DEC | 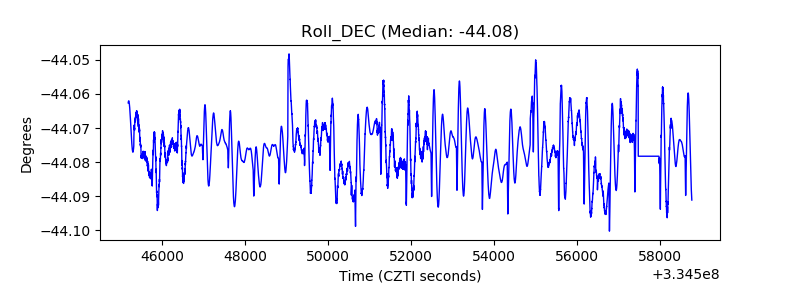 |
| _Roll_RA | 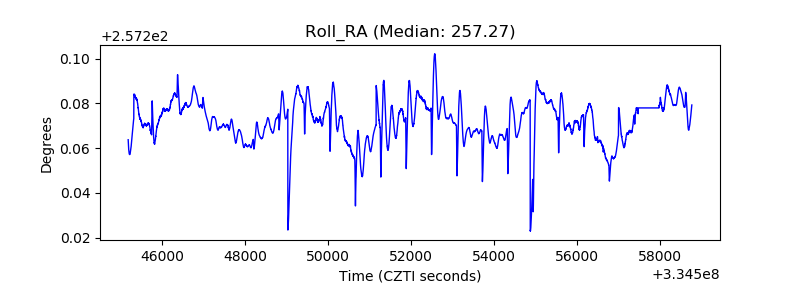 |
| Veto Counter | 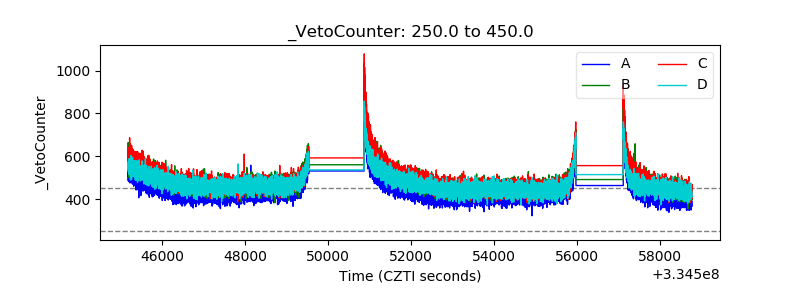 |