| Param | Original file | Final file |
|---|---|---|
| Filename | modeM0/AS1A09_044T01_9000003792_26290cztM0_level2.evt | modeM0/AS1A09_044T01_9000003792_26290cztM0_level2_quad_clean.evt |
| Size (bytes) | 767,157,120 | 76,536,000 |
| Size | 731.6 MB | 73.0 MB |
| Events in quadrant A | 4,046,792 | 492,643 |
| Events in quadrant B | 3,567,374 | 505,881 |
| Events in quadrant C | 4,976,667 | 490,272 |
| Events in quadrant D | 10,146,189 | 317,335 |
| Mode M0 | |||
|---|---|---|---|
| Quadrant | BADHDUFLAG | Total packets | Discarded packets |
| A | 0 | 16696 | 0 |
| B | 0 | 15139 | 0 |
| C | 0 | 19402 | 0 |
| D | 0 | 35023 | 0 |
| Mode M9 | |||
|---|---|---|---|
| Quadrant | BADHDUFLAG | Total packets | Discarded packets |
| A | 0 | 4 | 0 |
| B | 0 | 4 | 0 |
| C | 0 | 4 | 0 |
| D | 0 | 4 | 0 |
| Quadrant | Total seconds | Saturated seconds | Saturation percentage |
|---|---|---|---|
| A | 7327 | 206 | 2.811519% |
| B | 7327 | 136 | 1.856148% |
| C | 7327 | 803 | 10.959465% |
| D | 7327 | 2581 | 35.225877% |
Noise dominated data is calculated using 1-second bins in cleaned event files. If a bin has >2000 counts, and if more than 50% of those come from <1% of pixels, then it is considered to be noise-dominated and hence unusable.
| Quadrant | # 1 sec bins | Bins with >0 counts | Bins with >2000 counts | High rate bins dominated by noise | Noise dominated (total time) | Noise dominated (detector-on time) | Marked lightcurve |
|---|---|---|---|---|---|---|---|
| A | 7727 | 7328 | 63 | 63 | 0.82% | 0.86% | 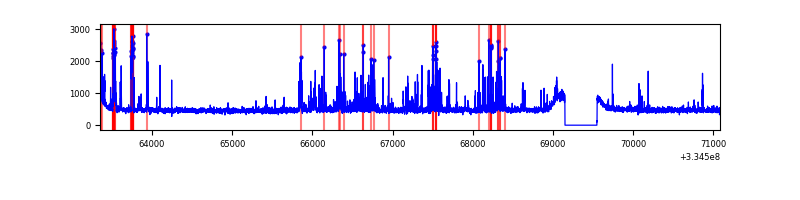 |
| B | 7727 | 7328 | 2 | 2 | 0.03% | 0.03% | 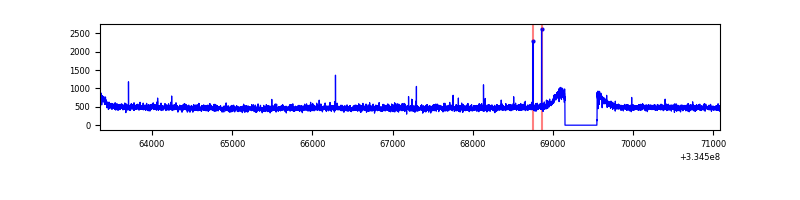 |
| C | 7727 | 7328 | 354 | 354 | 4.58% | 4.83% | 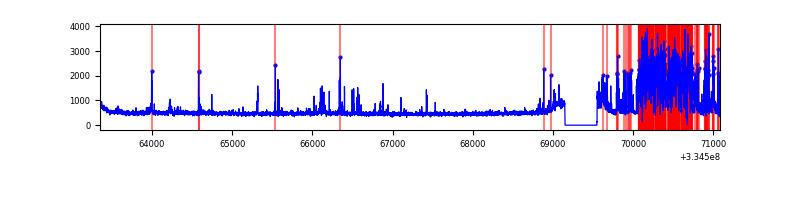 |
| D | 7727 | 7328 | 2347 | 2347 | 30.37% | 32.03% | 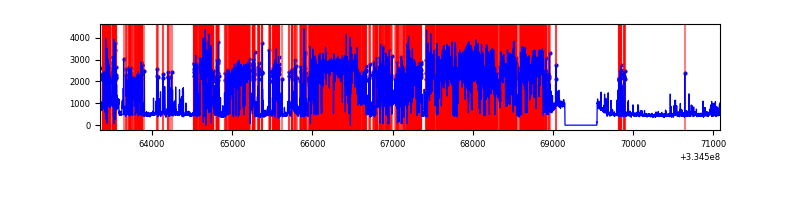 |
Top three noisy pixels from each quadrant. If the there are fewer than three noisy pixels in the level2.evt file, extra rows are filled as -1
| Pixel properties | Quadrant properties | ||||||
|---|---|---|---|---|---|---|---|
| Quadrant | DetID | PixID | Counts | Sigma | Mean | Median | Sigma |
| A | 0 | 13 | 556116 | 3049.46 | 903 | 882 | 182.1 |
| A | 13 | 254 | 13010 | 66.61 | 903 | 882 | 182.1 |
| A | 3 | 137 | 8737 | 43.14 | 903 | 882 | 182.1 |
| B | 12 | 111 | 21616 | 118.39 | 908 | 885 | 175.1 |
| B | 11 | 111 | 19092 | 103.98 | 908 | 885 | 175.1 |
| B | 14 | 111 | 17328 | 93.9 | 908 | 885 | 175.1 |
| C | 4 | 254 | 1484242 | 7497.99 | 840 | 844 | 197.8 |
| C | 14 | 238 | 131574 | 660.79 | 840 | 844 | 197.8 |
| C | 3 | 233 | 64760 | 323.07 | 840 | 844 | 197.8 |
| D | 1 | 52 | 7134641 | 40821.45 | 731 | 712 | 174.8 |
| D | 13 | 168 | 158876 | 905.04 | 731 | 712 | 174.8 |
| D | 12 | 233 | 31387 | 175.53 | 731 | 712 | 174.8 |
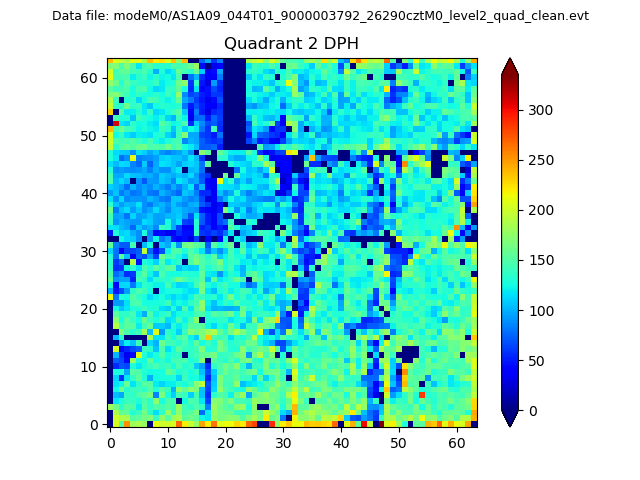
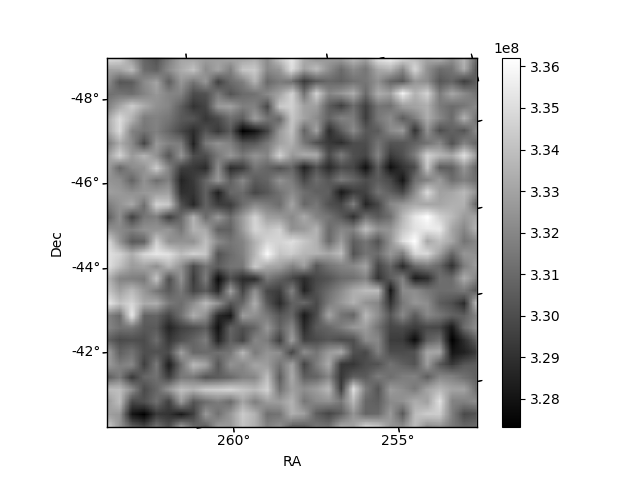
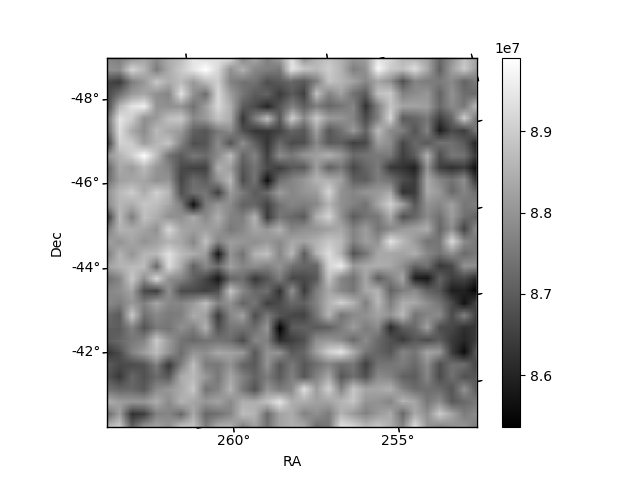
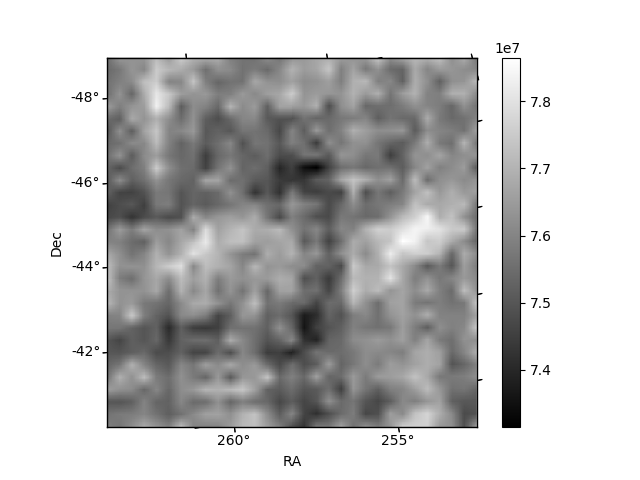
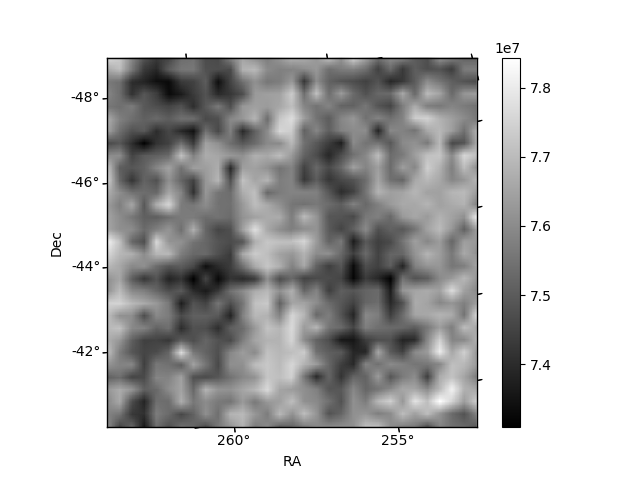
Histogram calculated using DETX and DETY for each event in the final _common_clean file
| Quadrant A | 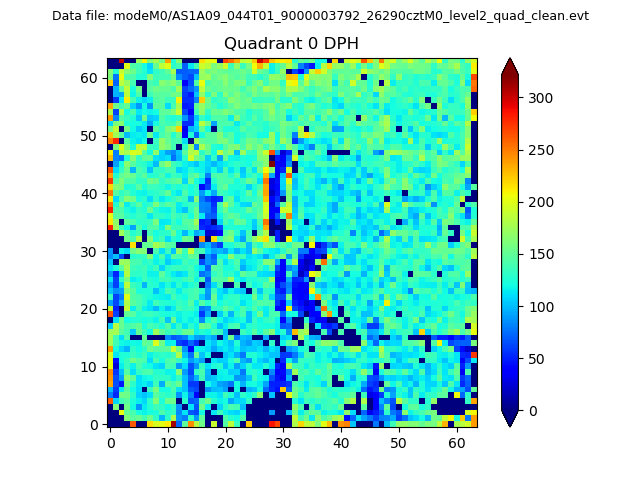 |
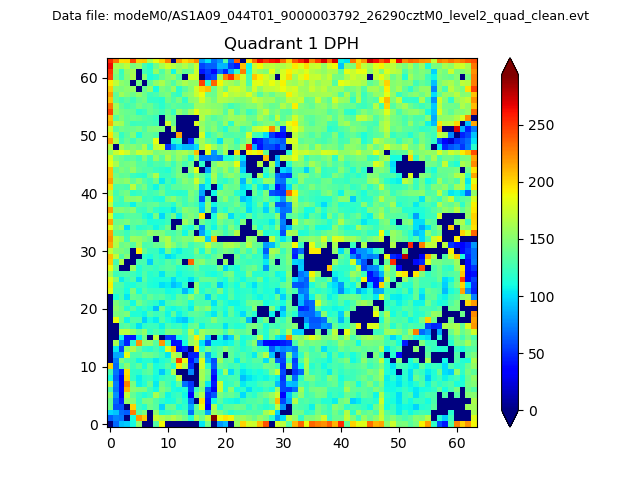 |
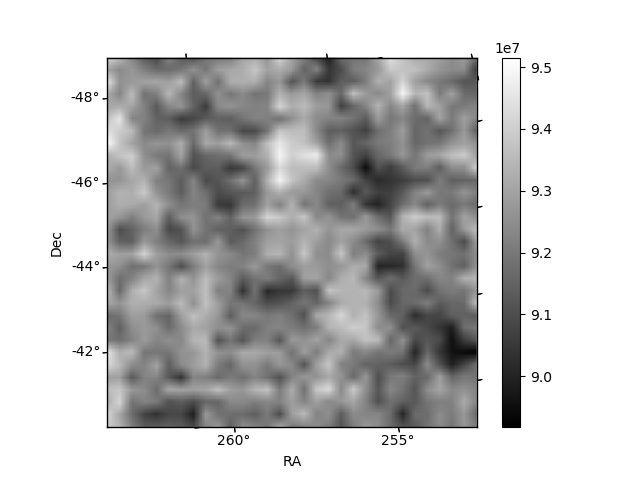
Quadrant B |
|---|---|---|---|
| Quadrant D | 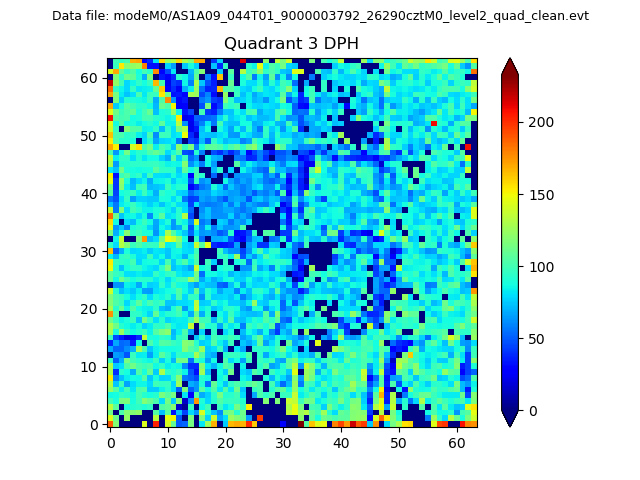 |
 |
Quadrant C |
| Plot type | Count rate plots | Images |
|---|---|---|
| Comparison with Poisson distribution Blue bars denote a histogram of data divided into 1 sec bins. Red curve is a Poisson curve with rate = median count rate of data. |
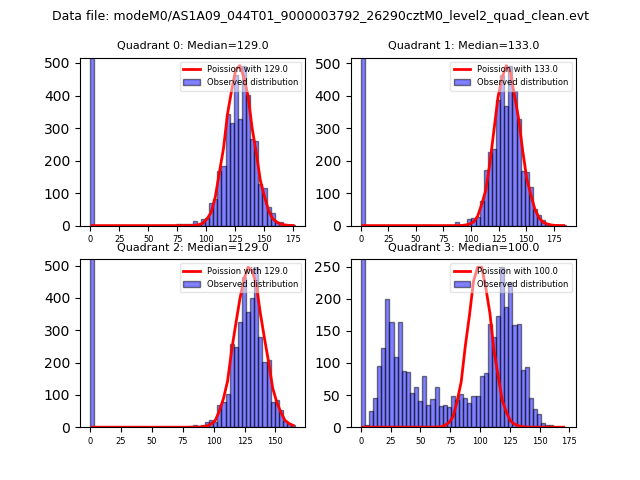 |
 |
| Quadrant-wise count rates Data is divided into 100 sec bins |
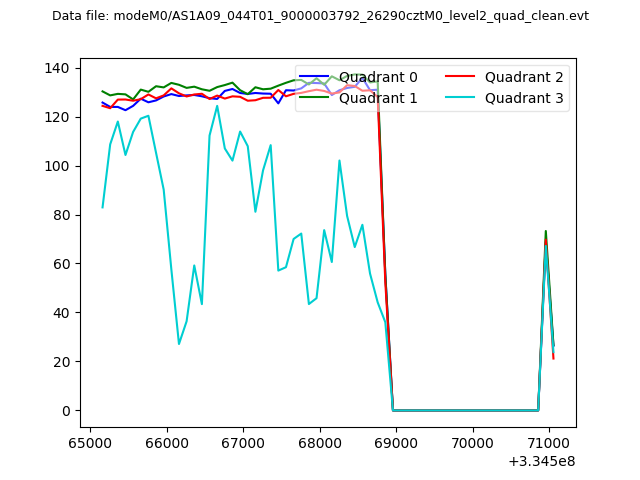 |
|
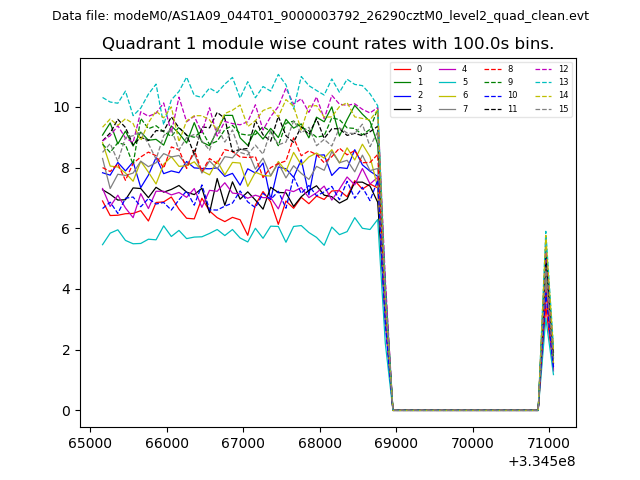
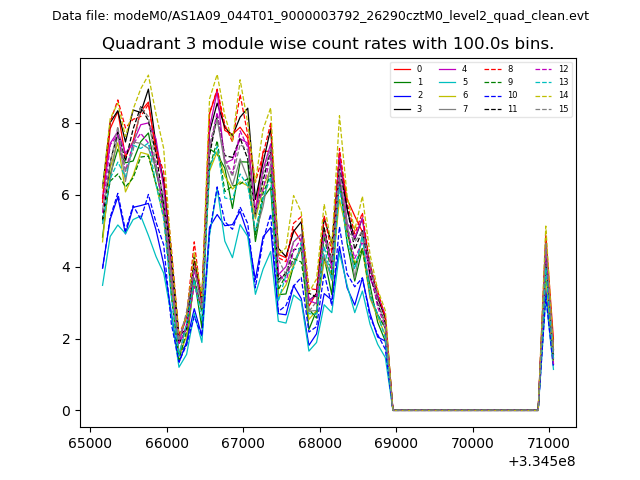
| Module-wise count rates for Quadrant A Data is divided into 100 sec bins |
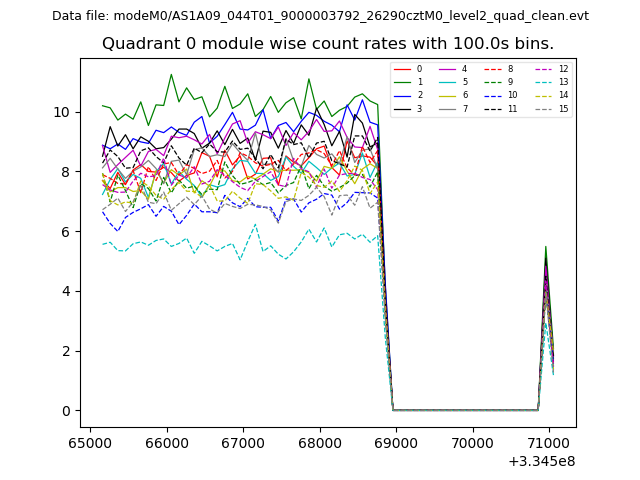 |
 |
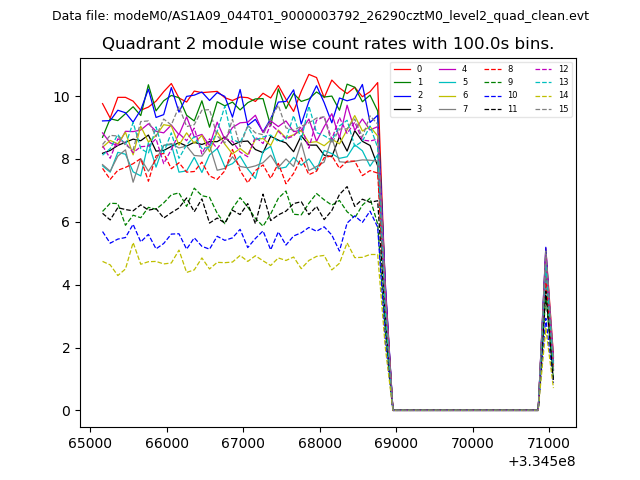
| Module-wise count rates for Quadrant B Data is divided into 100 sec bins |
 |
 |
| Module-wise count rates for Quadrant C Data is divided into 100 sec bins |
 |
 |
| Module-wise count rates for Quadrant D Data is divided into 100 sec bins |
 |
 |
| Parameter | Plot |
|---|---|
| CZT HV Monitor | 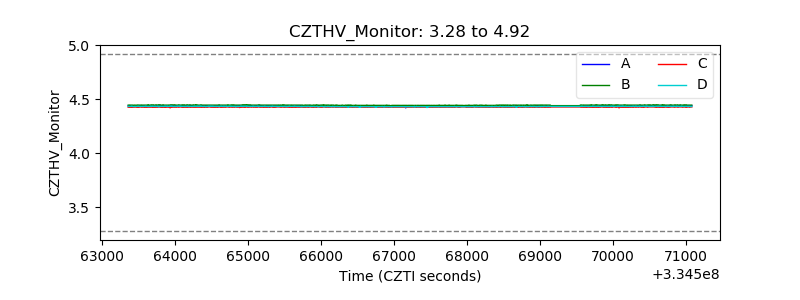 |
| D_VDD | 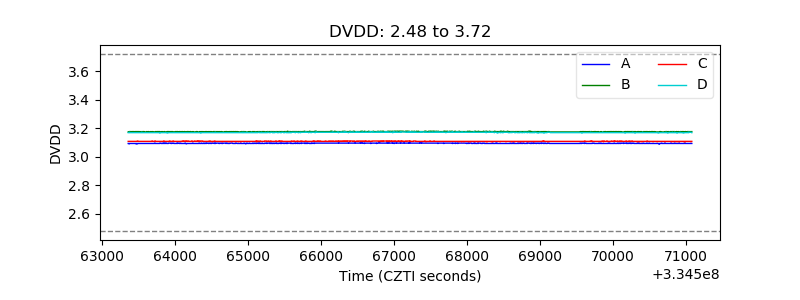 |
| Temperature 1 | 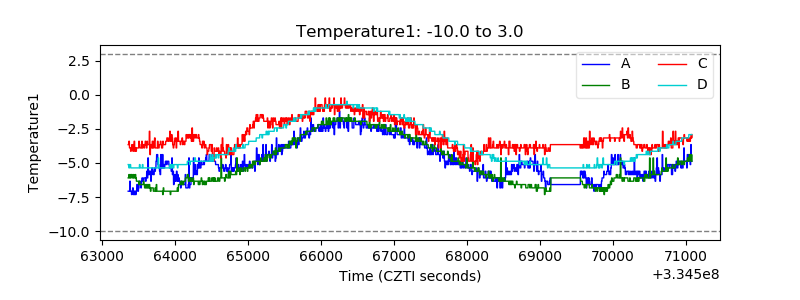 |
| Veto HV Monitor | 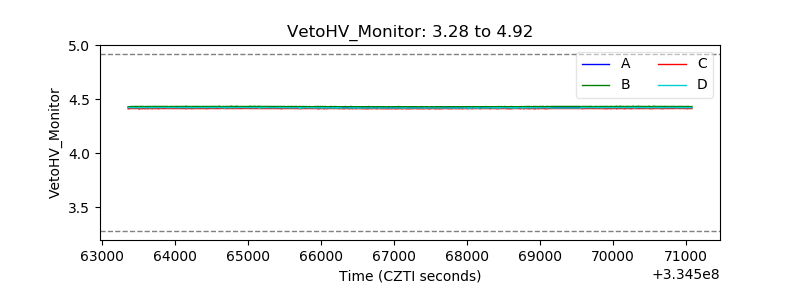 |
| Veto LLD | 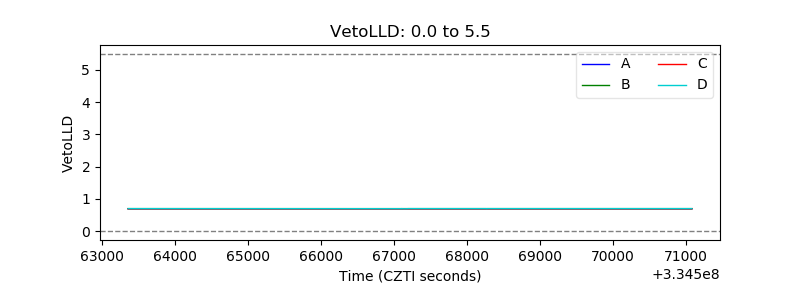 |
| Alpha Counter | 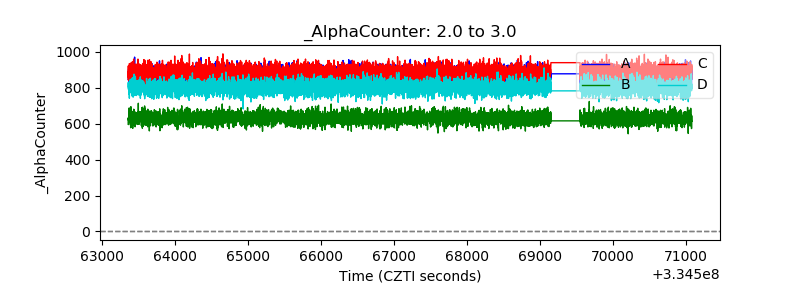 |
| _CPM_Rate | 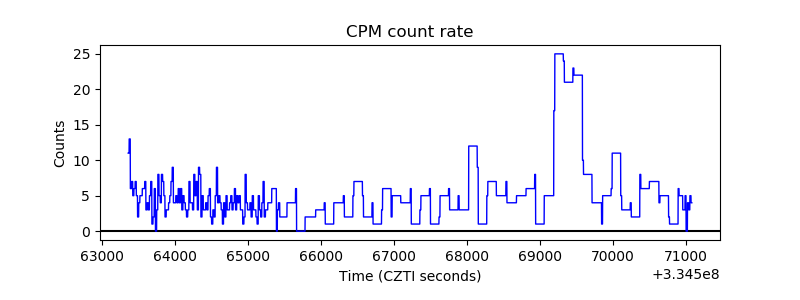 |
| CZT Counter | 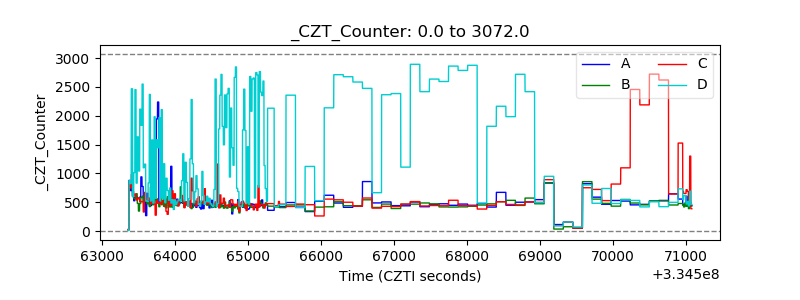 |
| +2.5 Volts monitor |  |
| +5 Volts monitor | 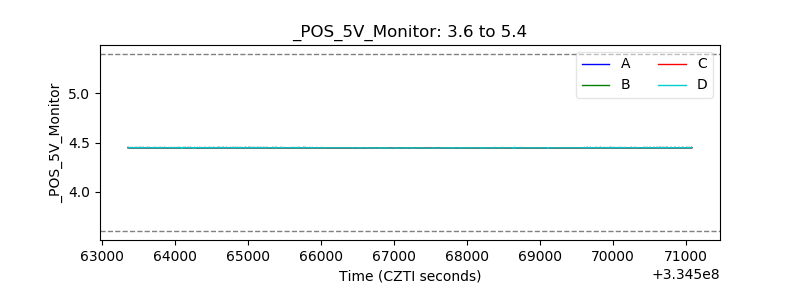 |
| _ROLL_ROT | 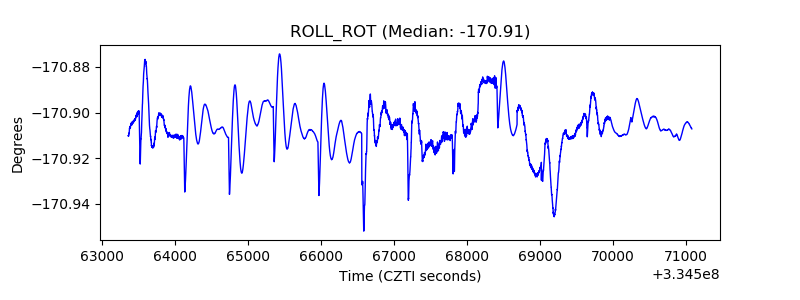 |
| _Roll_DEC | 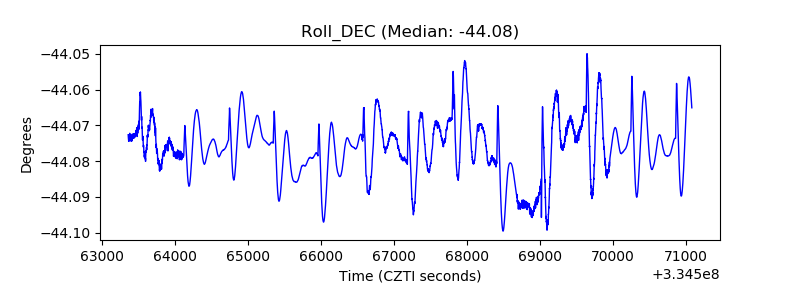 |
| _Roll_RA | 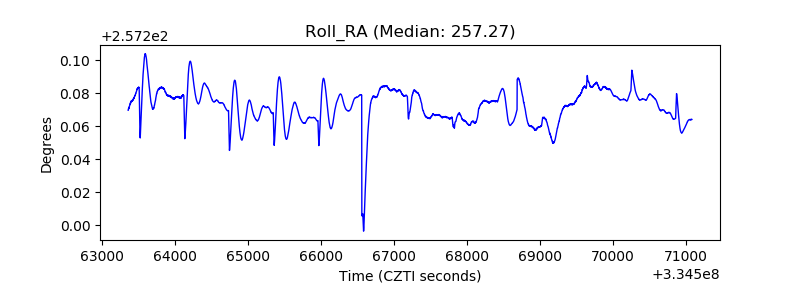 |
| Veto Counter | 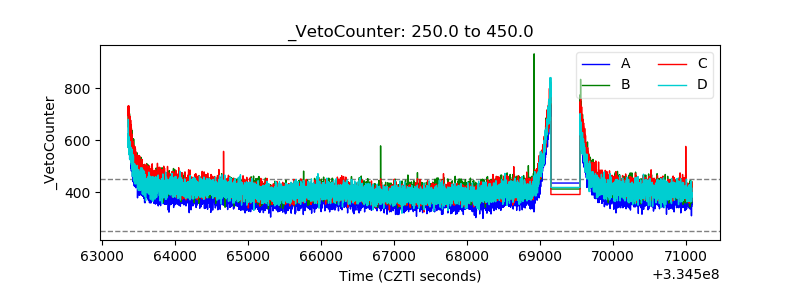 |