| Param | Original file | Final file |
|---|---|---|
| Filename | modeM0/AS1A09_044T01_9000003792_26291cztM0_level2.evt | modeM0/AS1A09_044T01_9000003792_26291cztM0_level2_quad_clean.evt |
| Size (bytes) | 656,305,920 | 87,376,320 |
| Size | 625.9 MB | 83.3 MB |
| Events in quadrant A | 3,803,228 | 548,616 |
| Events in quadrant B | 3,706,527 | 560,404 |
| Events in quadrant C | 5,575,092 | 532,149 |
| Events in quadrant D | 6,272,915 | 472,465 |
| Mode M0 | |||
|---|---|---|---|
| Quadrant | BADHDUFLAG | Total packets | Discarded packets |
| A | 0 | 16132 | 0 |
| B | 0 | 15850 | 0 |
| C | 0 | 21417 | 0 |
| D | 0 | 23682 | 0 |
| Mode M9 | |||
|---|---|---|---|
| Quadrant | BADHDUFLAG | Total packets | Discarded packets |
| A | 0 | 3 | 0 |
| B | 0 | 4 | 0 |
| C | 0 | 4 | 0 |
| D | 0 | 4 | 0 |
| Quadrant | Total seconds | Saturated seconds | Saturation percentage |
|---|---|---|---|
| A | 7640 | 210 | 2.748691% |
| B | 7640 | 217 | 2.840314% |
| C | 7640 | 997 | 13.049738% |
| D | 7640 | 1116 | 14.607330% |
Noise dominated data is calculated using 1-second bins in cleaned event files. If a bin has >2000 counts, and if more than 50% of those come from <1% of pixels, then it is considered to be noise-dominated and hence unusable.
| Quadrant | # 1 sec bins | Bins with >0 counts | Bins with >2000 counts | High rate bins dominated by noise | Noise dominated (total time) | Noise dominated (detector-on time) | Marked lightcurve |
|---|---|---|---|---|---|---|---|
| A | 7880 | 7641 | 6 | 6 | 0.08% | 0.08% | 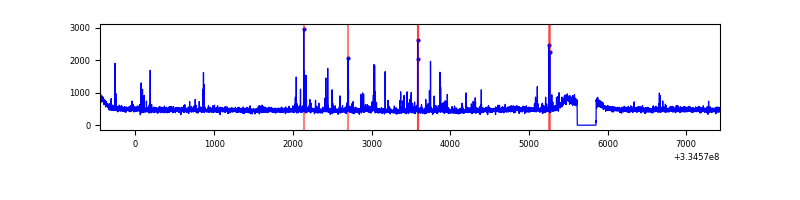 |
| B | 7880 | 7641 | 2 | 2 | 0.03% | 0.03% | 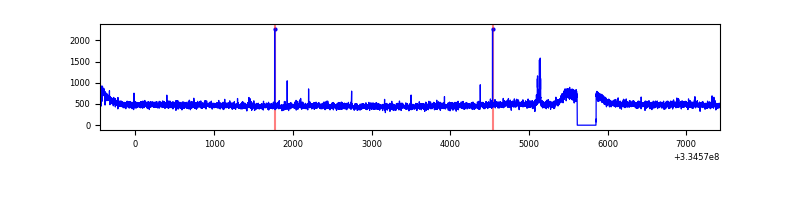 |
| C | 7880 | 7641 | 434 | 434 | 5.51% | 5.68% | 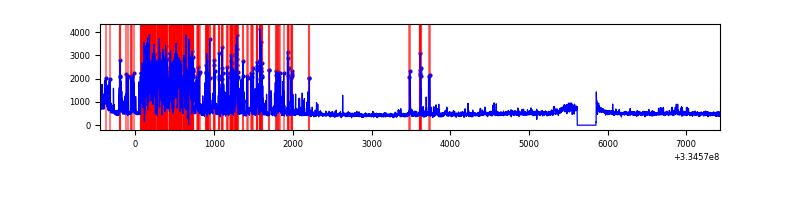 |
| D | 7880 | 7641 | 898 | 898 | 11.40% | 11.75% | 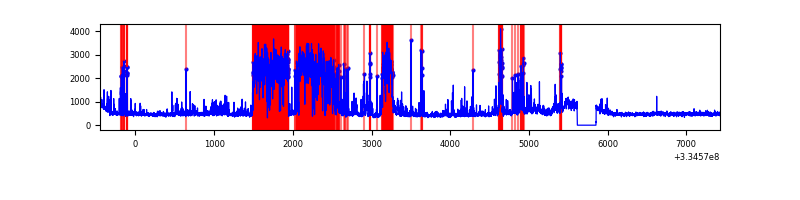 |
Top three noisy pixels from each quadrant. If the there are fewer than three noisy pixels in the level2.evt file, extra rows are filled as -1
| Pixel properties | Quadrant properties | ||||||
|---|---|---|---|---|---|---|---|
| Quadrant | DetID | PixID | Counts | Sigma | Mean | Median | Sigma |
| A | 0 | 13 | 169175 | 882.0 | 942 | 921 | 190.8 |
| A | 13 | 254 | 12499 | 60.69 | 942 | 921 | 190.8 |
| A | 3 | 137 | 9171 | 43.25 | 942 | 921 | 190.8 |
| B | 0 | 230 | 27625 | 147.89 | 939 | 915 | 180.6 |
| B | 12 | 111 | 22363 | 118.75 | 939 | 915 | 180.6 |
| B | 11 | 111 | 20247 | 107.04 | 939 | 915 | 180.6 |
| C | 4 | 254 | 1940860 | 9569.3 | 868 | 871 | 202.7 |
| C | 14 | 238 | 136418 | 668.61 | 868 | 871 | 202.7 |
| C | 3 | 233 | 99138 | 484.72 | 868 | 871 | 202.7 |
| D | 12 | 233 | 2179728 | 10425.93 | 870 | 849 | 209.0 |
| D | 1 | 52 | 707513 | 3381.38 | 870 | 849 | 209.0 |
| D | 6 | 17 | 34607 | 161.53 | 870 | 849 | 209.0 |
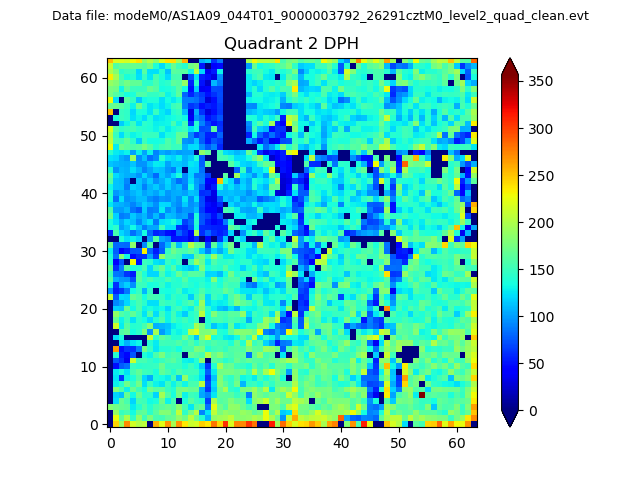
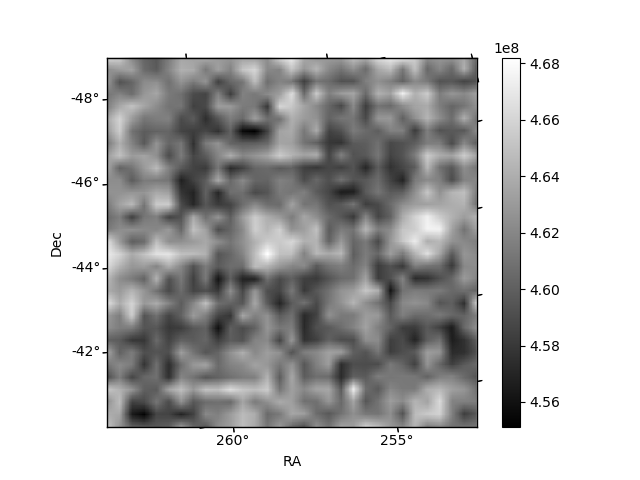
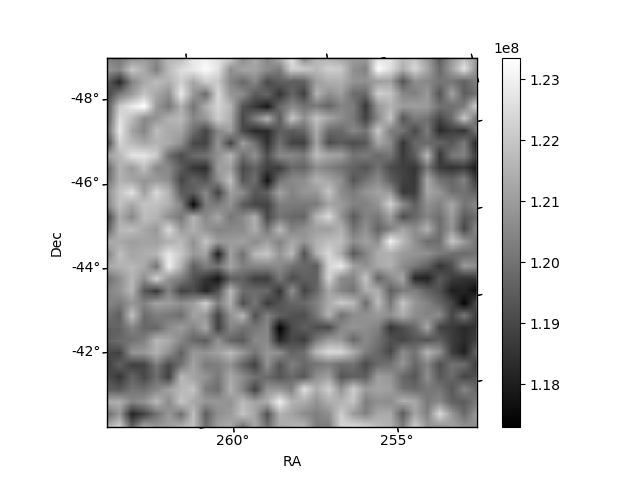
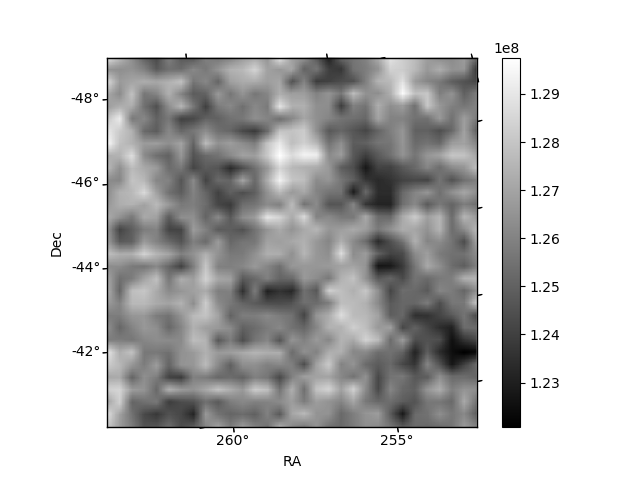
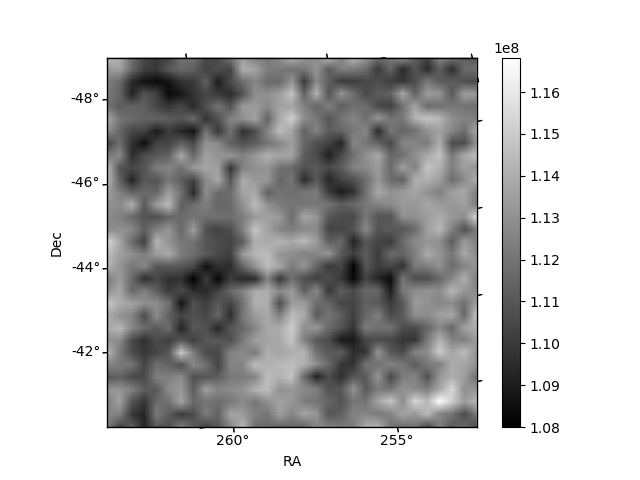
Histogram calculated using DETX and DETY for each event in the final _common_clean file
| Quadrant A | 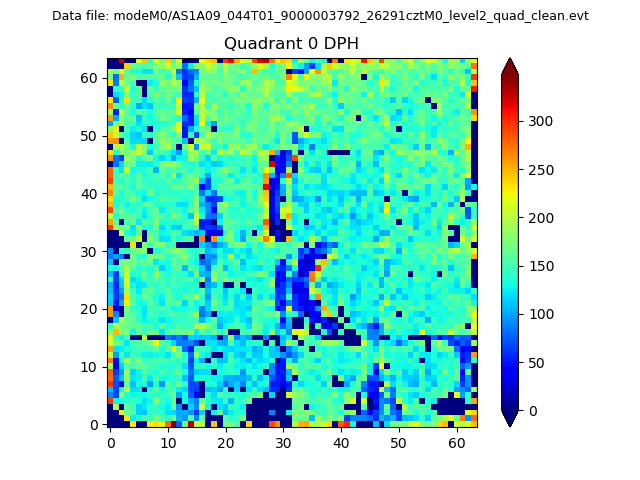 |
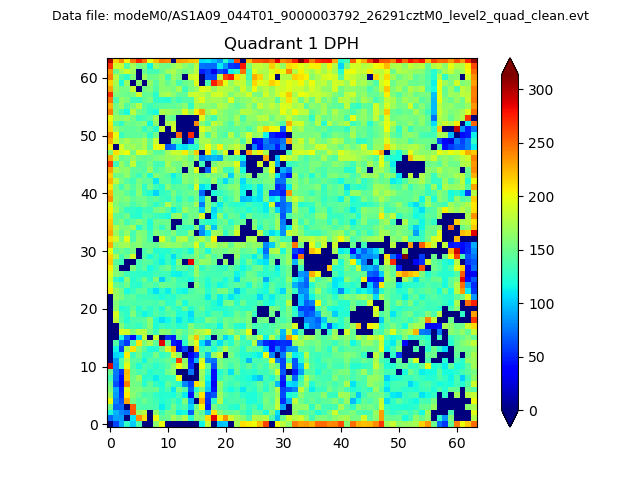 |
Quadrant B |
|---|---|---|---|
| Quadrant D | 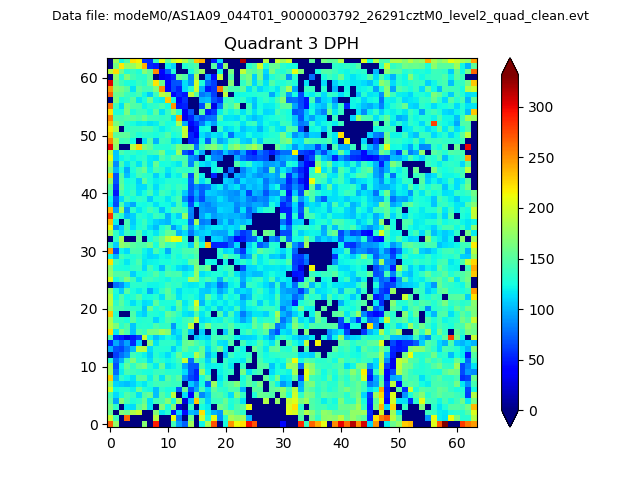 |
 |
Quadrant C |
| Plot type | Count rate plots | Images |
|---|---|---|
| Comparison with Poisson distribution Blue bars denote a histogram of data divided into 1 sec bins. Red curve is a Poisson curve with rate = median count rate of data. |
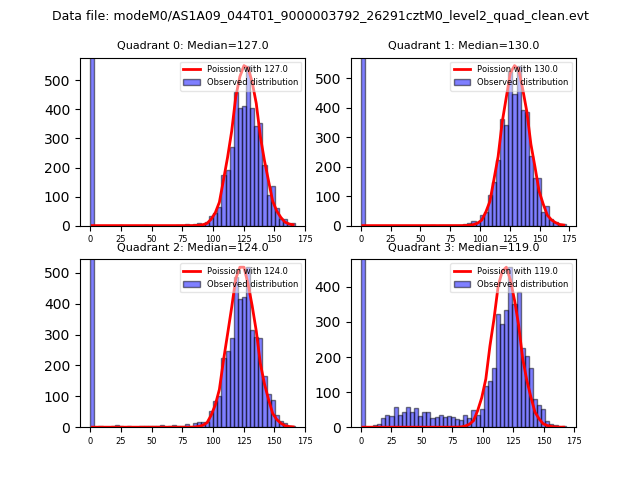 |
 |
| Quadrant-wise count rates Data is divided into 100 sec bins |
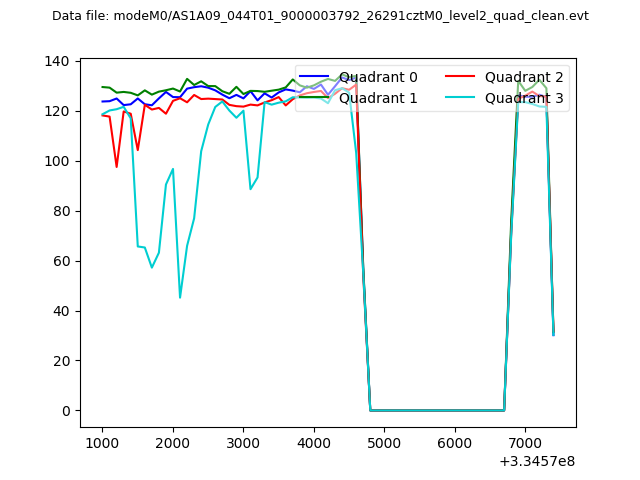 |
|
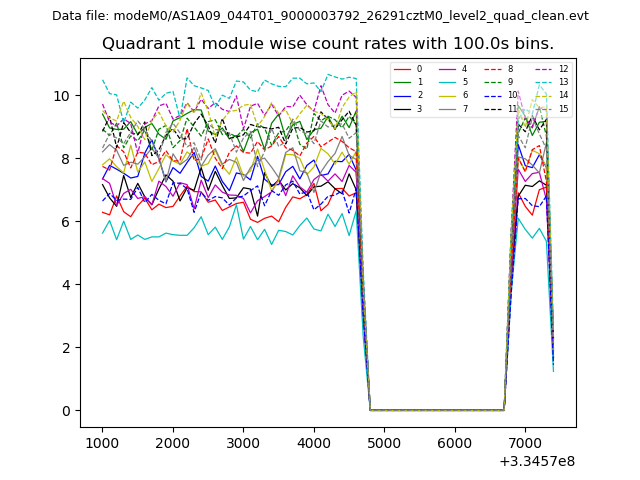
| Module-wise count rates for Quadrant A Data is divided into 100 sec bins |
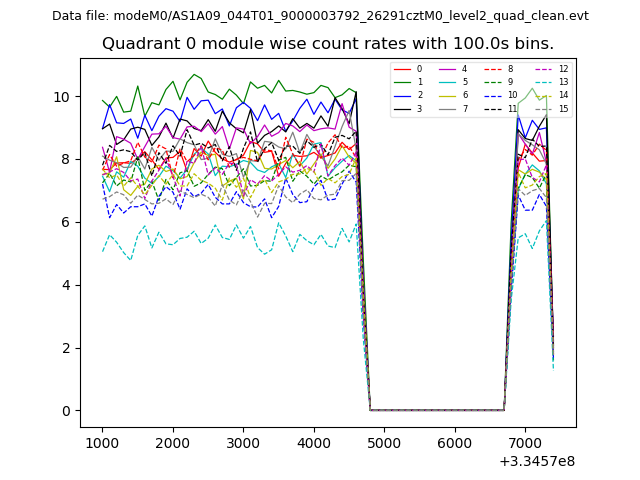 |
 |
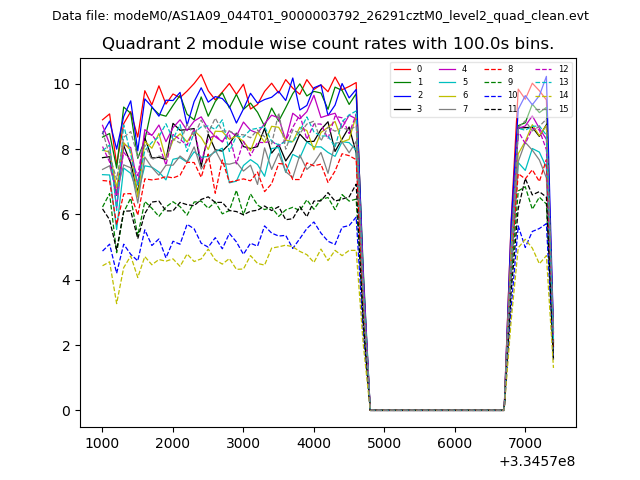
| Module-wise count rates for Quadrant B Data is divided into 100 sec bins |
 |
 |
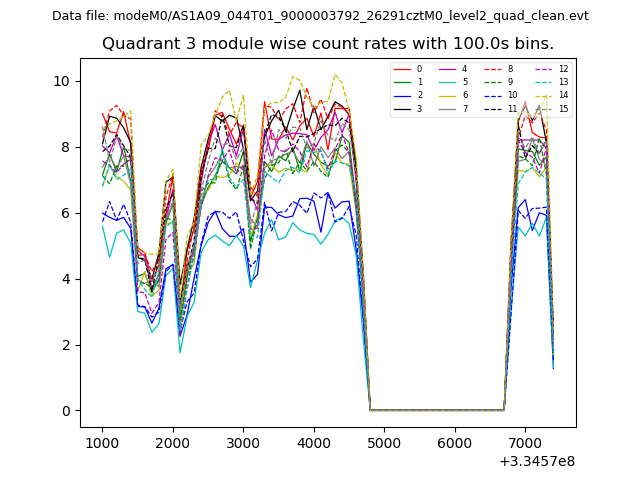
| Module-wise count rates for Quadrant C Data is divided into 100 sec bins |
 |
 |
| Module-wise count rates for Quadrant D Data is divided into 100 sec bins |
 |
 |
| Parameter | Plot |
|---|---|
| CZT HV Monitor | 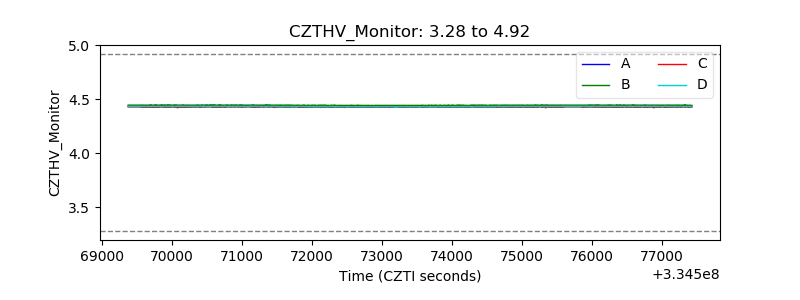 |
| D_VDD | 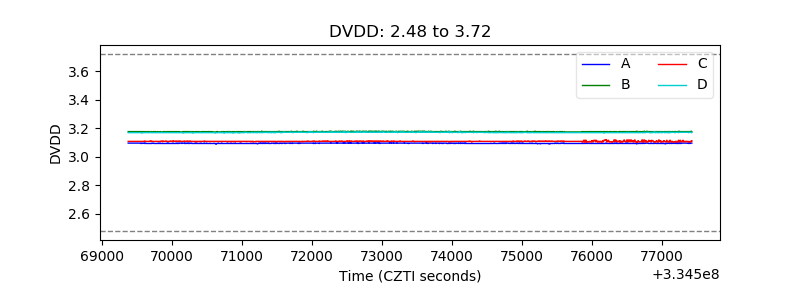 |
| Temperature 1 |  |
| Veto HV Monitor | 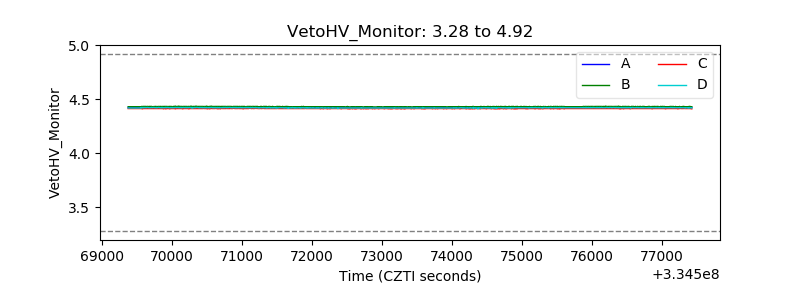 |
| Veto LLD | 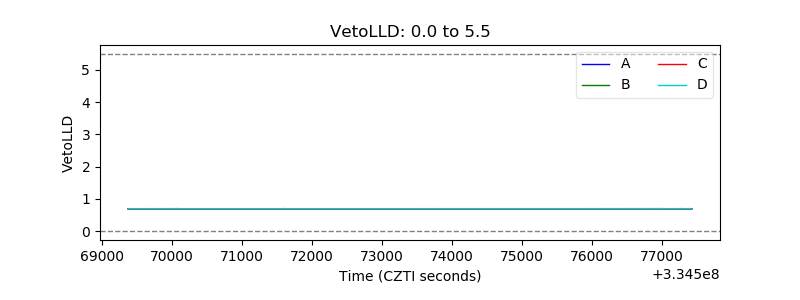 |
| Alpha Counter | 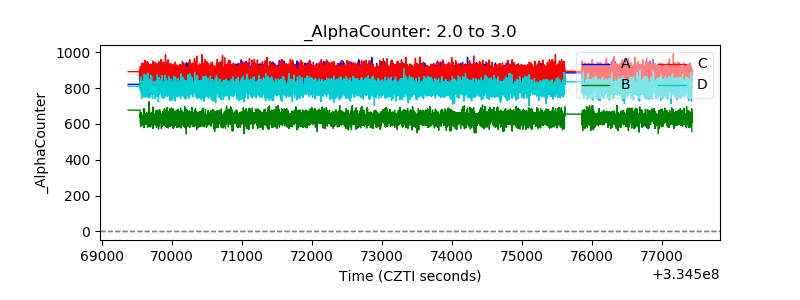 |
| _CPM_Rate | 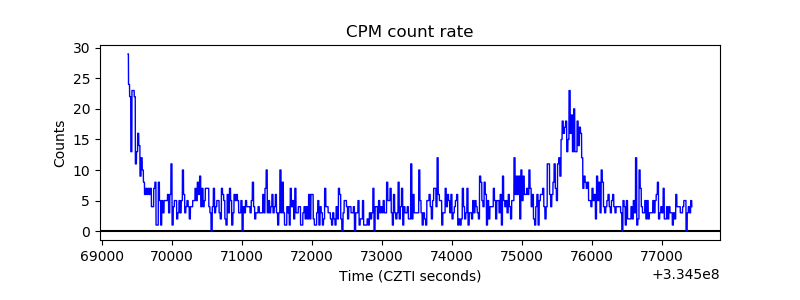 |
| CZT Counter | 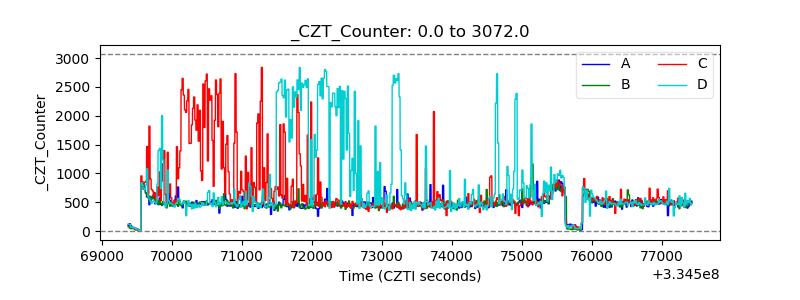 |
| +2.5 Volts monitor |  |
| +5 Volts monitor |  |
| _ROLL_ROT |  |
| _Roll_DEC | 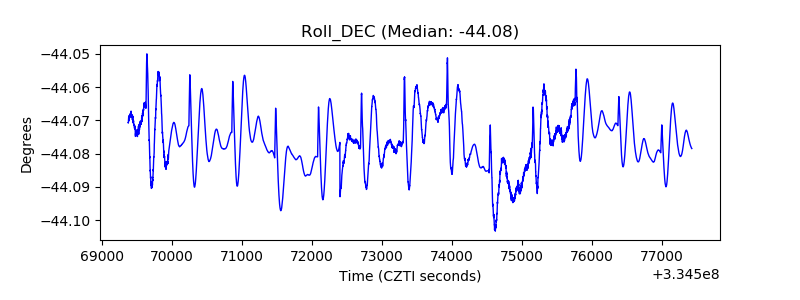 |
| _Roll_RA | 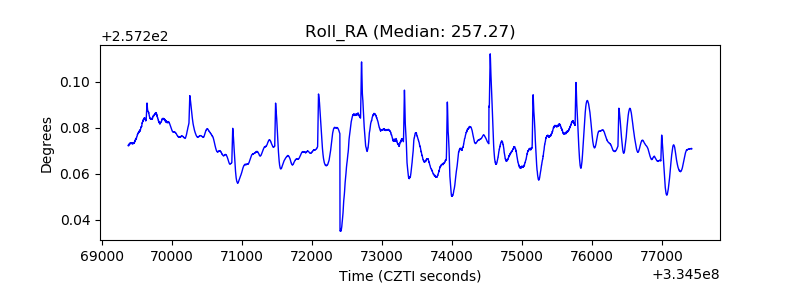 |
| Veto Counter | 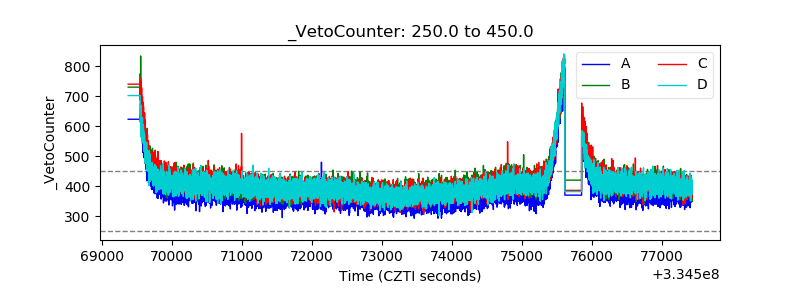 |