| Param | Original file | Final file |
|---|---|---|
| Filename | modeM0/AS1A09_044T01_9000003792_26292cztM0_level2.evt | modeM0/AS1A09_044T01_9000003792_26292cztM0_level2_quad_clean.evt |
| Size (bytes) | 564,292,800 | 97,626,240 |
| Size | 538.2 MB | 93.1 MB |
| Events in quadrant A | 4,164,698 | 605,900 |
| Events in quadrant B | 3,738,498 | 626,366 |
| Events in quadrant C | 4,118,609 | 602,108 |
| Events in quadrant D | 4,546,053 | 587,575 |
| Mode M0 | |||
|---|---|---|---|
| Quadrant | BADHDUFLAG | Total packets | Discarded packets |
| A | 0 | 17227 | 0 |
| B | 0 | 15888 | 0 |
| C | 0 | 16978 | 0 |
| D | 0 | 18450 | 0 |
| Mode M9 | |||
|---|---|---|---|
| Quadrant | BADHDUFLAG | Total packets | Discarded packets |
| A | 0 | 6 | 0 |
| B | 0 | 6 | 0 |
| C | 0 | 6 | 0 |
| D | 0 | 6 | 0 |
| Quadrant | Total seconds | Saturated seconds | Saturation percentage |
|---|---|---|---|
| A | 7683 | 305 | 3.969803% |
| B | 7683 | 234 | 3.045685% |
| C | 7683 | 325 | 4.230118% |
| D | 7684 | 403 | 5.244664% |
Noise dominated data is calculated using 1-second bins in cleaned event files. If a bin has >2000 counts, and if more than 50% of those come from <1% of pixels, then it is considered to be noise-dominated and hence unusable.
| Quadrant | # 1 sec bins | Bins with >0 counts | Bins with >2000 counts | High rate bins dominated by noise | Noise dominated (total time) | Noise dominated (detector-on time) | Marked lightcurve |
|---|---|---|---|---|---|---|---|
| A | 8318 | 7685 | 67 | 67 | 0.81% | 0.87% | 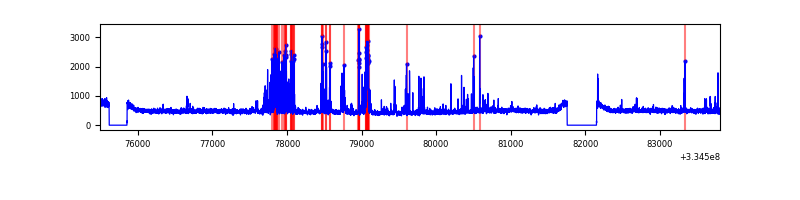 |
| B | 8318 | 7685 | 0 | 0 | 0.00% | 0.00% | 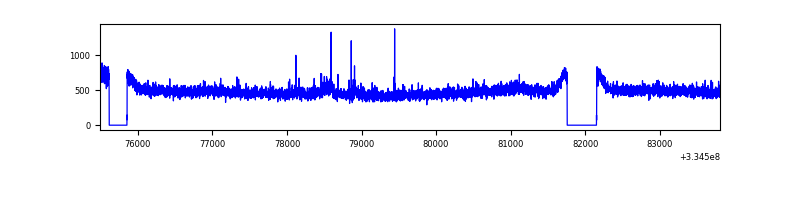 |
| C | 8318 | 7685 | 28 | 28 | 0.34% | 0.36% |  |
| D | 8319 | 7686 | 165 | 165 | 1.98% | 2.15% | 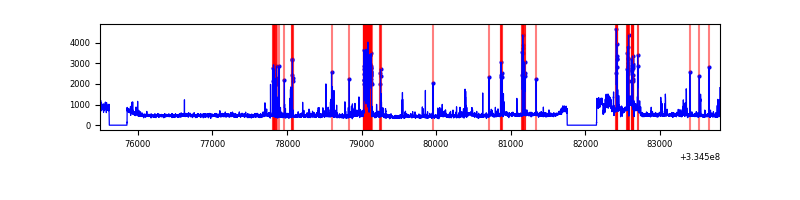 |
Top three noisy pixels from each quadrant. If the there are fewer than three noisy pixels in the level2.evt file, extra rows are filled as -1
| Pixel properties | Quadrant properties | ||||||
|---|---|---|---|---|---|---|---|
| Quadrant | DetID | PixID | Counts | Sigma | Mean | Median | Sigma |
| A | 0 | 13 | 511287 | 2688.12 | 947 | 925 | 189.9 |
| A | 13 | 254 | 12725 | 62.15 | 947 | 925 | 189.9 |
| A | 3 | 137 | 8993 | 42.49 | 947 | 925 | 189.9 |
| B | 0 | 230 | 29095 | 153.77 | 947 | 922 | 183.2 |
| B | 12 | 111 | 22468 | 117.6 | 947 | 922 | 183.2 |
| B | 11 | 111 | 20298 | 105.75 | 947 | 922 | 183.2 |
| C | 4 | 254 | 319054 | 1480.52 | 914 | 917 | 214.9 |
| C | 14 | 238 | 142869 | 660.61 | 914 | 917 | 214.9 |
| C | 3 | 233 | 70323 | 323.0 | 914 | 917 | 214.9 |
| D | 1 | 52 | 660368 | 3003.27 | 916 | 891 | 219.6 |
| D | 12 | 233 | 280179 | 1271.88 | 916 | 891 | 219.6 |
| D | 11 | 176 | 47007 | 210.01 | 916 | 891 | 219.6 |
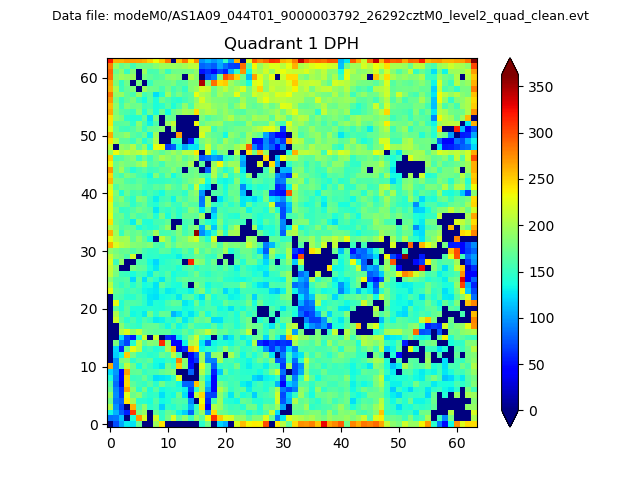
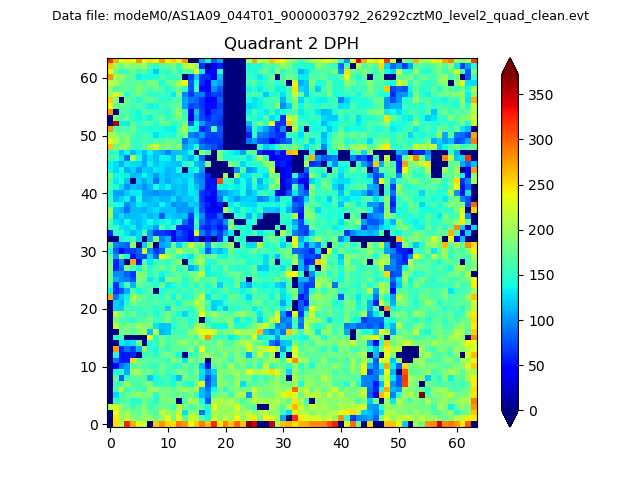
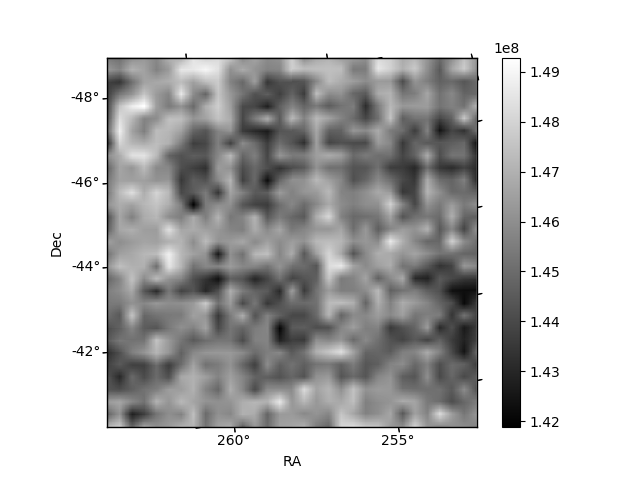
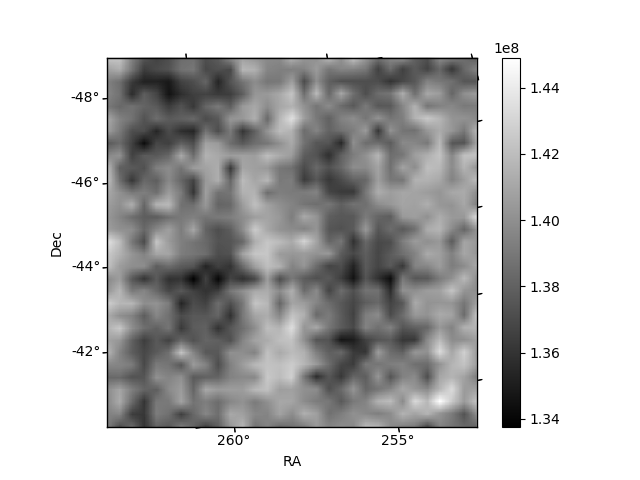
Histogram calculated using DETX and DETY for each event in the final _common_clean file
| Quadrant A | 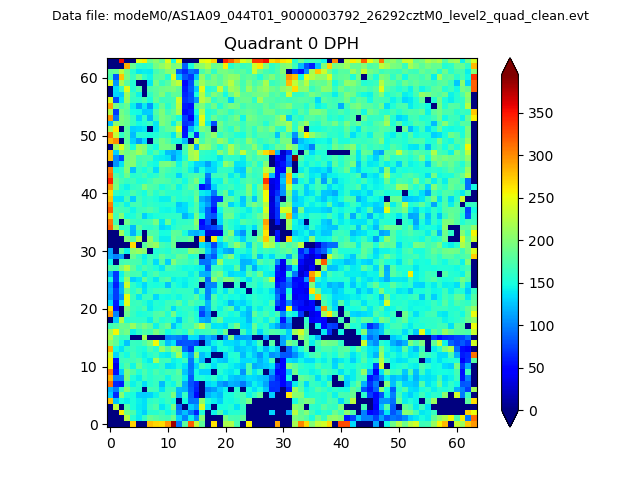 |
 |
Quadrant B |
|---|---|---|---|
| Quadrant D |  |
 |
Quadrant C |
| Plot type | Count rate plots | Images |
|---|---|---|
| Comparison with Poisson distribution Blue bars denote a histogram of data divided into 1 sec bins. Red curve is a Poisson curve with rate = median count rate of data. |
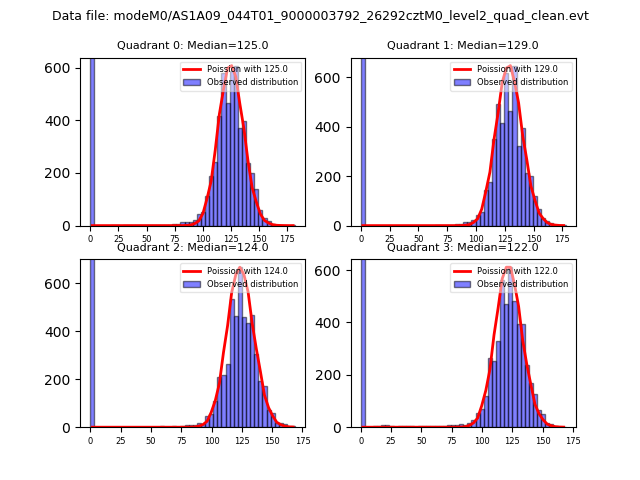 |
 |
| Quadrant-wise count rates Data is divided into 100 sec bins |
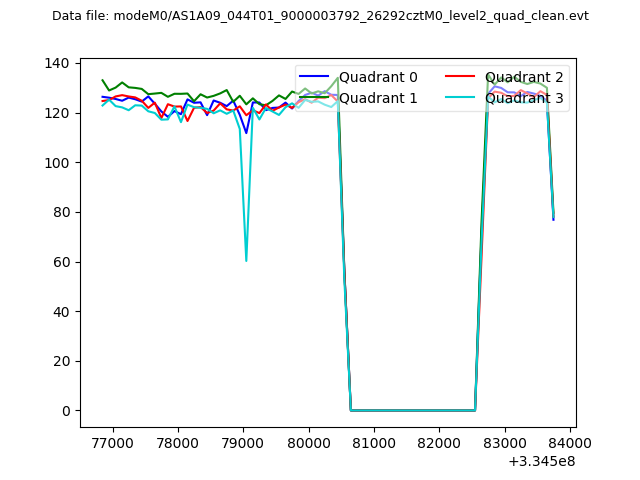 |
|
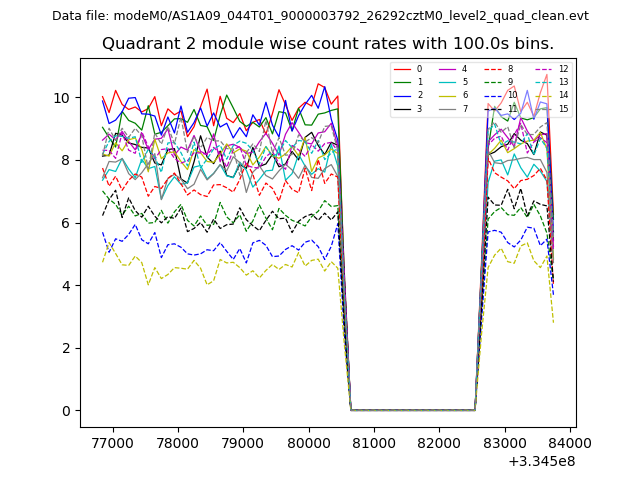
| Module-wise count rates for Quadrant A Data is divided into 100 sec bins |
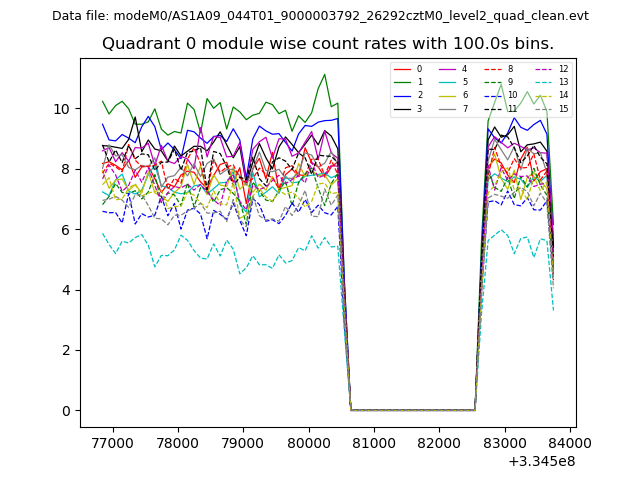 |
 |
| Module-wise count rates for Quadrant B Data is divided into 100 sec bins |
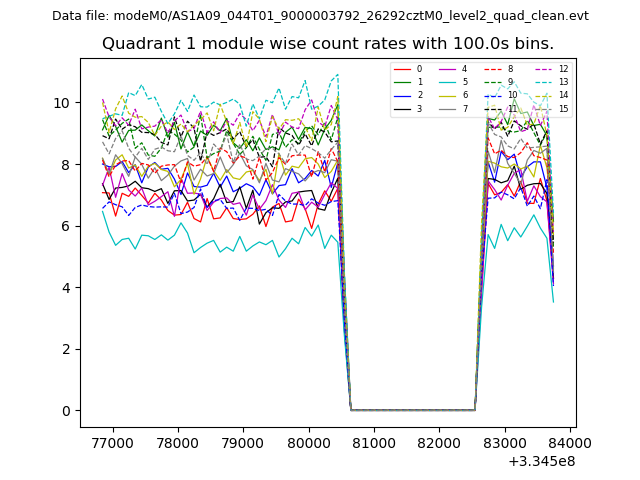 |
 |
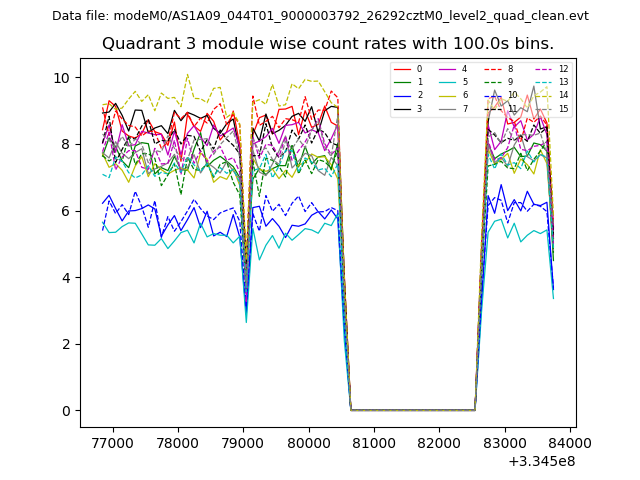
| Module-wise count rates for Quadrant C Data is divided into 100 sec bins |
 |
 |
| Module-wise count rates for Quadrant D Data is divided into 100 sec bins |
 |
 |
| Parameter | Plot |
|---|---|
| CZT HV Monitor | 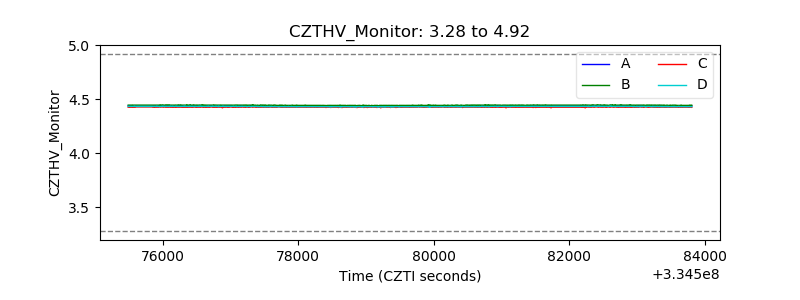 |
| D_VDD | 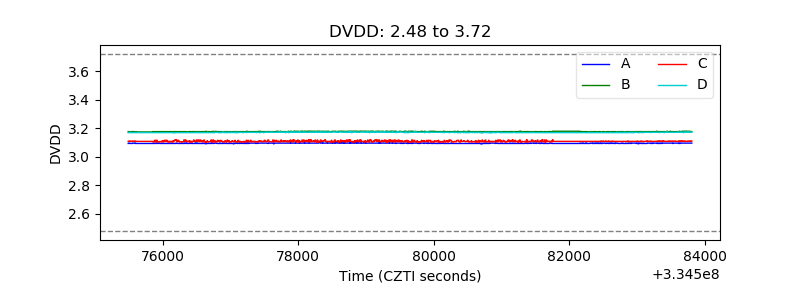 |
| Temperature 1 | 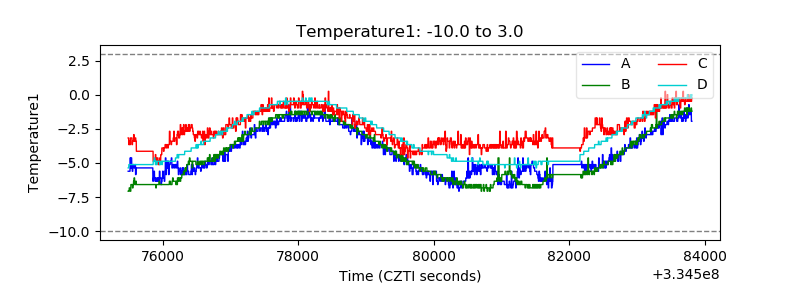 |
| Veto HV Monitor | 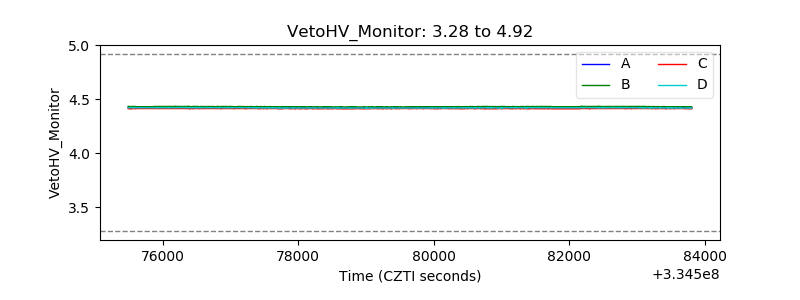 |
| Veto LLD | 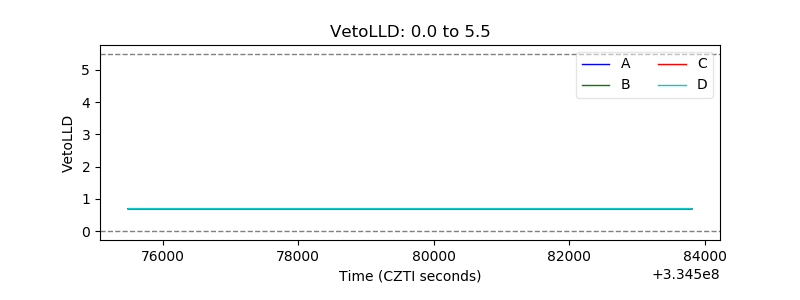 |
| Alpha Counter | 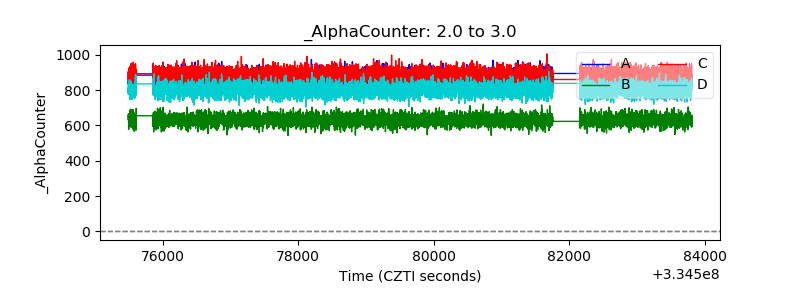 |
| _CPM_Rate | 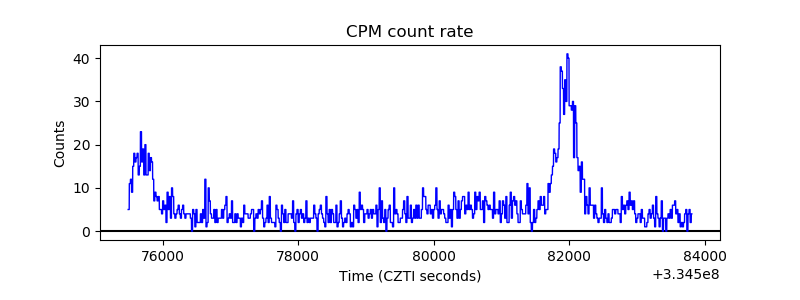 |
| CZT Counter |  |
| +2.5 Volts monitor |  |
| +5 Volts monitor |  |
| _ROLL_ROT | 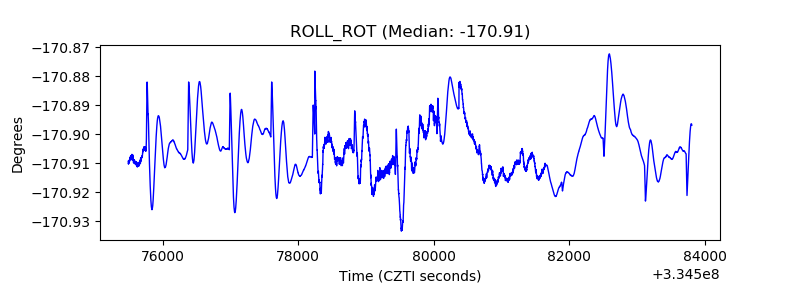 |
| _Roll_DEC | 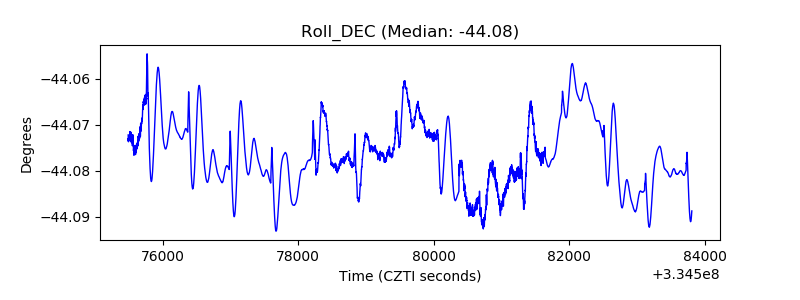 |
| _Roll_RA | 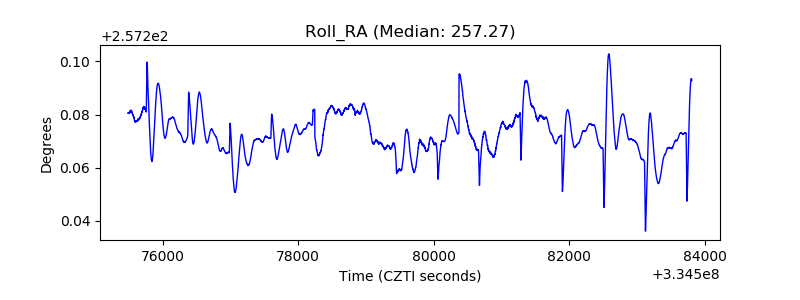 |
| Veto Counter | 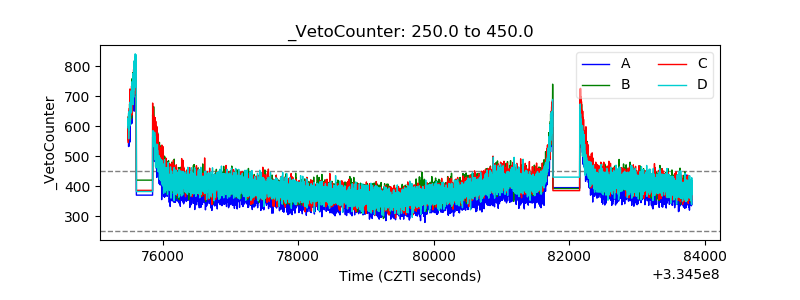 |