| Param | Original file | Final file |
|---|---|---|
| Filename | modeM0/AS1A09_044T01_9000003792_26294cztM0_level2.evt | modeM0/AS1A09_044T01_9000003792_26294cztM0_level2_quad_clean.evt |
| Size (bytes) | 98,853,120 | 26,087,040 |
| Size | 94.3 MB | 24.9 MB |
| Events in quadrant A | 689,611 | 172,728 |
| Events in quadrant B | 650,545 | 178,162 |
| Events in quadrant C | 730,495 | 171,829 |
| Events in quadrant D | 827,506 | 164,980 |
| Mode M0 | |||
|---|---|---|---|
| Quadrant | BADHDUFLAG | Total packets | Discarded packets |
| A | 0 | 2845 | 0 |
| B | 0 | 2736 | 0 |
| C | 0 | 2977 | 0 |
| D | 0 | 3290 | 0 |
| Quadrant | Total seconds | Saturated seconds | Saturation percentage |
|---|---|---|---|
| A | 1360 | 4 | 0.294118% |
| B | 1361 | 1 | 0.073475% |
| C | 1361 | 7 | 0.514328% |
| D | 1361 | 50 | 3.673769% |
Noise dominated data is calculated using 1-second bins in cleaned event files. If a bin has >2000 counts, and if more than 50% of those come from <1% of pixels, then it is considered to be noise-dominated and hence unusable.
| Quadrant | # 1 sec bins | Bins with >0 counts | Bins with >2000 counts | High rate bins dominated by noise | Noise dominated (total time) | Noise dominated (detector-on time) | Marked lightcurve |
|---|---|---|---|---|---|---|---|
| A | 1360 | 1360 | 1 | 1 | 0.07% | 0.07% | 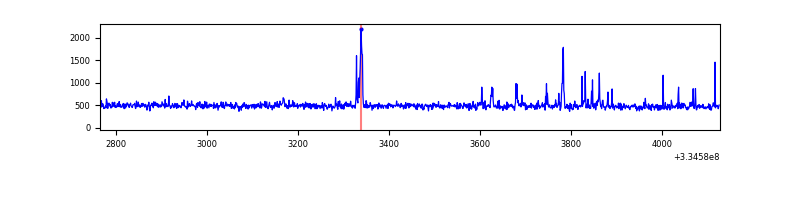 |
| B | 1361 | 1361 | 0 | 0 | 0.00% | 0.00% | 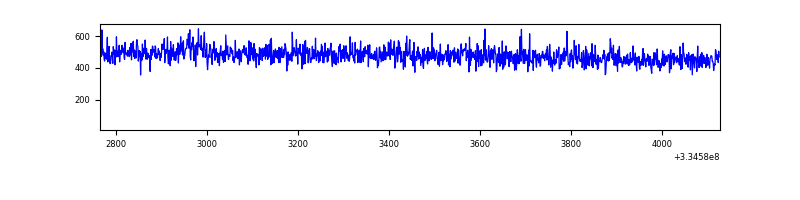 |
| C | 1361 | 1361 | 1 | 1 | 0.07% | 0.07% | 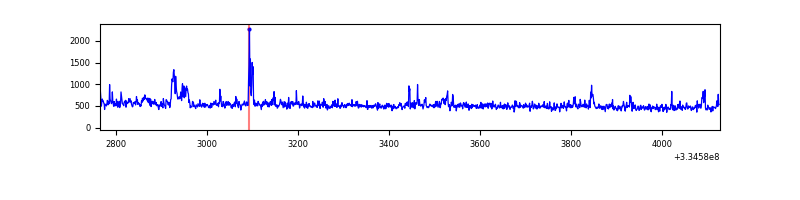 |
| D | 1361 | 1361 | 49 | 49 | 3.60% | 3.60% | 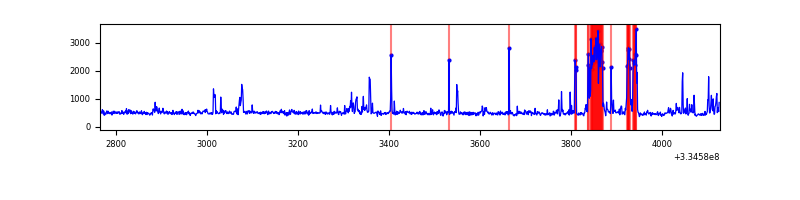 |
Top three noisy pixels from each quadrant. If the there are fewer than three noisy pixels in the level2.evt file, extra rows are filled as -1
| Pixel properties | Quadrant properties | ||||||
|---|---|---|---|---|---|---|---|
| Quadrant | DetID | PixID | Counts | Sigma | Mean | Median | Sigma |
| A | 0 | 13 | 38739 | 1077.06 | 168 | 164 | 35.8 |
| A | 13 | 254 | 2244 | 58.08 | 168 | 164 | 35.8 |
| A | 3 | 137 | 1563 | 39.06 | 168 | 164 | 35.8 |
| B | 12 | 111 | 3747 | 105.81 | 165 | 160 | 33.9 |
| B | 11 | 111 | 3604 | 101.59 | 165 | 160 | 33.9 |
| B | 14 | 111 | 3252 | 91.21 | 165 | 160 | 33.9 |
| C | 3 | 233 | 49127 | 1246.72 | 160 | 161 | 39.3 |
| C | 4 | 254 | 26964 | 682.43 | 160 | 161 | 39.3 |
| C | 14 | 238 | 25375 | 641.97 | 160 | 161 | 39.3 |
| D | 12 | 233 | 134788 | 3365.2 | 161 | 157 | 40.0 |
| D | 11 | 176 | 32666 | 812.59 | 161 | 157 | 40.0 |
| D | 1 | 52 | 24724 | 614.07 | 161 | 157 | 40.0 |
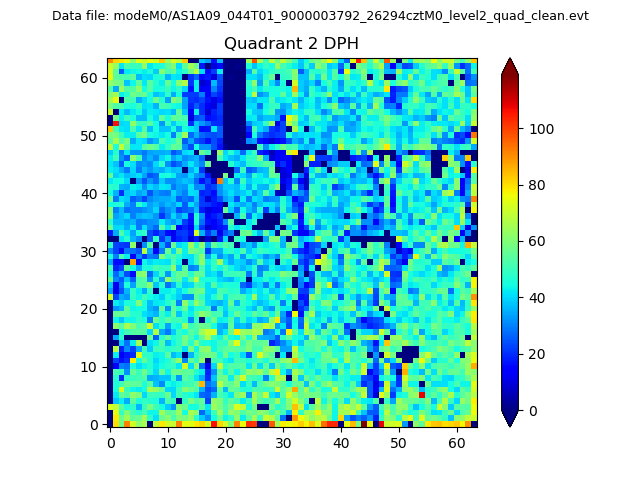
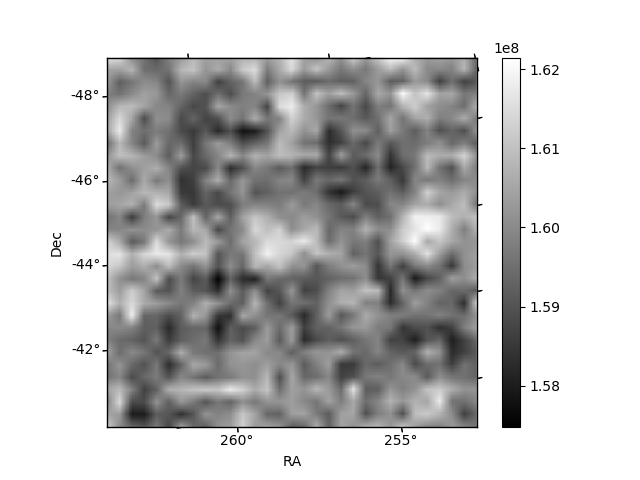
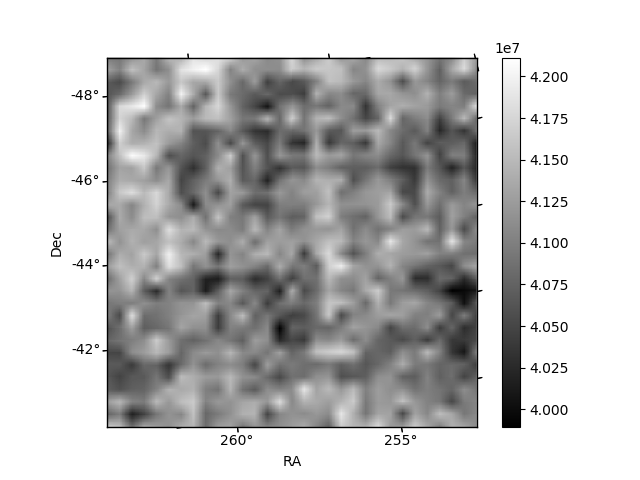
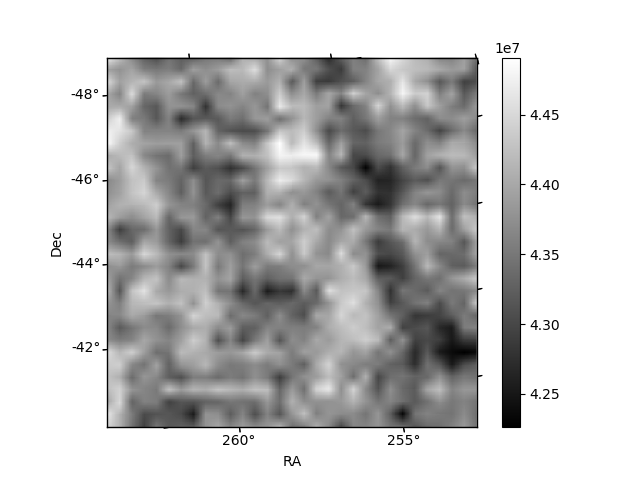
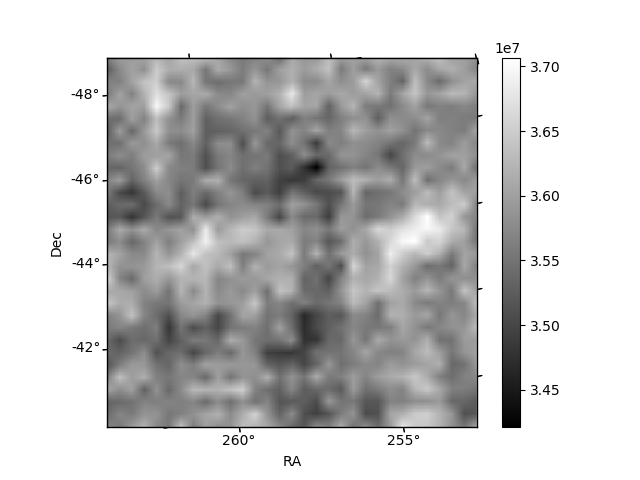
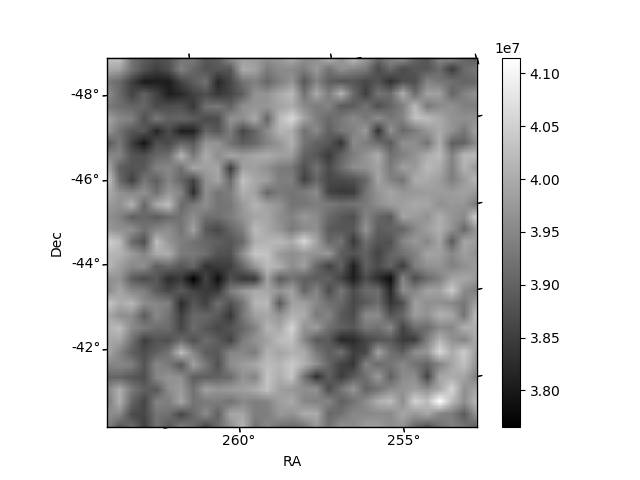
Histogram calculated using DETX and DETY for each event in the final _common_clean file
| Quadrant A | 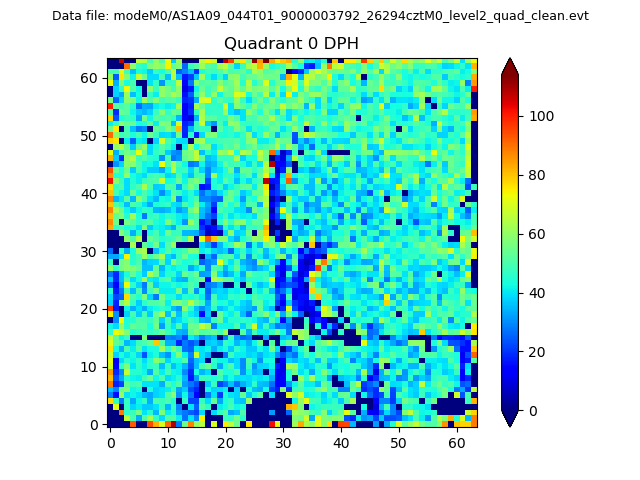 |
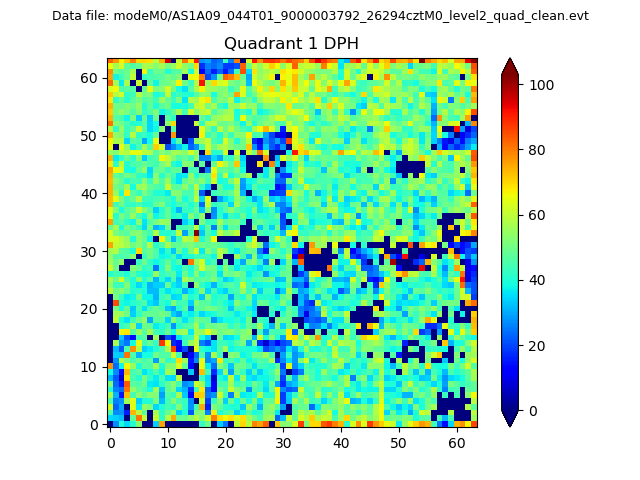 |
Quadrant B |
|---|---|---|---|
| Quadrant D | 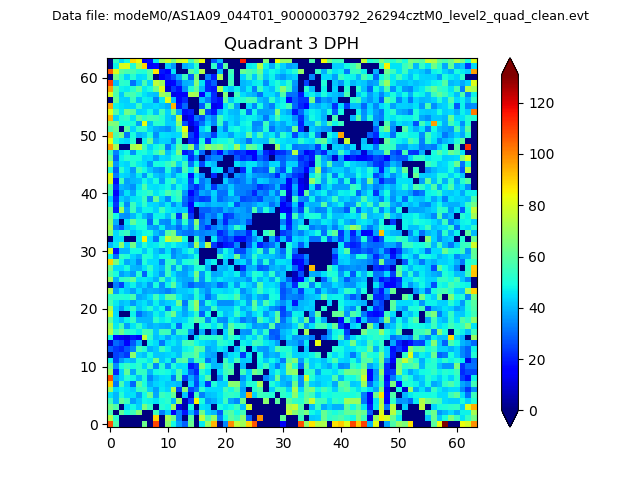 |
 |
Quadrant C |
| Plot type | Count rate plots | Images |
|---|---|---|
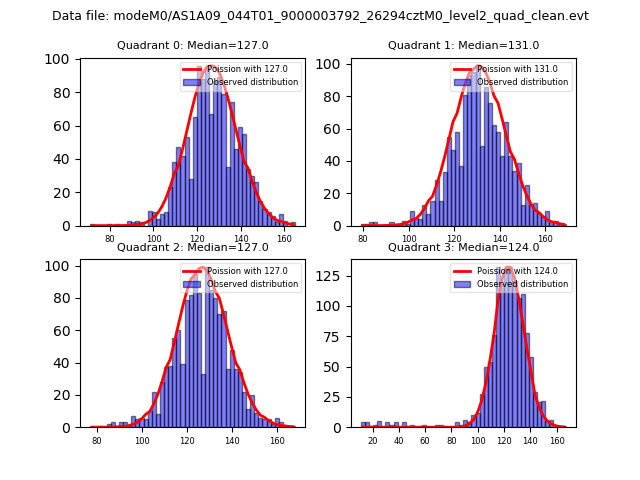
| Comparison with Poisson distribution Blue bars denote a histogram of data divided into 1 sec bins. Red curve is a Poisson curve with rate = median count rate of data. |
 |
 |
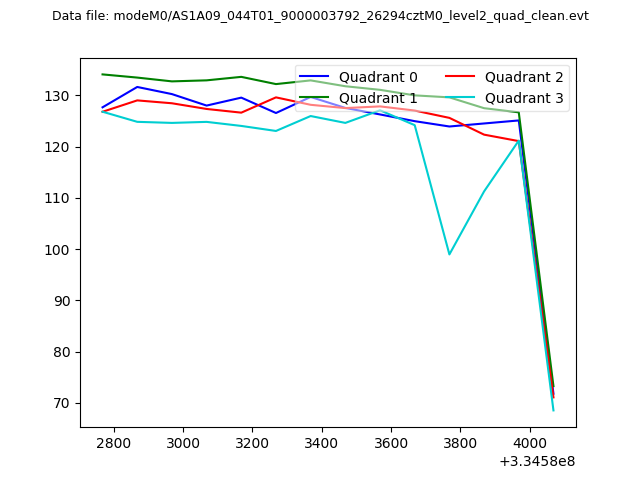
| Quadrant-wise count rates Data is divided into 100 sec bins |
 |
|
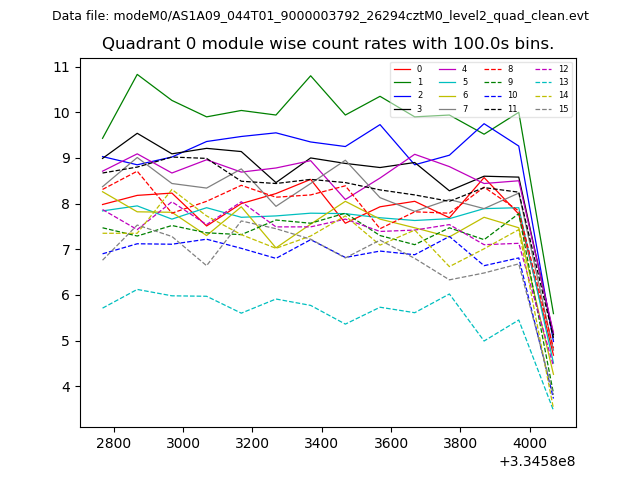
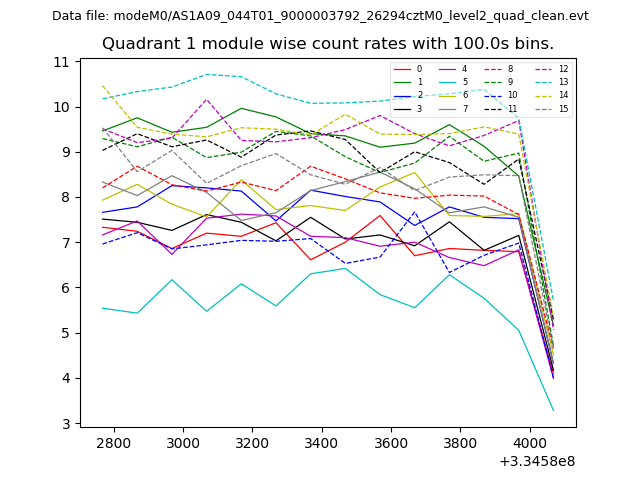
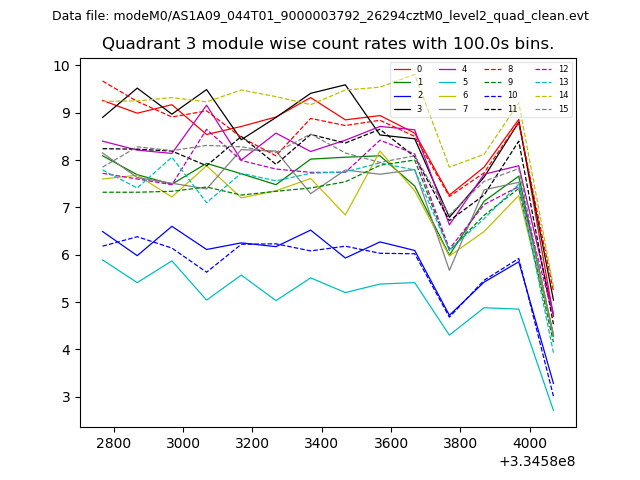
| Module-wise count rates for Quadrant A Data is divided into 100 sec bins |
 |
 |
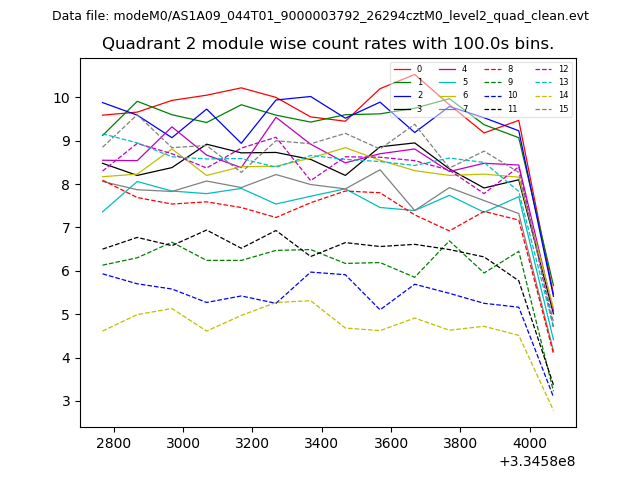
| Module-wise count rates for Quadrant B Data is divided into 100 sec bins |
 |
 |
| Module-wise count rates for Quadrant C Data is divided into 100 sec bins |
 |
 |
| Module-wise count rates for Quadrant D Data is divided into 100 sec bins |
 |
 |
| Parameter | Plot |
|---|---|
| CZT HV Monitor | 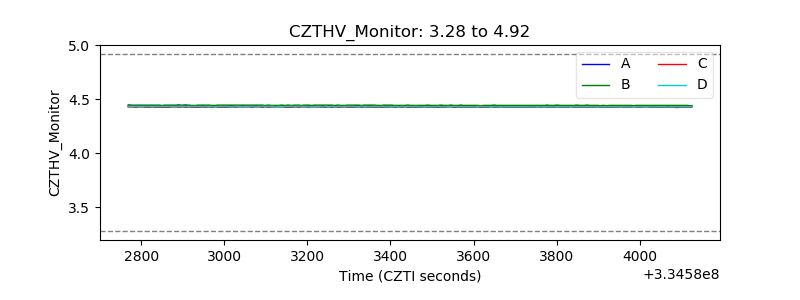 |
| D_VDD | 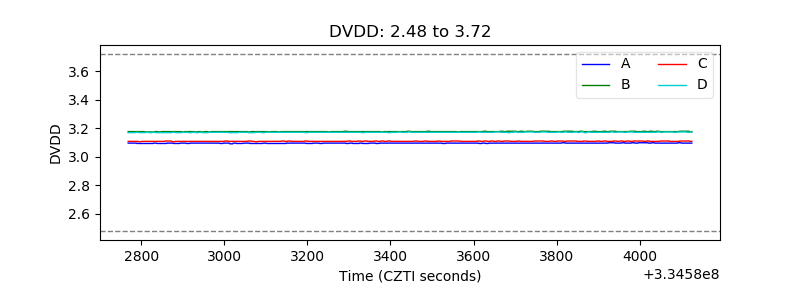 |
| Temperature 1 | 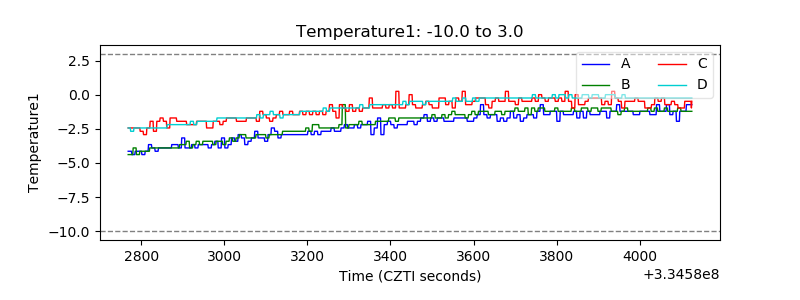 |
| Veto HV Monitor | 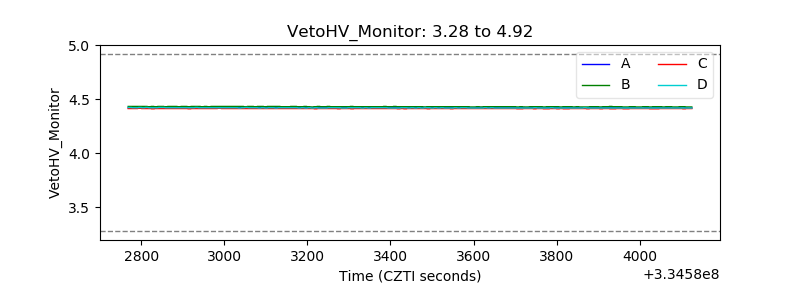 |
| Veto LLD | 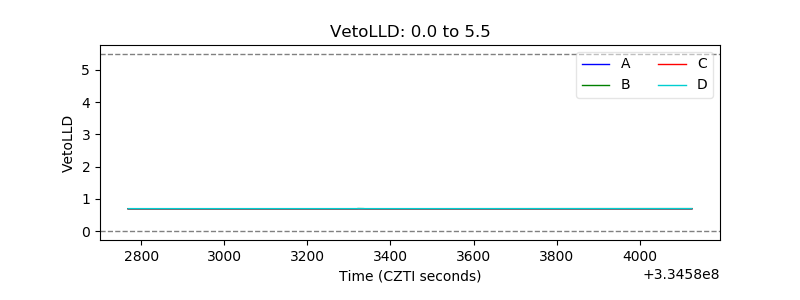 |
| Alpha Counter | 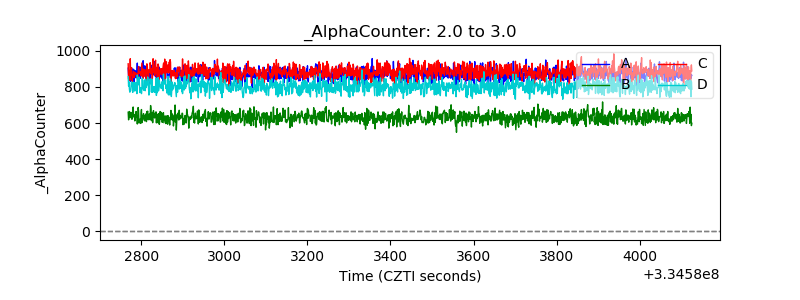 |
| _CPM_Rate | 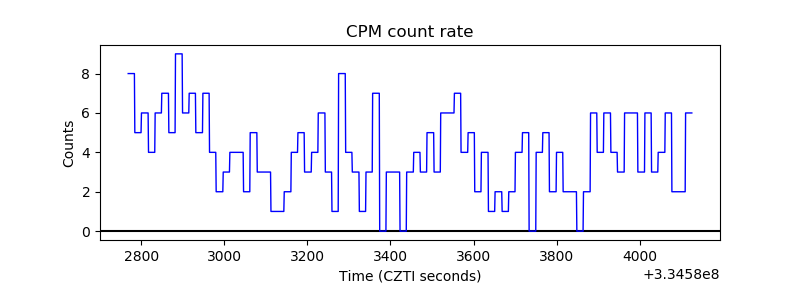 |
| CZT Counter | 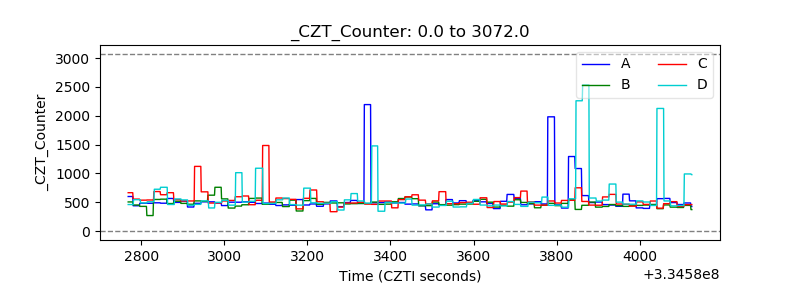 |
| +2.5 Volts monitor |  |
| +5 Volts monitor |  |
| _ROLL_ROT | 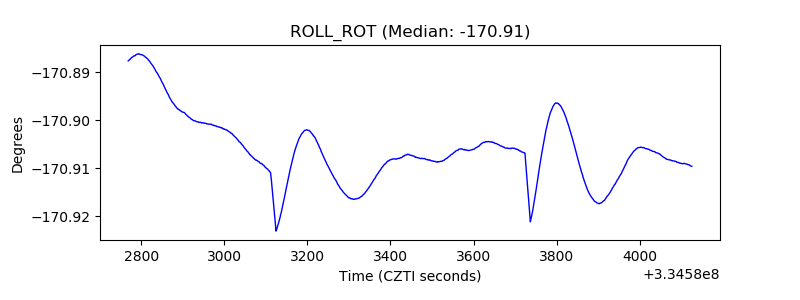 |
| _Roll_DEC | 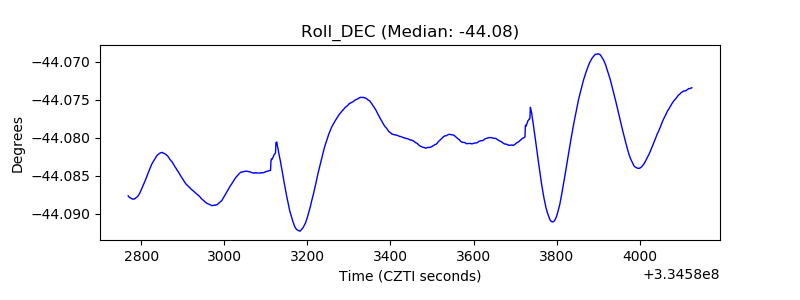 |
| _Roll_RA | 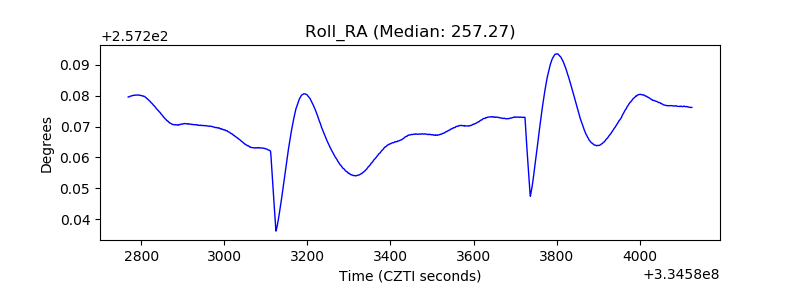 |
| Veto Counter | 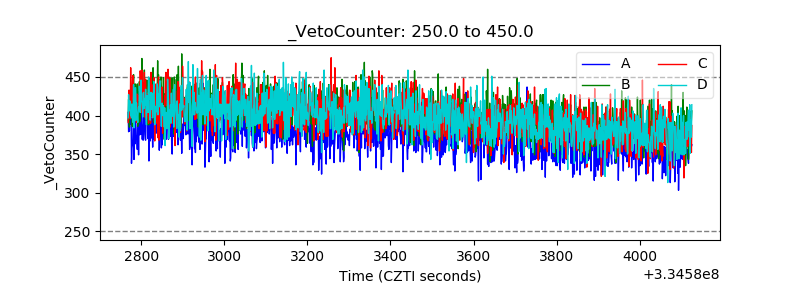 |