| Param | Original file | Final file |
|---|---|---|
| Filename | modeM0/AS1A09_143T03_9000003794cztM0_level2.fits | modeM0/AS1A09_143T03_9000003794cztM0_level2_quad_clean.evt |
| Size (bytes) | 548,487,360 | 446,209,920 |
| Size | 523.1 MB | 425.5 MB |
| Events in quadrant A | 3,383,148 | 2,549,168 |
| Events in quadrant B | 3,274,682 | 2,609,226 |
| Events in quadrant C | 3,323,018 | 2,416,539 |
| Events in quadrant D | 2,963,218 | 2,269,565 |
| Mode M0 | |||
|---|---|---|---|
| Quadrant | BADHDUFLAG | Total packets | Discarded packets |
| A | 0 | 115920 | 0 |
| B | 0 | 112895 | 0 |
| C | 0 | 126381 | 0 |
| D | 0 | 115991 | 0 |
| Mode SS | |||
|---|---|---|---|
| Quadrant | BADHDUFLAG | Total packets | Discarded packets |
| A | 0 | 1090 | 0 |
| B | 0 | 1088 | 0 |
| C | 0 | 1086 | 0 |
| D | 0 | 1086 | 0 |
| Mode M9 | |||
|---|---|---|---|
| Quadrant | BADHDUFLAG | Total packets | Discarded packets |
| A | 0 | 113 | 0 |
| B | 0 | 113 | 0 |
| C | 0 | 113 | 0 |
| D | 0 | 113 | 0 |
| Quadrant | Total seconds | Saturated seconds | Saturation percentage |
|---|---|---|---|
| A | 53450 | 617 | 1.154350% |
| B | 53460 | 500 | 0.935279% |
| C | 53456 | 1840 | 3.442083% |
| D | 53441 | 647 | 1.210681% |
Noise dominated data is calculated using 1-second bins in cleaned event files. If a bin has >2000 counts, and if more than 50% of those come from <1% of pixels, then it is considered to be noise-dominated and hence unusable.
| Quadrant | # 1 sec bins | Bins with >0 counts | Bins with >2000 counts | High rate bins dominated by noise | Noise dominated (total time) | Noise dominated (detector-on time) | Marked lightcurve |
|---|---|---|---|---|---|---|---|
| A | 70445 | 53520 | 0 | 0 | 0.00% | 0.00% |  |
| B | 70444 | 53527 | 0 | 0 | 0.00% | 0.00% |  |
| C | 70445 | 53516 | 0 | 0 | 0.00% | 0.00% |  |
| D | 70445 | 53513 | 0 | 0 | 0.00% | 0.00% |  |
Top three noisy pixels from each quadrant. If the there are fewer than three noisy pixels in the level2.evt file, extra rows are filled as -1
| Pixel properties | Quadrant properties | ||||||
|---|---|---|---|---|---|---|---|
| Quadrant | DetID | PixID | Counts | Sigma | Mean | Median | Sigma |
| A | 7 | 110 | 2790 | 9.11 | 881 | 825 | 215.7 |
| A | 0 | 29 | 2741 | 8.88 | 881 | 825 | 215.7 |
| A | 9 | 19 | 2519 | 7.85 | 881 | 825 | 215.7 |
| B | 2 | 9 | 2539 | 9.89 | 866 | 827 | 173.1 |
| B | 5 | 225 | 2232 | 8.12 | 866 | 827 | 173.1 |
| B | 2 | 8 | 2158 | 7.69 | 866 | 827 | 173.1 |
| C | 12 | 241 | 2286 | 6.56 | 877 | 821 | 223.2 |
| C | 3 | 126 | 2278 | 6.53 | 877 | 821 | 223.2 |
| C | 2 | 191 | 2238 | 6.35 | 877 | 821 | 223.2 |
| D | 6 | 231 | 2142 | 6.04 | 846 | 771 | 226.8 |
| D | 3 | 14 | 2115 | 5.92 | 846 | 771 | 226.8 |
| D | 10 | 189 | 2110 | 5.9 | 846 | 771 | 226.8 |
Histogram calculated using DETX and DETY for each event in the final _common_clean file
| Quadrant A |  |
 |
Quadrant B |
|---|---|---|---|
| Quadrant D | 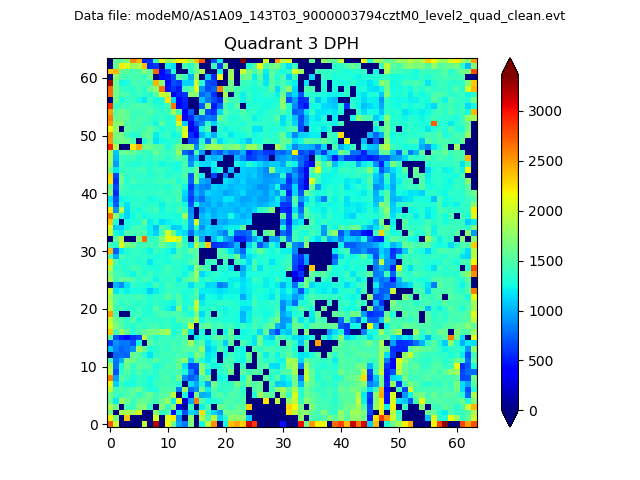 |
 |
Quadrant C |
| Plot type | Count rate plots | Images |
|---|---|---|
| Comparison with Poisson distribution Blue bars denote a histogram of data divided into 1 sec bins. Red curve is a Poisson curve with rate = median count rate of data. |
 |
 |
| Quadrant-wise count rates Data is divided into 100 sec bins |
 |
|
| Module-wise count rates for Quadrant A Data is divided into 100 sec bins |
 |
 |
| Module-wise count rates for Quadrant B Data is divided into 100 sec bins |
 |
 |
| Module-wise count rates for Quadrant C Data is divided into 100 sec bins |
 |
 |
| Module-wise count rates for Quadrant D Data is divided into 100 sec bins |
 |
 |
| Parameter | Plot |
|---|---|
| CZT HV Monitor |  |
| D_VDD | 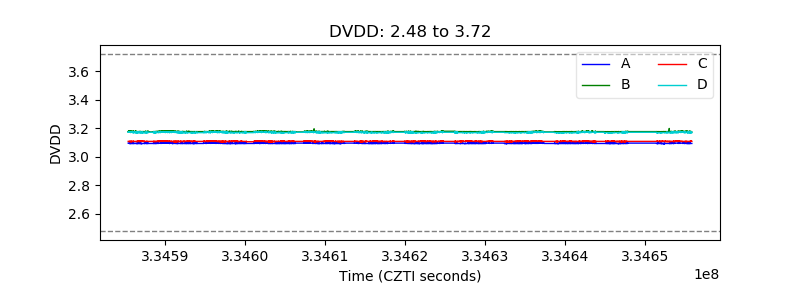 |
| Temperature 1 |  |
| Veto HV Monitor |  |
| Veto LLD |  |
| Alpha Counter |  |
| _CPM_Rate |  |
| CZT Counter |  |
| +2.5 Volts monitor |  |
| +5 Volts monitor |  |
| _ROLL_ROT | 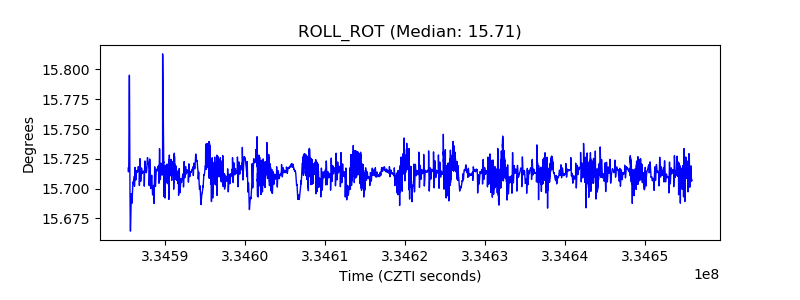 |
| _Roll_DEC |  |
| _Roll_RA | 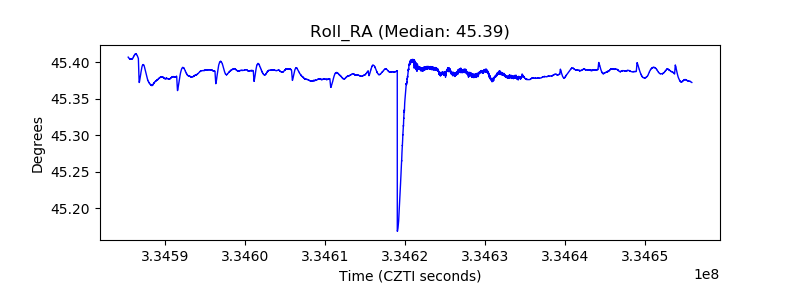 |
| Veto Counter |  |