| Param | Original file | Final file |
|---|---|---|
| Filename | modeM0/AS1A09_143T03_9000003794_26294cztM0_level2.evt | modeM0/AS1A09_143T03_9000003794_26294cztM0_level2_quad_clean.evt |
| Size (bytes) | 686,537,280 | 118,877,760 |
| Size | 654.7 MB | 113.4 MB |
| Events in quadrant A | 4,976,913 | 741,976 |
| Events in quadrant B | 4,788,289 | 759,401 |
| Events in quadrant C | 5,470,607 | 715,517 |
| Events in quadrant D | 4,902,563 | 714,827 |
| Mode M0 | |||
|---|---|---|---|
| Quadrant | BADHDUFLAG | Total packets | Discarded packets |
| A | 0 | 20754 | 0 |
| B | 0 | 20083 | 0 |
| C | 0 | 22097 | 0 |
| D | 0 | 21020 | 0 |
| Mode M9 | |||
|---|---|---|---|
| Quadrant | BADHDUFLAG | Total packets | Discarded packets |
| A | 0 | 14 | 0 |
| B | 0 | 14 | 0 |
| C | 0 | 14 | 0 |
| D | 0 | 14 | 0 |
| Quadrant | Total seconds | Saturated seconds | Saturation percentage |
|---|---|---|---|
| A | 9650 | 194 | 2.010363% |
| B | 9650 | 127 | 1.316062% |
| C | 9650 | 325 | 3.367876% |
| D | 9649 | 204 | 2.114209% |
Noise dominated data is calculated using 1-second bins in cleaned event files. If a bin has >2000 counts, and if more than 50% of those come from <1% of pixels, then it is considered to be noise-dominated and hence unusable.
| Quadrant | # 1 sec bins | Bins with >0 counts | Bins with >2000 counts | High rate bins dominated by noise | Noise dominated (total time) | Noise dominated (detector-on time) | Marked lightcurve |
|---|---|---|---|---|---|---|---|
| A | 10950 | 9652 | 68 | 68 | 0.62% | 0.70% | 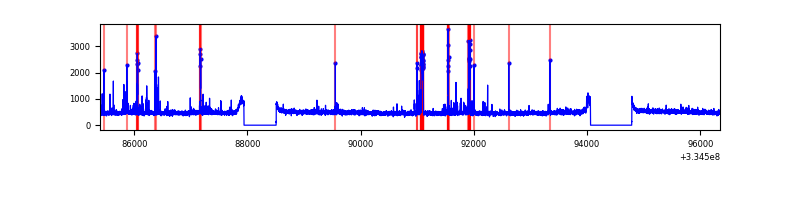 |
| B | 10950 | 9652 | 2 | 2 | 0.02% | 0.02% | 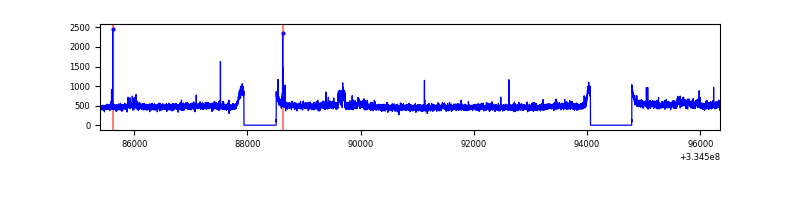 |
| C | 10950 | 9652 | 96 | 96 | 0.88% | 0.99% | 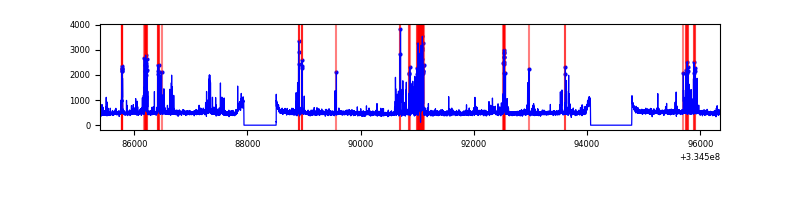 |
| D | 10949 | 9651 | 94 | 94 | 0.86% | 0.97% | 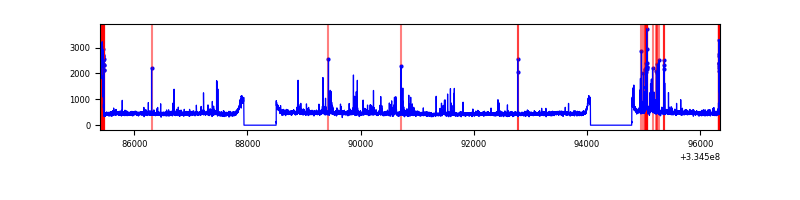 |
Top three noisy pixels from each quadrant. If the there are fewer than three noisy pixels in the level2.evt file, extra rows are filled as -1
| Pixel properties | Quadrant properties | ||||||
|---|---|---|---|---|---|---|---|
| Quadrant | DetID | PixID | Counts | Sigma | Mean | Median | Sigma |
| A | 0 | 13 | 367424 | 1521.67 | 1194 | 1167 | 240.7 |
| A | 13 | 254 | 16802 | 64.96 | 1194 | 1167 | 240.7 |
| A | 3 | 137 | 11252 | 41.9 | 1194 | 1167 | 240.7 |
| B | 0 | 230 | 122967 | 527.03 | 1190 | 1158 | 231.1 |
| B | 12 | 111 | 28442 | 118.05 | 1190 | 1158 | 231.1 |
| B | 11 | 111 | 25347 | 104.66 | 1190 | 1158 | 231.1 |
| C | 4 | 254 | 769843 | 2826.8 | 1145 | 1152 | 271.9 |
| C | 14 | 238 | 179433 | 655.61 | 1145 | 1152 | 271.9 |
| C | 3 | 233 | 56218 | 202.5 | 1145 | 1152 | 271.9 |
| D | 12 | 233 | 360216 | 1292.01 | 1159 | 1130 | 277.9 |
| D | 11 | 176 | 66899 | 236.64 | 1159 | 1130 | 277.9 |
| D | 2 | 234 | 43096 | 151.0 | 1159 | 1130 | 277.9 |
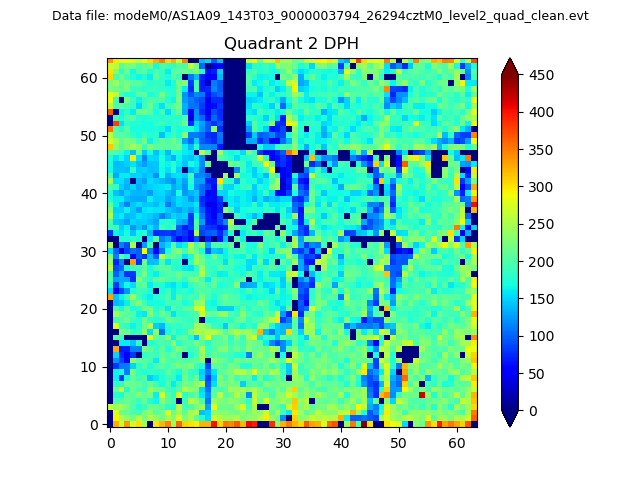
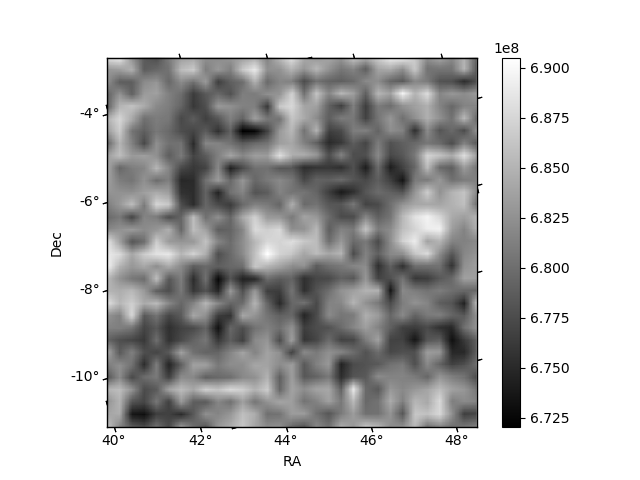
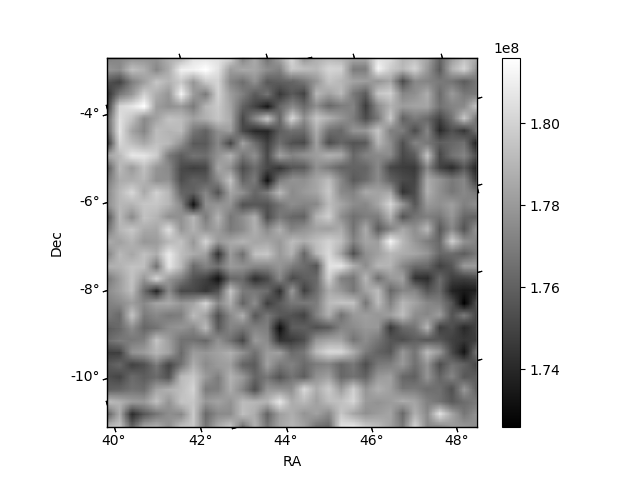
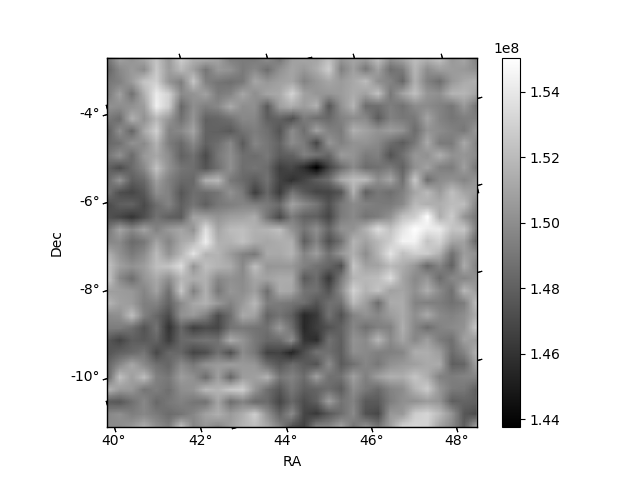
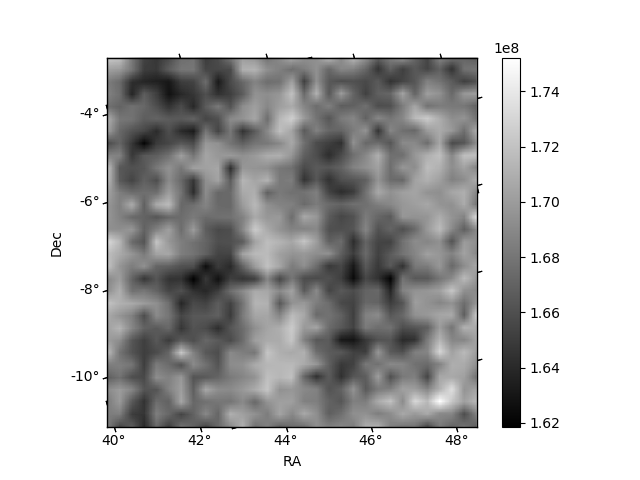
Histogram calculated using DETX and DETY for each event in the final _common_clean file
| Quadrant A | 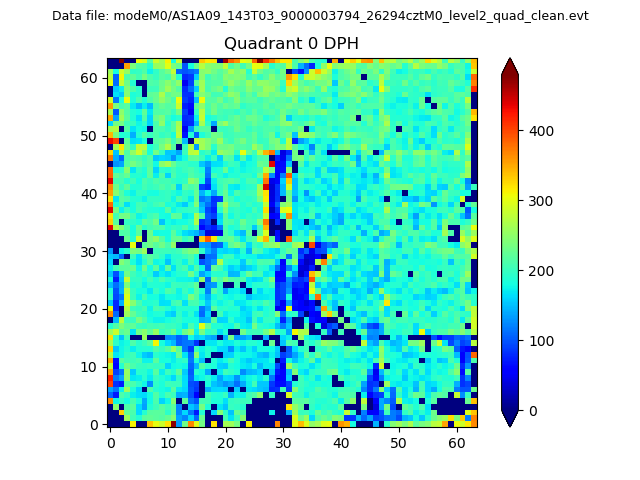 |
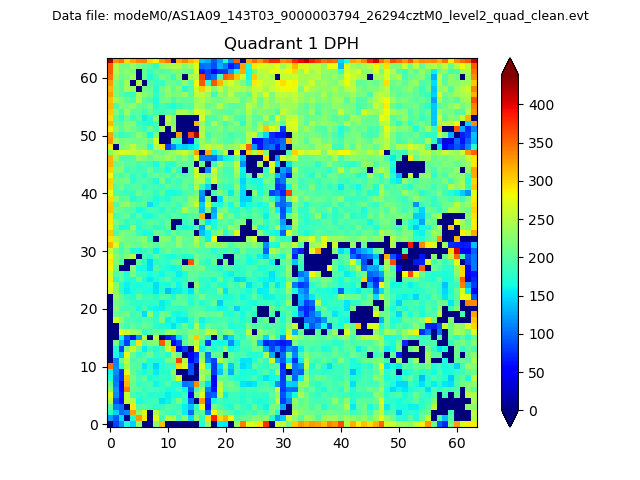 |
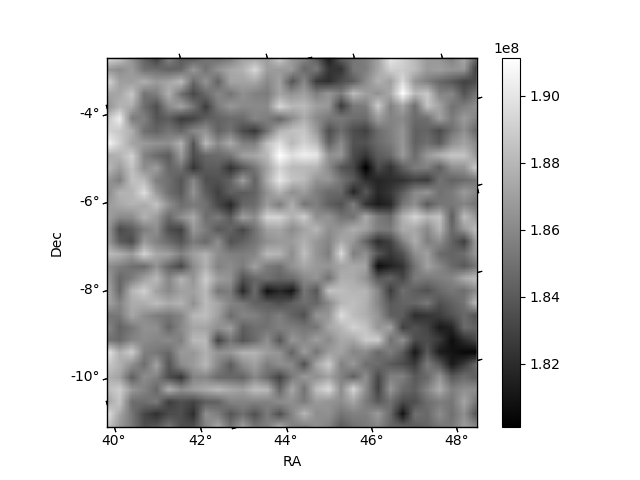
Quadrant B |
|---|---|---|---|
| Quadrant D | 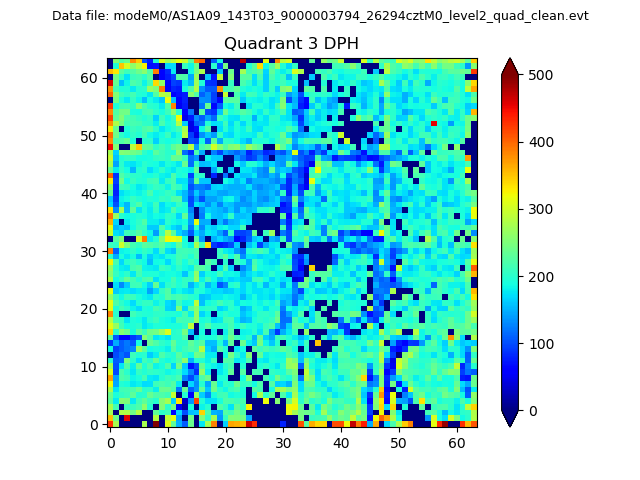 |
 |
Quadrant C |
| Plot type | Count rate plots | Images |
|---|---|---|
| Comparison with Poisson distribution Blue bars denote a histogram of data divided into 1 sec bins. Red curve is a Poisson curve with rate = median count rate of data. |
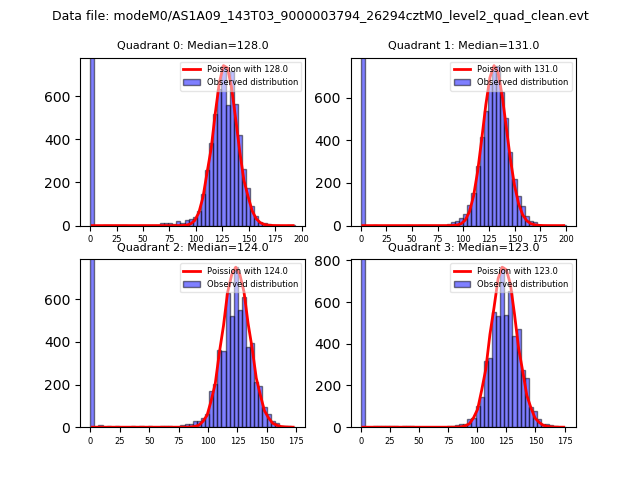 |
 |
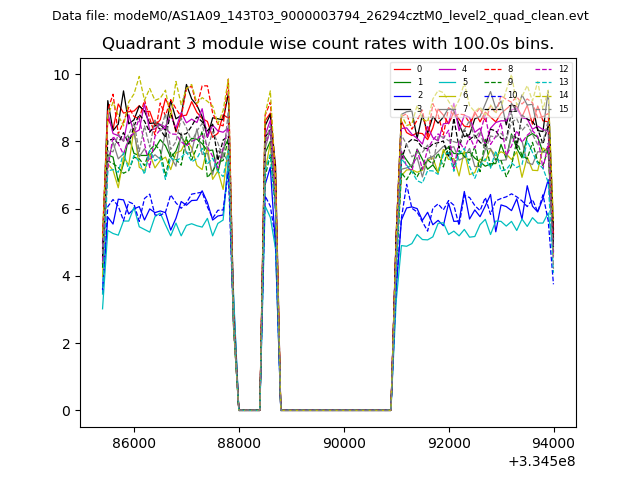
| Quadrant-wise count rates Data is divided into 100 sec bins |
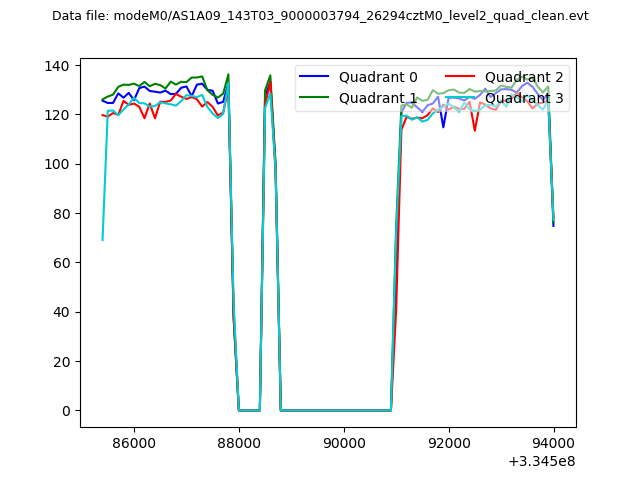 |
|
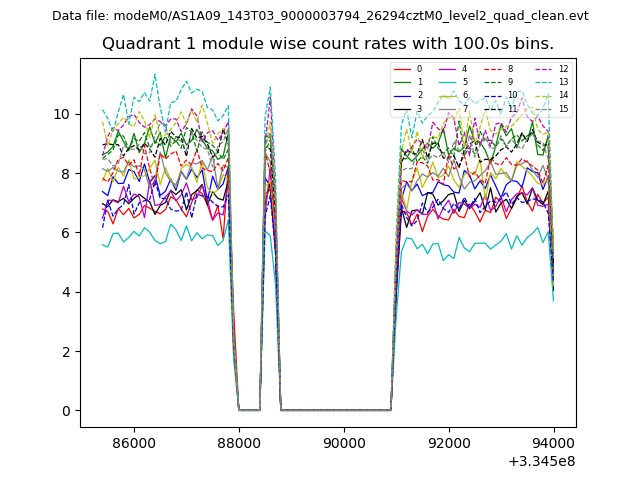
| Module-wise count rates for Quadrant A Data is divided into 100 sec bins |
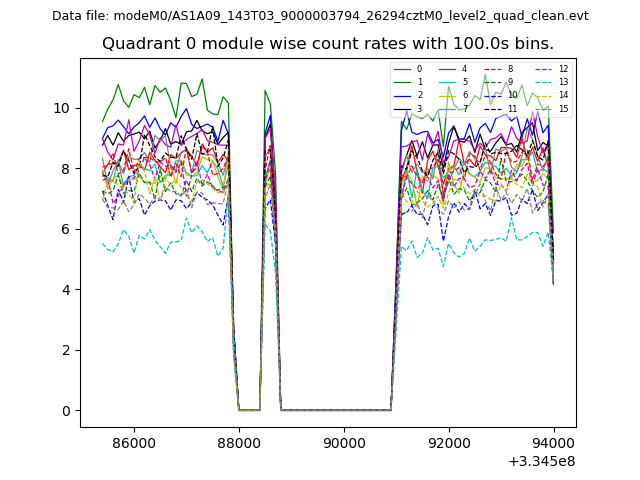 |
 |
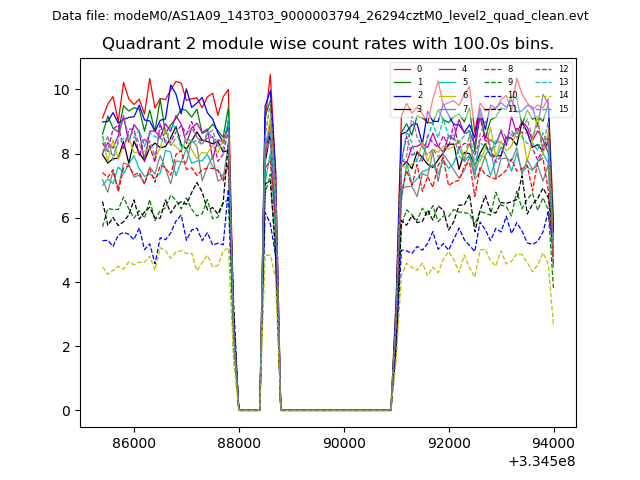
| Module-wise count rates for Quadrant B Data is divided into 100 sec bins |
 |
 |
| Module-wise count rates for Quadrant C Data is divided into 100 sec bins |
 |
 |
| Module-wise count rates for Quadrant D Data is divided into 100 sec bins |
 |
 |
| Parameter | Plot |
|---|---|
| CZT HV Monitor | 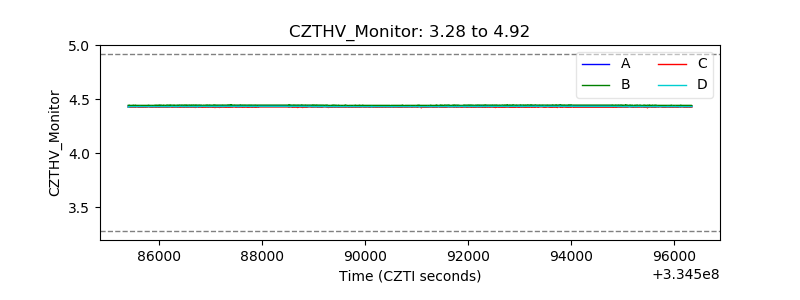 |
| D_VDD | 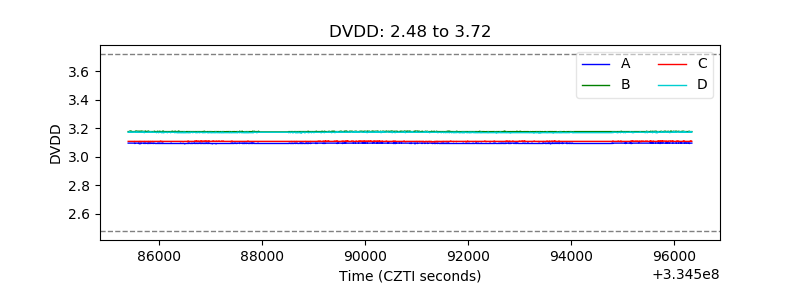 |
| Temperature 1 | 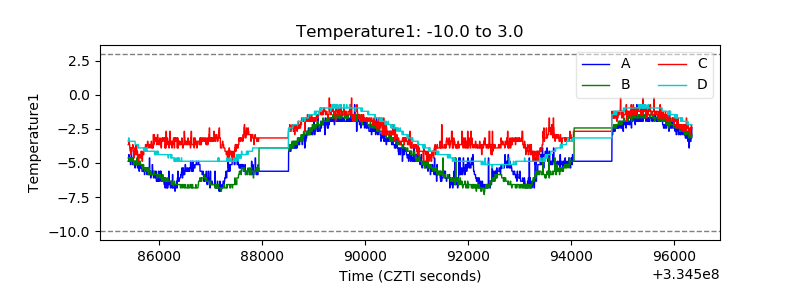 |
| Veto HV Monitor |  |
| Veto LLD | 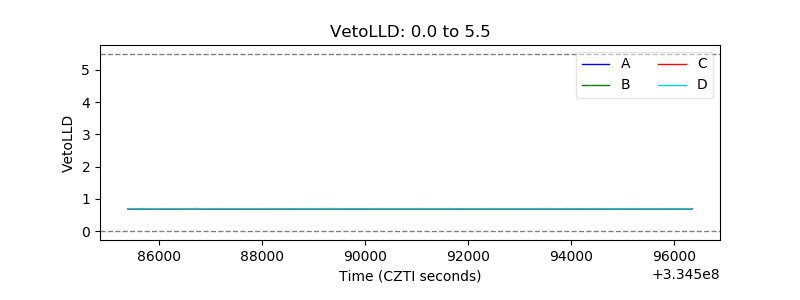 |
| Alpha Counter | 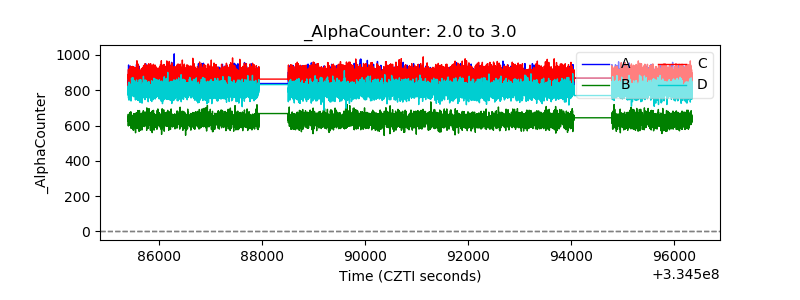 |
| _CPM_Rate | 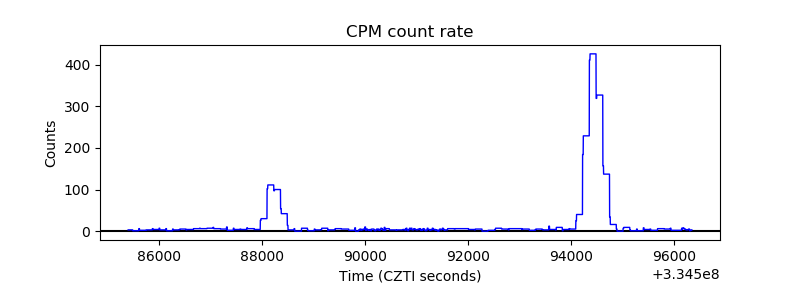 |
| CZT Counter | 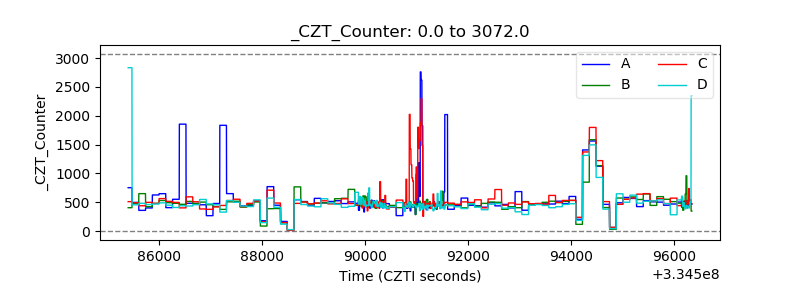 |
| +2.5 Volts monitor |  |
| +5 Volts monitor |  |
| _ROLL_ROT | 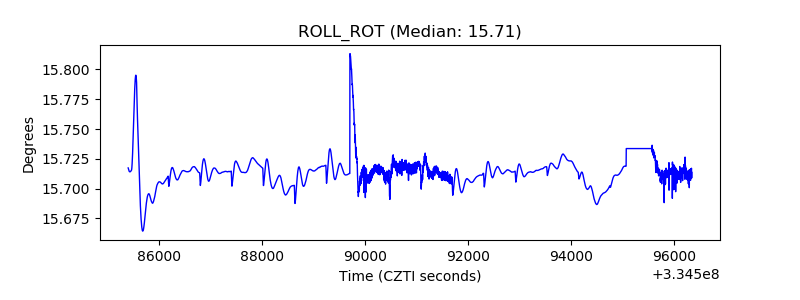 |
| _Roll_DEC | 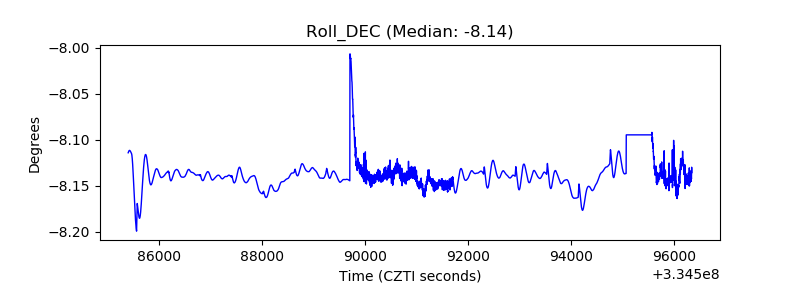 |
| _Roll_RA | 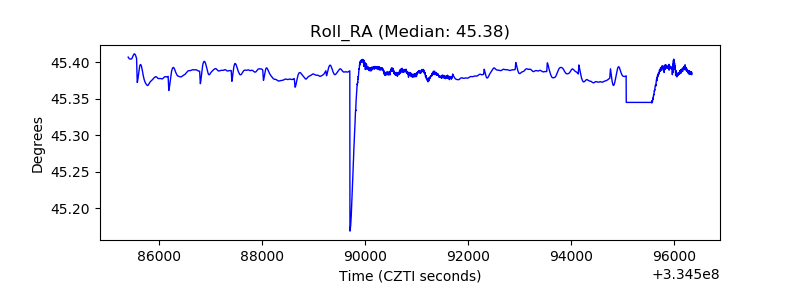 |
| Veto Counter | 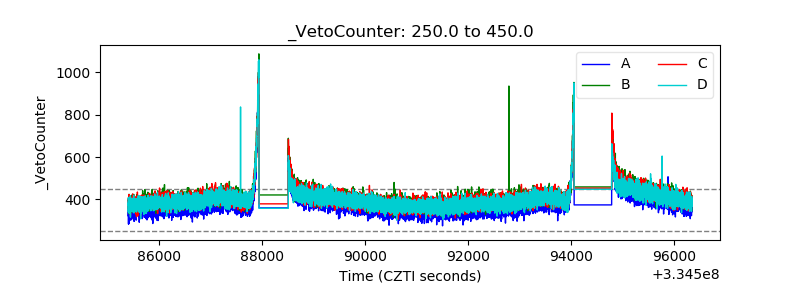 |