| Param | Original file | Final file |
|---|---|---|
| Filename | modeM0/AS1A09_143T03_9000003794_26296cztM0_level2.evt | modeM0/AS1A09_143T03_9000003794_26296cztM0_level2_quad_clean.evt |
| Size (bytes) | 493,214,400 | 77,345,280 |
| Size | 470.4 MB | 73.8 MB |
| Events in quadrant A | 3,446,982 | 481,072 |
| Events in quadrant B | 3,218,568 | 492,353 |
| Events in quadrant C | 4,373,082 | 458,054 |
| Events in quadrant D | 3,464,851 | 464,973 |
| Mode M0 | |||
|---|---|---|---|
| Quadrant | BADHDUFLAG | Total packets | Discarded packets |
| A | 0 | 14337 | 0 |
| B | 0 | 13569 | 0 |
| C | 0 | 17070 | 0 |
| D | 0 | 14561 | 0 |
| Mode M9 | |||
|---|---|---|---|
| Quadrant | BADHDUFLAG | Total packets | Discarded packets |
| A | 0 | 10 | 0 |
| B | 0 | 10 | 0 |
| C | 0 | 10 | 0 |
| D | 0 | 10 | 0 |
| Quadrant | Total seconds | Saturated seconds | Saturation percentage |
|---|---|---|---|
| A | 6384 | 100 | 1.566416% |
| B | 6384 | 52 | 0.814536% |
| C | 6385 | 426 | 6.671887% |
| D | 6385 | 147 | 2.302271% |
Noise dominated data is calculated using 1-second bins in cleaned event files. If a bin has >2000 counts, and if more than 50% of those come from <1% of pixels, then it is considered to be noise-dominated and hence unusable.
| Quadrant | # 1 sec bins | Bins with >0 counts | Bins with >2000 counts | High rate bins dominated by noise | Noise dominated (total time) | Noise dominated (detector-on time) | Marked lightcurve |
|---|---|---|---|---|---|---|---|
| A | 7419 | 6385 | 30 | 30 | 0.40% | 0.47% | 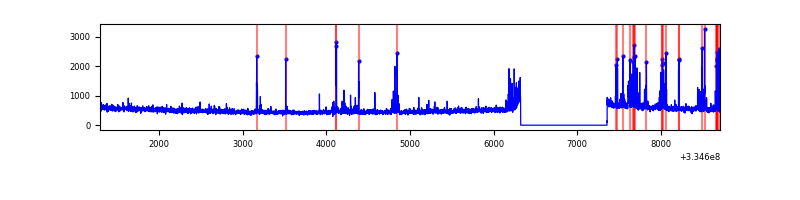 |
| B | 7419 | 6385 | 0 | 0 | 0.00% | 0.00% | 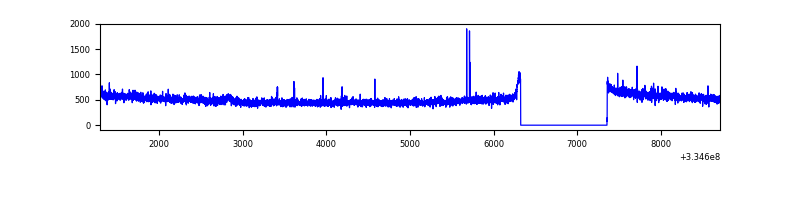 |
| C | 7420 | 6386 | 149 | 149 | 2.01% | 2.33% | 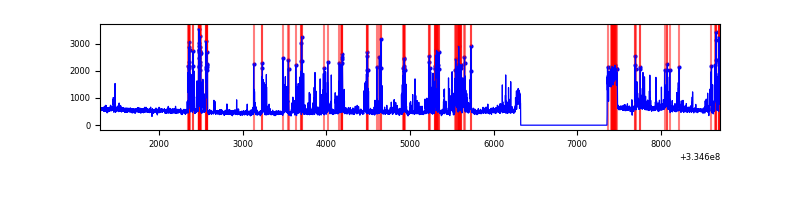 |
| D | 7420 | 6386 | 95 | 95 | 1.28% | 1.49% | 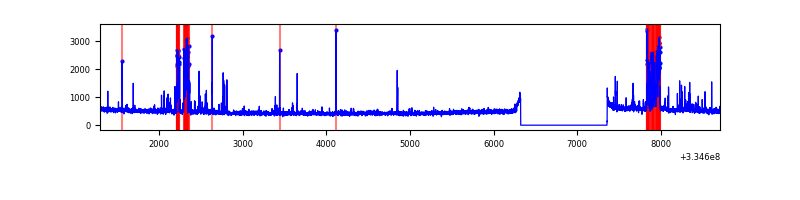 |
Top three noisy pixels from each quadrant. If the there are fewer than three noisy pixels in the level2.evt file, extra rows are filled as -1
| Pixel properties | Quadrant properties | ||||||
|---|---|---|---|---|---|---|---|
| Quadrant | DetID | PixID | Counts | Sigma | Mean | Median | Sigma |
| A | 0 | 13 | 302129 | 1841.06 | 815 | 799 | 163.7 |
| A | 13 | 254 | 11298 | 64.15 | 815 | 799 | 163.7 |
| A | 3 | 137 | 7465 | 40.73 | 815 | 799 | 163.7 |
| B | 0 | 230 | 24004 | 148.47 | 816 | 796 | 156.3 |
| B | 12 | 111 | 18790 | 115.12 | 816 | 796 | 156.3 |
| B | 11 | 111 | 16540 | 100.72 | 816 | 796 | 156.3 |
| C | 4 | 254 | 1032251 | 5662.0 | 772 | 778 | 182.2 |
| C | 3 | 233 | 210048 | 1148.73 | 772 | 778 | 182.2 |
| C | 14 | 238 | 122568 | 668.53 | 772 | 778 | 182.2 |
| D | 12 | 233 | 382431 | 2016.42 | 791 | 775 | 189.3 |
| D | 1 | 52 | 35952 | 185.85 | 791 | 775 | 189.3 |
| D | 2 | 234 | 29352 | 150.98 | 791 | 775 | 189.3 |
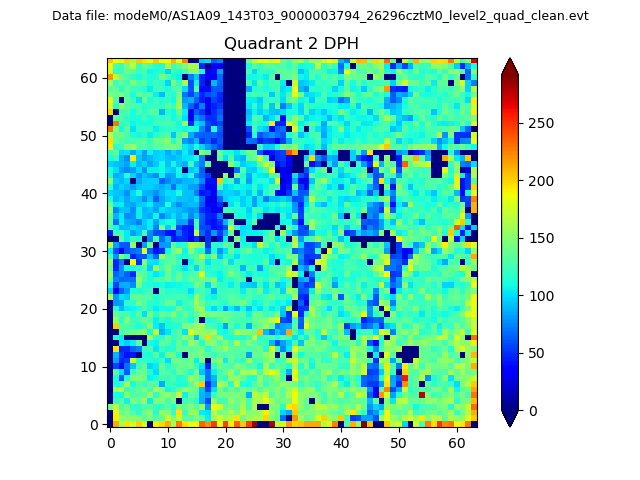
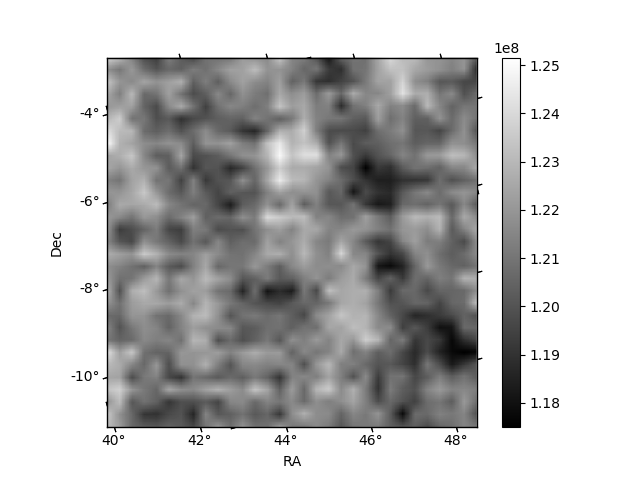
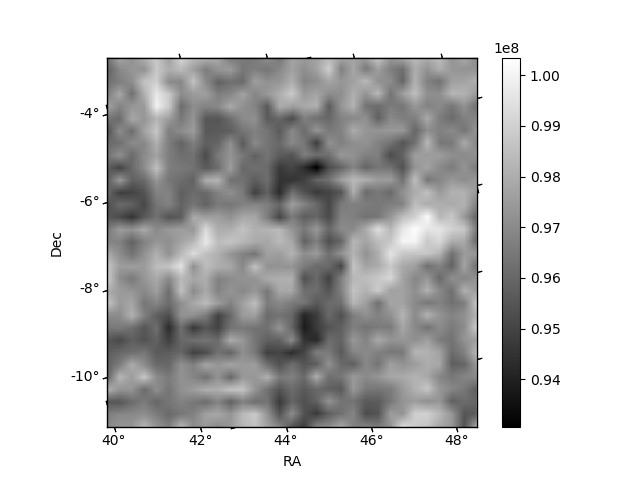
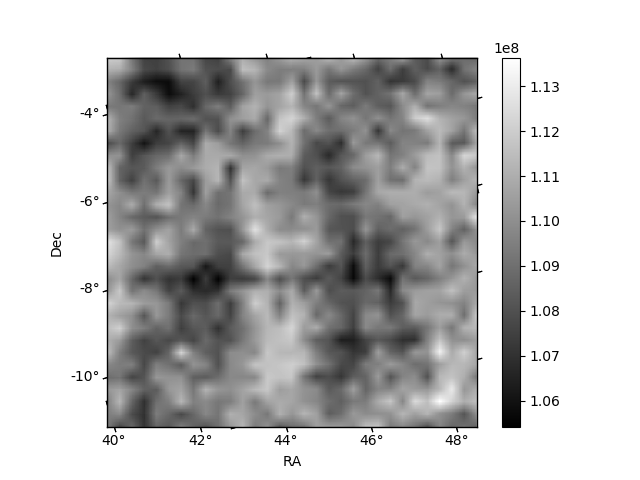
Histogram calculated using DETX and DETY for each event in the final _common_clean file
| Quadrant A | 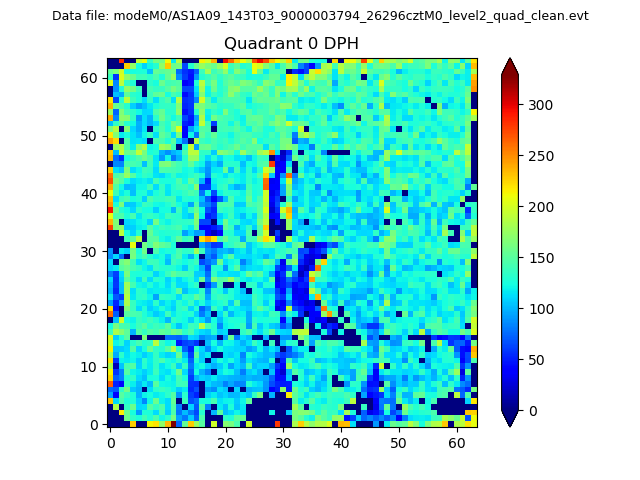 |
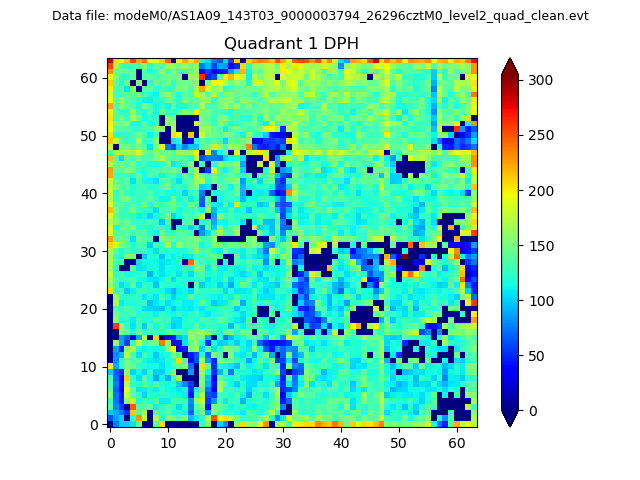 |
Quadrant B |
|---|---|---|---|
| Quadrant D | 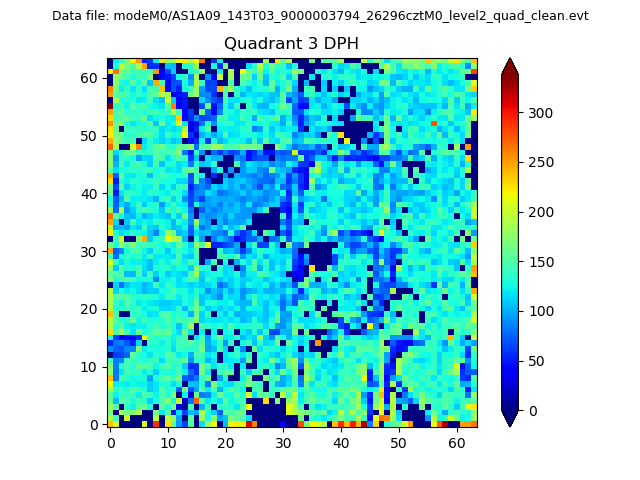 |
 |
Quadrant C |
| Plot type | Count rate plots | Images |
|---|---|---|
| Comparison with Poisson distribution Blue bars denote a histogram of data divided into 1 sec bins. Red curve is a Poisson curve with rate = median count rate of data. |
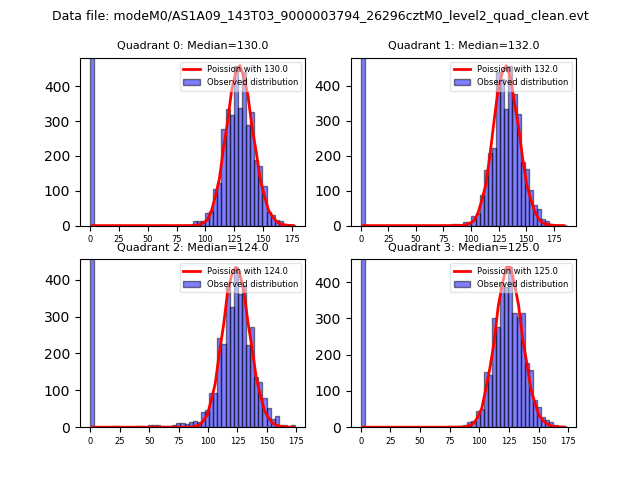 |
 |
| Quadrant-wise count rates Data is divided into 100 sec bins |
 |
|
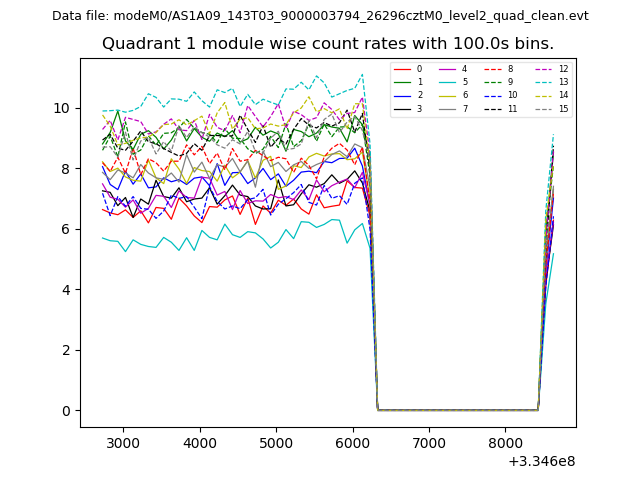
| Module-wise count rates for Quadrant A Data is divided into 100 sec bins |
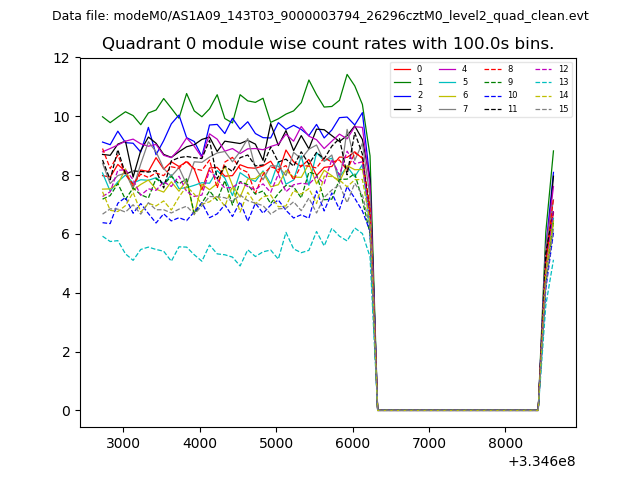 |
 |
| Module-wise count rates for Quadrant B Data is divided into 100 sec bins |
 |
 |
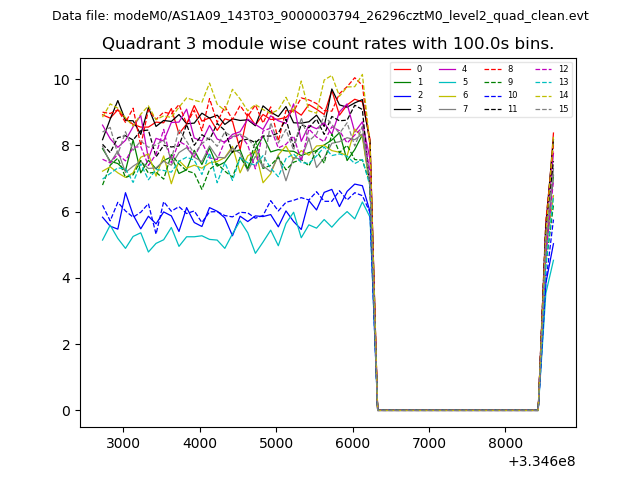
| Module-wise count rates for Quadrant C Data is divided into 100 sec bins |
 |
 |
| Module-wise count rates for Quadrant D Data is divided into 100 sec bins |
 |
 |
| Parameter | Plot |
|---|---|
| CZT HV Monitor | 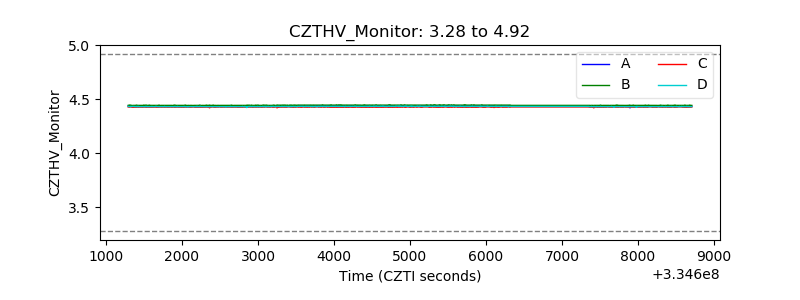 |
| D_VDD | 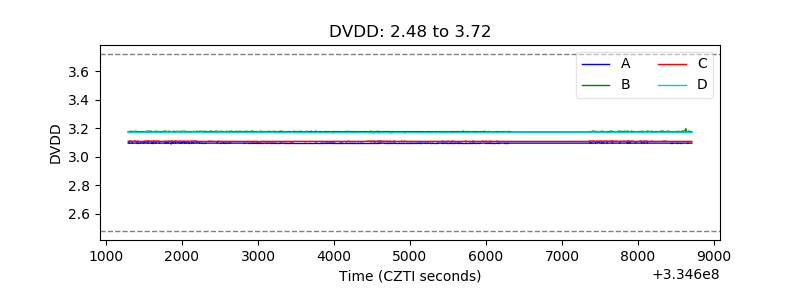 |
| Temperature 1 | 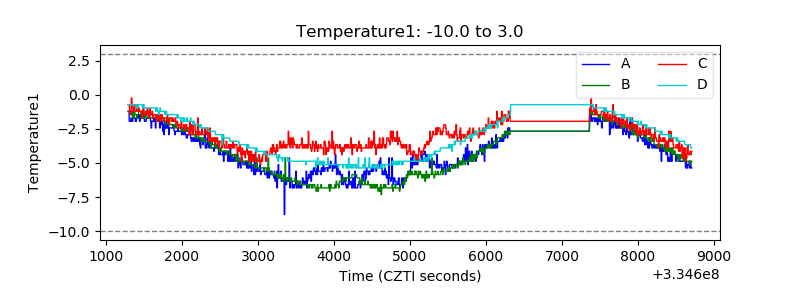 |
| Veto HV Monitor | 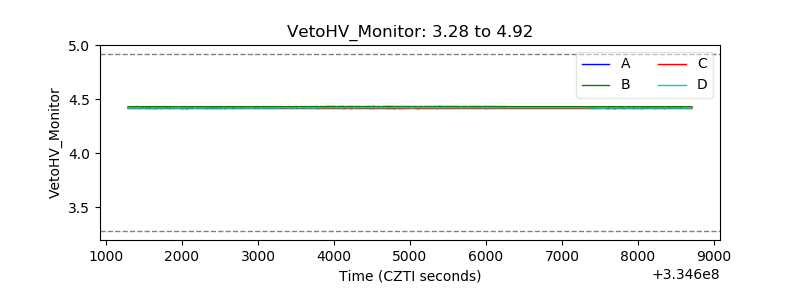 |
| Veto LLD | 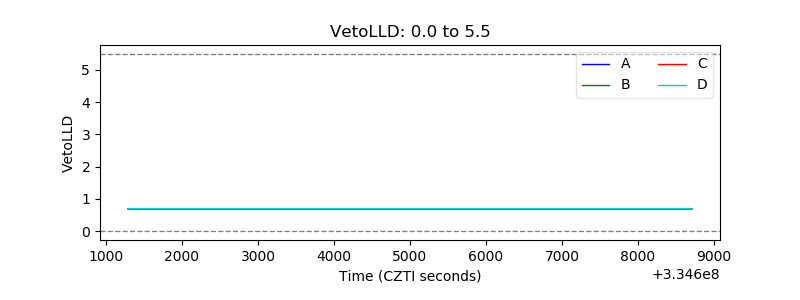 |
| Alpha Counter |  |
| _CPM_Rate | 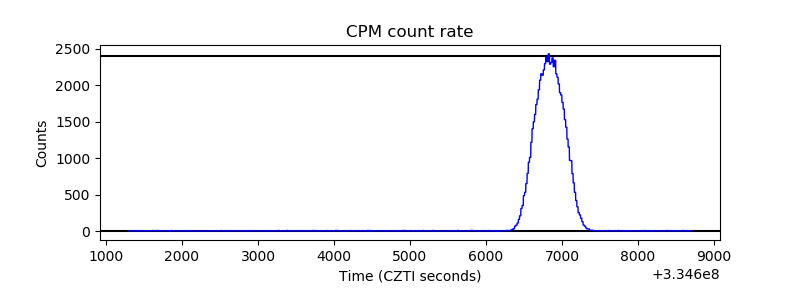 |
| CZT Counter | 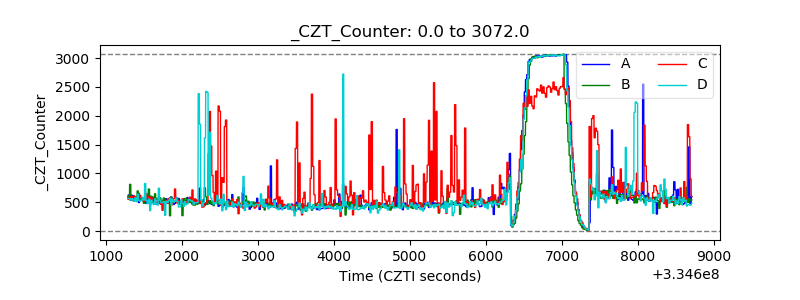 |
| +2.5 Volts monitor | 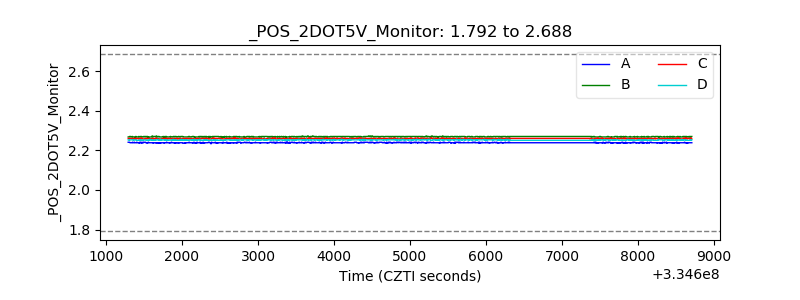 |
| +5 Volts monitor |  |
| _ROLL_ROT | 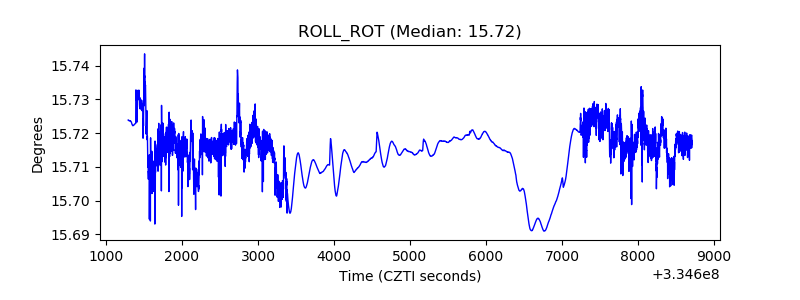 |
| _Roll_DEC | 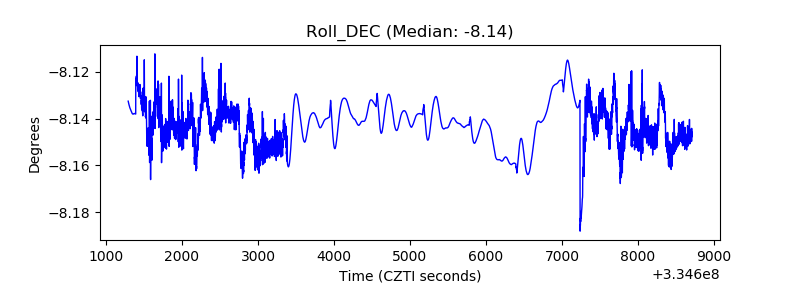 |
| _Roll_RA | 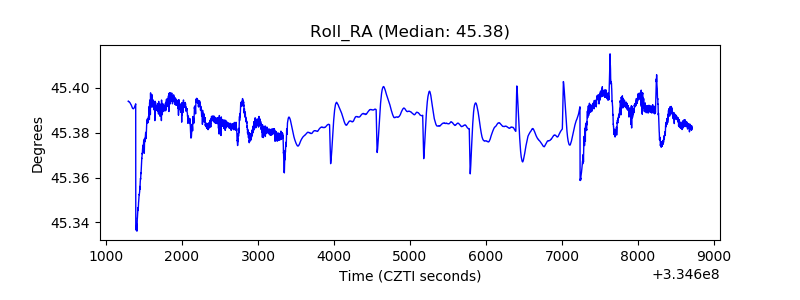 |
| Veto Counter | 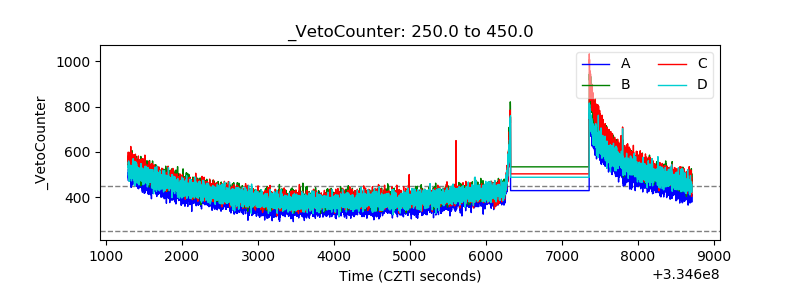 |