| Param | Original file | Final file |
|---|---|---|
| Filename | modeM0/AS1A09_143T03_9000003794_26298cztM0_level2.evt | modeM0/AS1A09_143T03_9000003794_26298cztM0_level2_quad_clean.evt |
| Size (bytes) | 508,703,040 | 85,870,080 |
| Size | 485.1 MB | 81.9 MB |
| Events in quadrant A | 3,718,391 | 544,386 |
| Events in quadrant B | 3,294,659 | 563,414 |
| Events in quadrant C | 4,348,919 | 524,843 |
| Events in quadrant D | 3,617,243 | 528,634 |
| Mode M0 | |||
|---|---|---|---|
| Quadrant | BADHDUFLAG | Total packets | Discarded packets |
| A | 0 | 15160 | 0 |
| B | 0 | 13878 | 0 |
| C | 0 | 17176 | 0 |
| D | 0 | 15035 | 0 |
| Mode M9 | |||
|---|---|---|---|
| Quadrant | BADHDUFLAG | Total packets | Discarded packets |
| A | 0 | 11 | 0 |
| B | 0 | 11 | 0 |
| C | 0 | 11 | 0 |
| D | 0 | 11 | 0 |
| Quadrant | Total seconds | Saturated seconds | Saturation percentage |
|---|---|---|---|
| A | 6290 | 136 | 2.162162% |
| B | 6289 | 65 | 1.033551% |
| C | 6289 | 393 | 6.249006% |
| D | 6290 | 158 | 2.511924% |
Noise dominated data is calculated using 1-second bins in cleaned event files. If a bin has >2000 counts, and if more than 50% of those come from <1% of pixels, then it is considered to be noise-dominated and hence unusable.
| Quadrant | # 1 sec bins | Bins with >0 counts | Bins with >2000 counts | High rate bins dominated by noise | Noise dominated (total time) | Noise dominated (detector-on time) | Marked lightcurve |
|---|---|---|---|---|---|---|---|
| A | 7445 | 6291 | 64 | 64 | 0.86% | 1.02% | 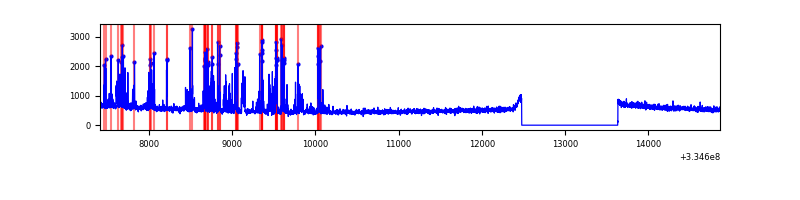 |
| B | 7444 | 6290 | 1 | 1 | 0.01% | 0.02% | 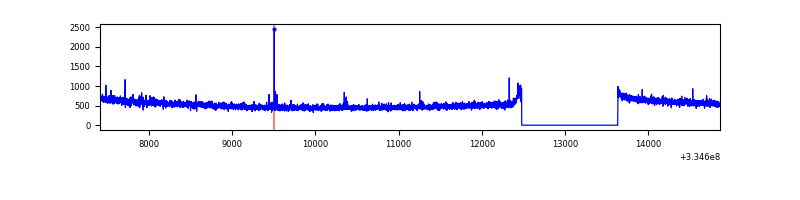 |
| C | 7444 | 6290 | 132 | 132 | 1.77% | 2.10% | 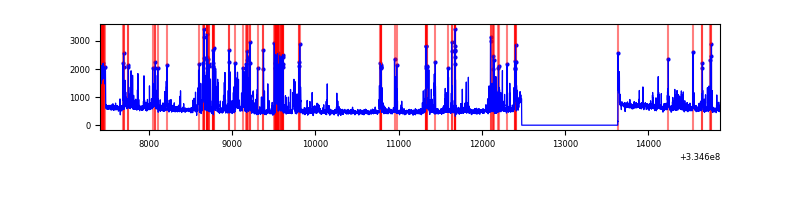 |
| D | 7445 | 6291 | 92 | 92 | 1.24% | 1.46% | 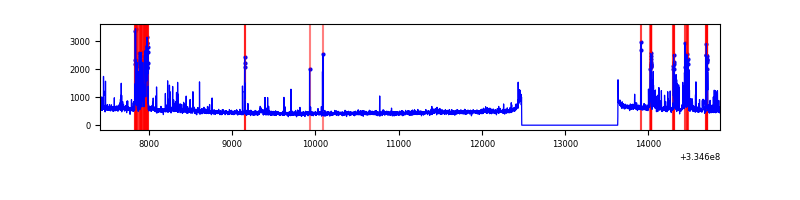 |
Top three noisy pixels from each quadrant. If the there are fewer than three noisy pixels in the level2.evt file, extra rows are filled as -1
| Pixel properties | Quadrant properties | ||||||
|---|---|---|---|---|---|---|---|
| Quadrant | DetID | PixID | Counts | Sigma | Mean | Median | Sigma |
| A | 0 | 13 | 507928 | 3057.9 | 832 | 815 | 165.8 |
| A | 13 | 254 | 10809 | 60.26 | 832 | 815 | 165.8 |
| A | 3 | 137 | 7489 | 40.24 | 832 | 815 | 165.8 |
| B | 12 | 111 | 18824 | 113.5 | 838 | 818 | 158.6 |
| B | 11 | 111 | 16758 | 100.48 | 838 | 818 | 158.6 |
| B | 14 | 111 | 14544 | 86.52 | 838 | 818 | 158.6 |
| C | 4 | 254 | 927451 | 4965.95 | 799 | 807 | 186.6 |
| C | 3 | 233 | 177700 | 947.98 | 799 | 807 | 186.6 |
| C | 14 | 238 | 128961 | 686.79 | 799 | 807 | 186.6 |
| D | 12 | 233 | 355121 | 1837.45 | 810 | 789 | 192.8 |
| D | 13 | 168 | 70027 | 359.04 | 810 | 789 | 192.8 |
| D | 15 | 145 | 35734 | 181.21 | 810 | 789 | 192.8 |
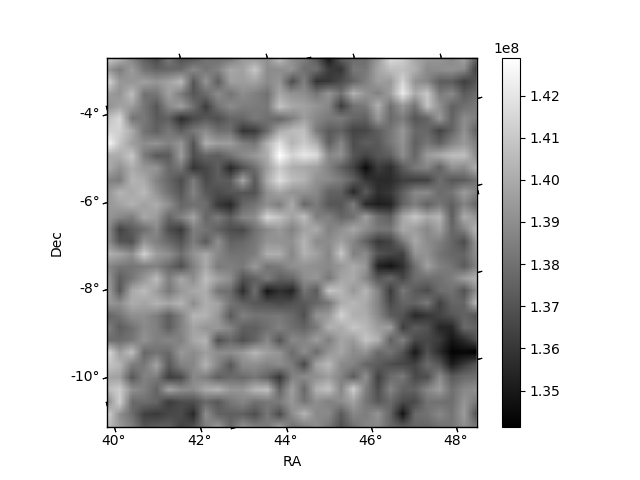
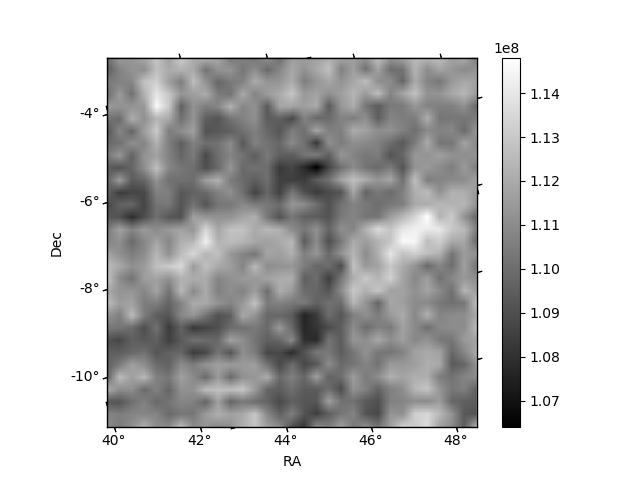
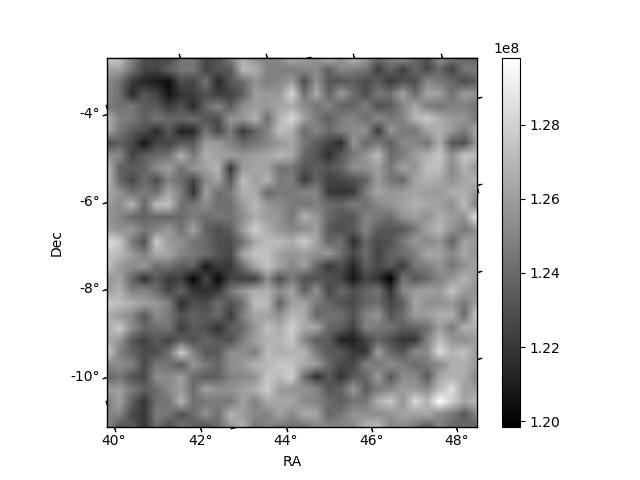
Histogram calculated using DETX and DETY for each event in the final _common_clean file
| Quadrant A | 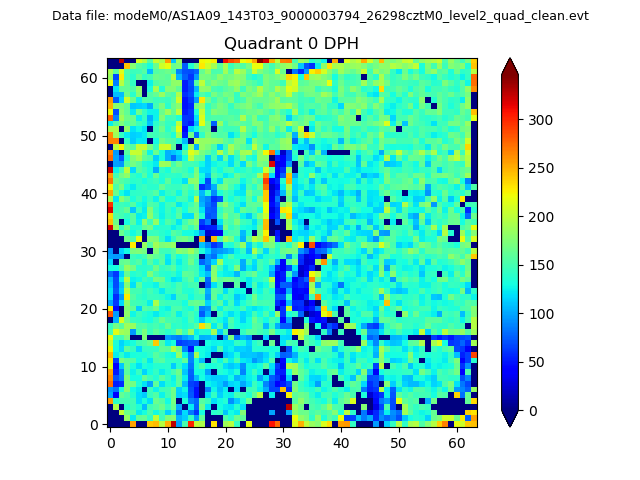 |
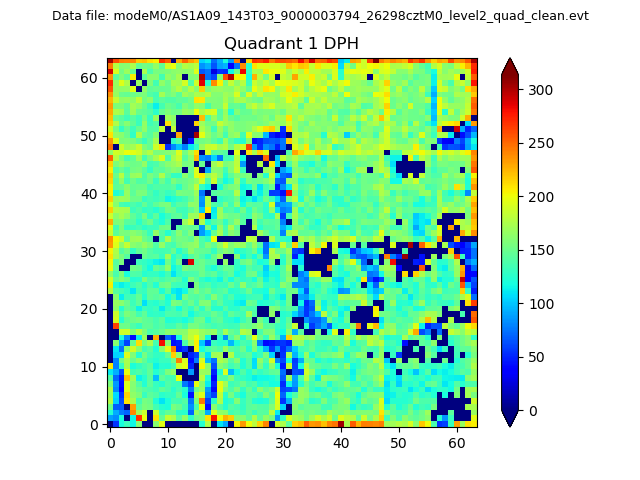 |
Quadrant B |
|---|---|---|---|
| Quadrant D | 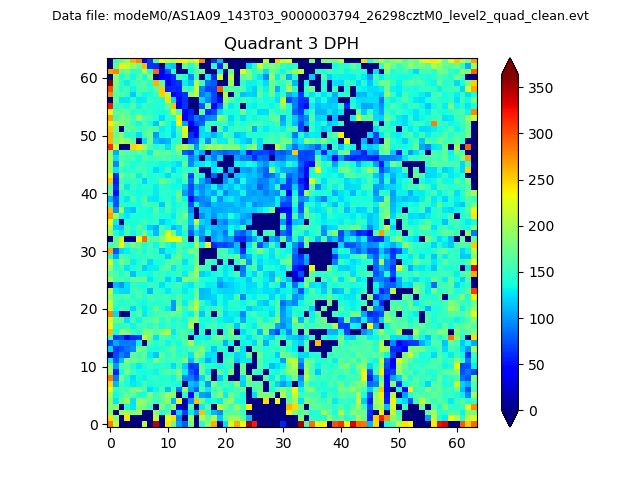 |
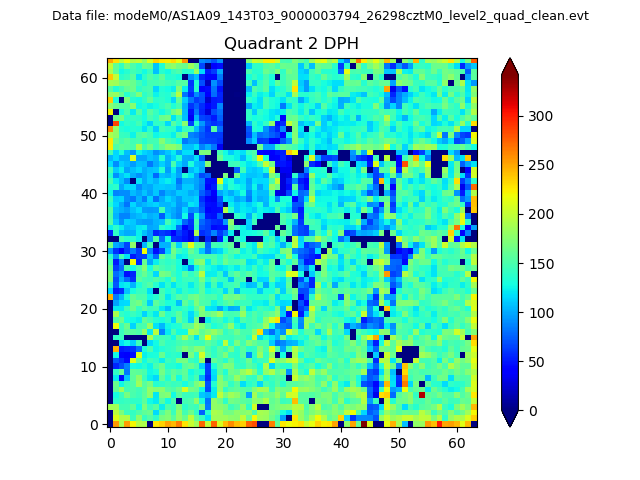 |
Quadrant C |
| Plot type | Count rate plots | Images |
|---|---|---|
| Comparison with Poisson distribution Blue bars denote a histogram of data divided into 1 sec bins. Red curve is a Poisson curve with rate = median count rate of data. |
 |
 |
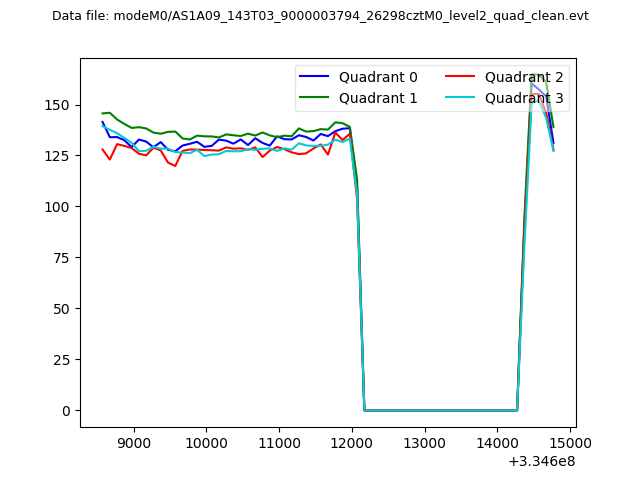
| Quadrant-wise count rates Data is divided into 100 sec bins |
 |
|
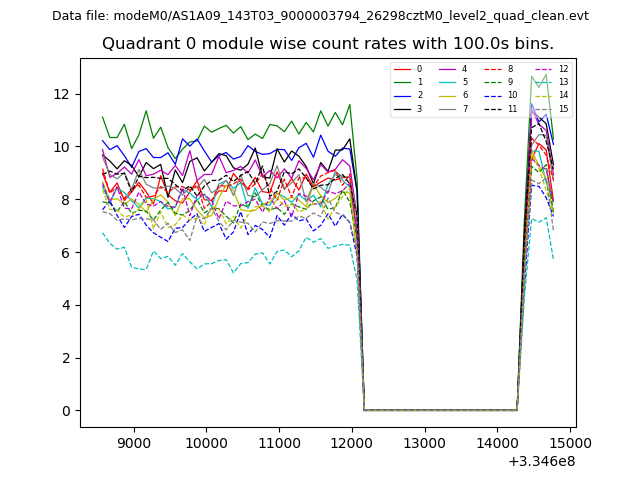
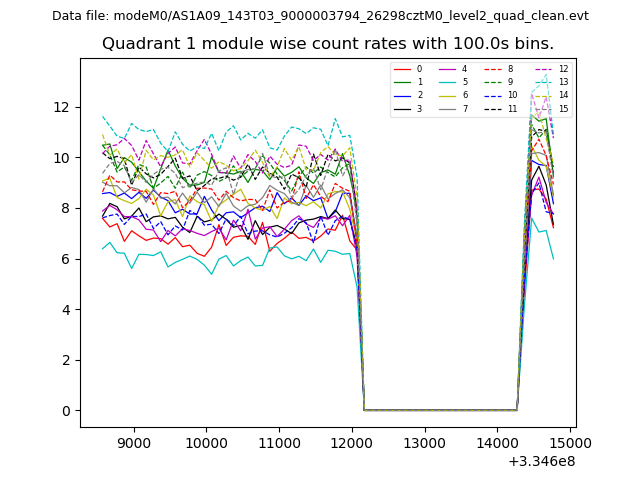
| Module-wise count rates for Quadrant A Data is divided into 100 sec bins |
 |
 |
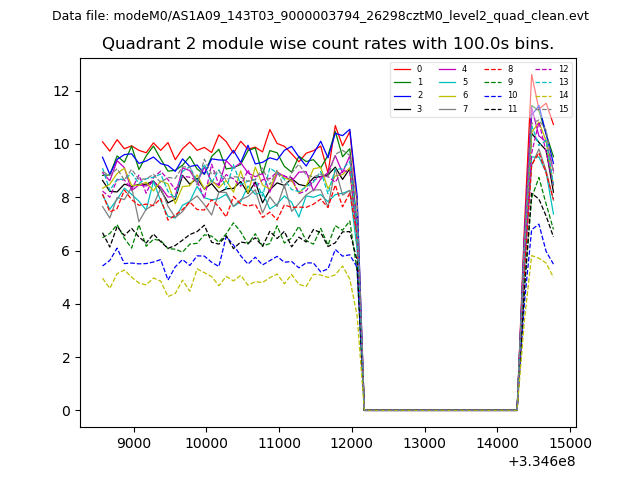
| Module-wise count rates for Quadrant B Data is divided into 100 sec bins |
 |
 |
| Module-wise count rates for Quadrant C Data is divided into 100 sec bins |
 |
 |
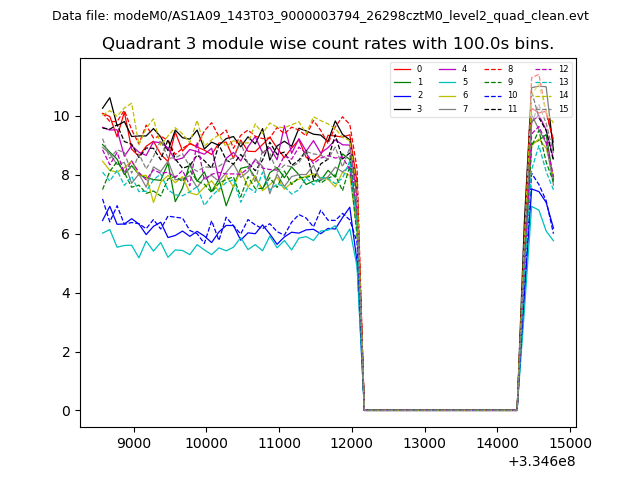
| Module-wise count rates for Quadrant D Data is divided into 100 sec bins |
 |
 |
| Parameter | Plot |
|---|---|
| CZT HV Monitor | 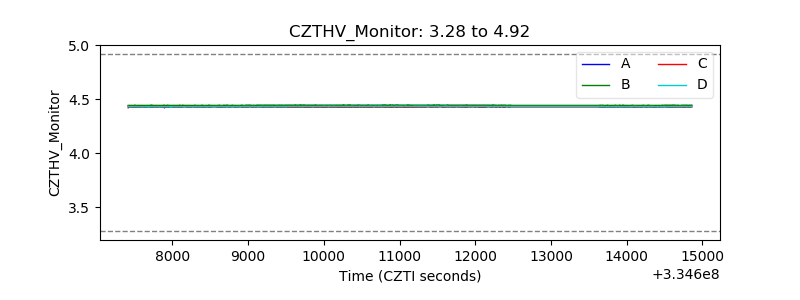 |
| D_VDD | 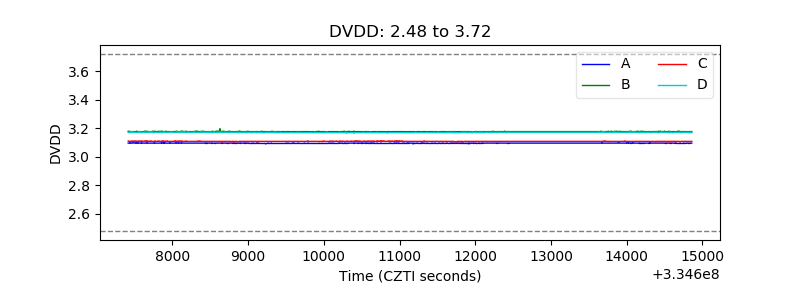 |
| Temperature 1 | 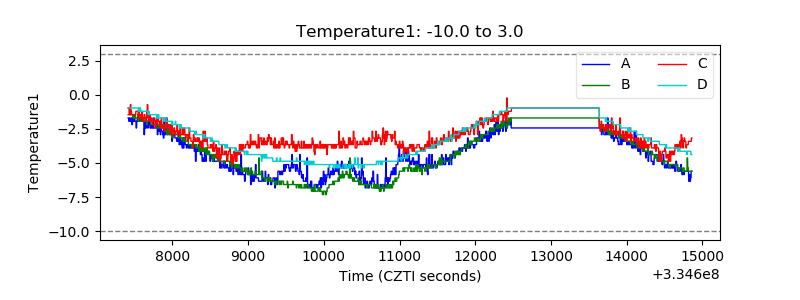 |
| Veto HV Monitor | 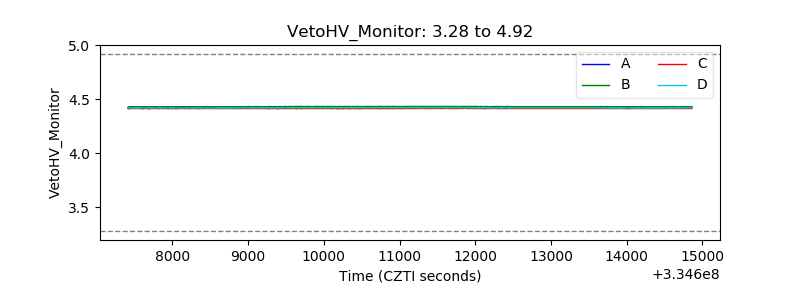 |
| Veto LLD | 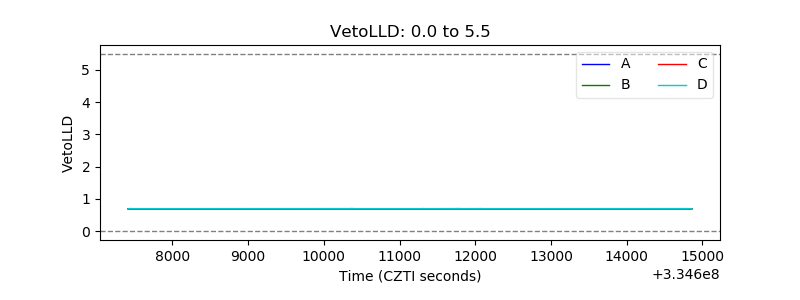 |
| Alpha Counter | 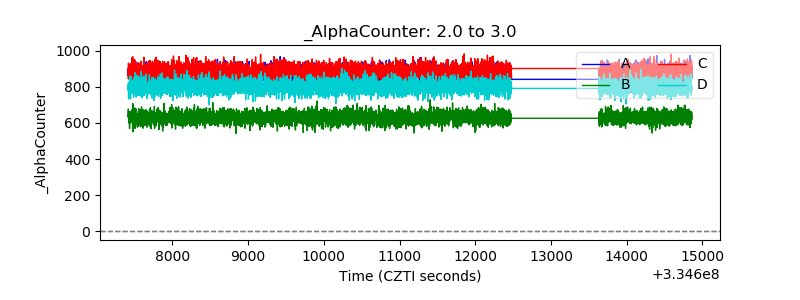 |
| _CPM_Rate | 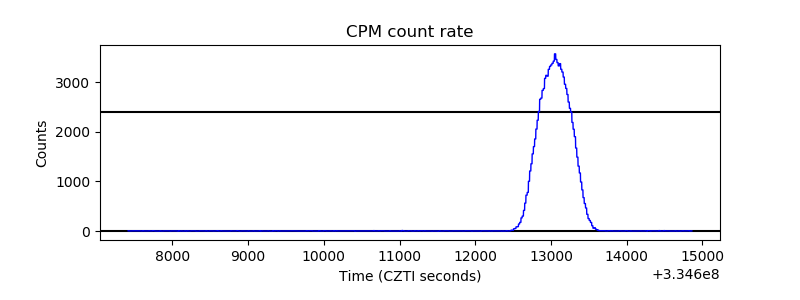 |
| CZT Counter | 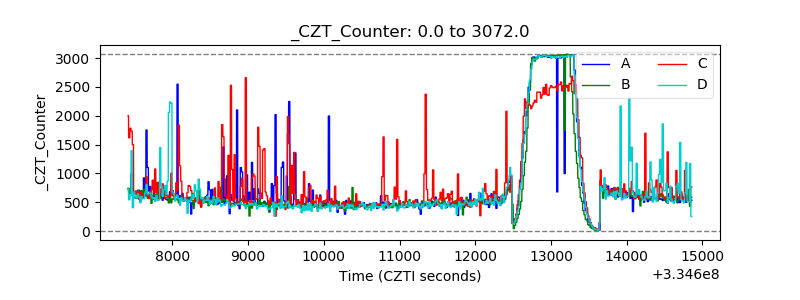 |
| +2.5 Volts monitor |  |
| +5 Volts monitor | 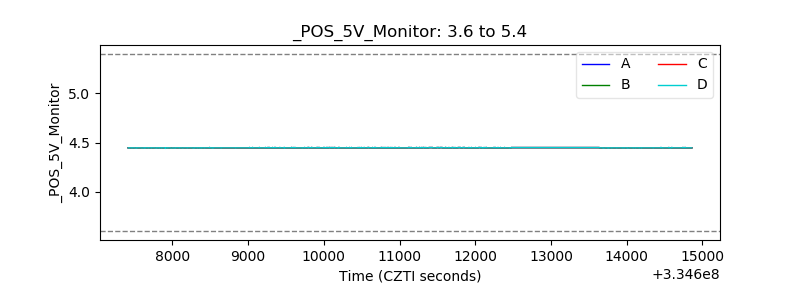 |
| _ROLL_ROT |  |
| _Roll_DEC | 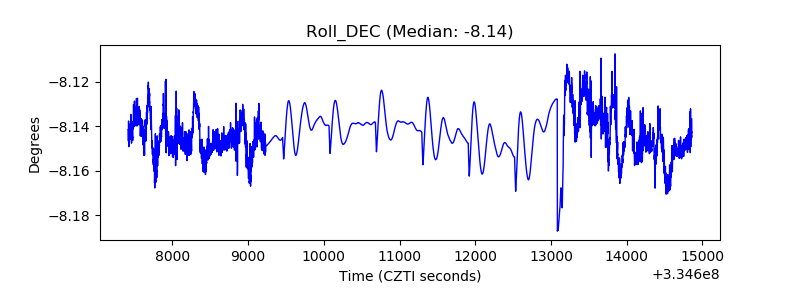 |
| _Roll_RA | 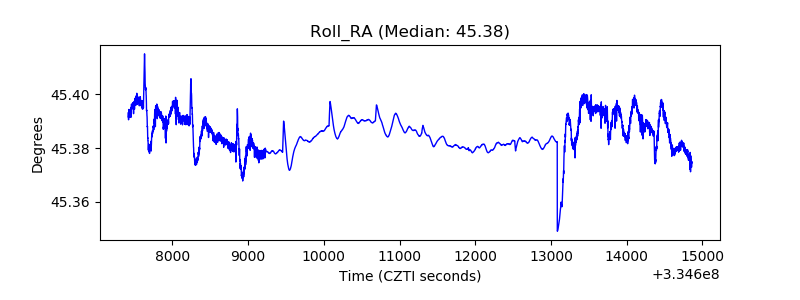 |
| Veto Counter | 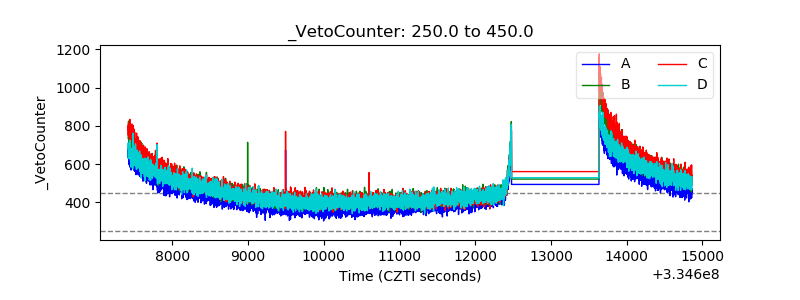 |