| Param | Original file | Final file |
|---|---|---|
| Filename | modeM0/AS1A09_143T03_9000003794_26300cztM0_level2.evt | modeM0/AS1A09_143T03_9000003794_26300cztM0_level2_quad_clean.evt |
| Size (bytes) | 457,490,880 | 113,178,240 |
| Size | 436.3 MB | 107.9 MB |
| Events in quadrant A | 3,267,112 | 746,482 |
| Events in quadrant B | 3,316,224 | 780,957 |
| Events in quadrant C | 3,543,127 | 741,753 |
| Events in quadrant D | 3,311,366 | 729,687 |
| Mode M0 | |||
|---|---|---|---|
| Quadrant | BADHDUFLAG | Total packets | Discarded packets |
| A | 0 | 13500 | 0 |
| B | 0 | 13749 | 0 |
| C | 0 | 14452 | 0 |
| D | 0 | 13691 | 0 |
| Mode M9 | |||
|---|---|---|---|
| Quadrant | BADHDUFLAG | Total packets | Discarded packets |
| A | 0 | 24 | 0 |
| B | 0 | 25 | 0 |
| C | 0 | 25 | 0 |
| D | 0 | 25 | 0 |
| Quadrant | Total seconds | Saturated seconds | Saturation percentage |
|---|---|---|---|
| A | 6142 | 35 | 0.569847% |
| B | 6142 | 56 | 0.911755% |
| C | 6142 | 154 | 2.507327% |
| D | 6142 | 31 | 0.504722% |
Noise dominated data is calculated using 1-second bins in cleaned event files. If a bin has >2000 counts, and if more than 50% of those come from <1% of pixels, then it is considered to be noise-dominated and hence unusable.
| Quadrant | # 1 sec bins | Bins with >0 counts | Bins with >2000 counts | High rate bins dominated by noise | Noise dominated (total time) | Noise dominated (detector-on time) | Marked lightcurve |
|---|---|---|---|---|---|---|---|
| A | 7502 | 6143 | 1 | 1 | 0.01% | 0.02% | 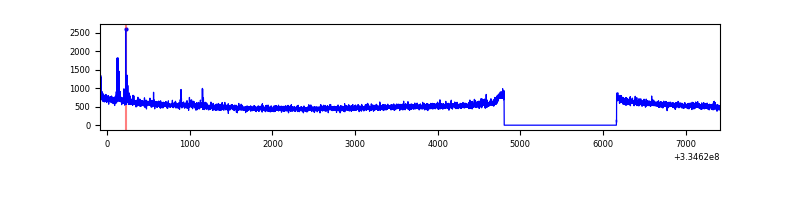 |
| B | 7502 | 6143 | 0 | 0 | 0.00% | 0.00% | 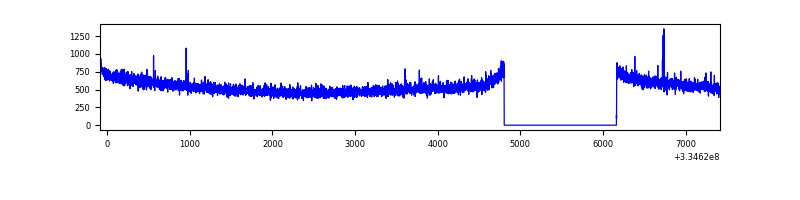 |
| C | 7502 | 6143 | 32 | 32 | 0.43% | 0.52% | 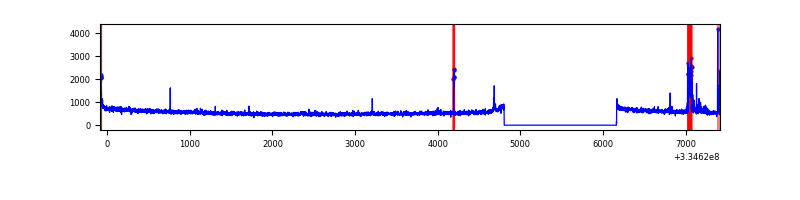 |
| D | 7502 | 6143 | 4 | 4 | 0.05% | 0.07% | 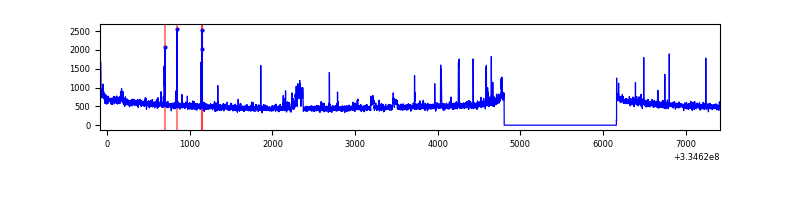 |
Top three noisy pixels from each quadrant. If the there are fewer than three noisy pixels in the level2.evt file, extra rows are filled as -1
| Pixel properties | Quadrant properties | ||||||
|---|---|---|---|---|---|---|---|
| Quadrant | DetID | PixID | Counts | Sigma | Mean | Median | Sigma |
| A | 0 | 13 | 36615 | 215.93 | 835 | 823 | 165.8 |
| A | 7 | 192 | 11176 | 62.46 | 835 | 823 | 165.8 |
| A | 13 | 254 | 10332 | 57.37 | 835 | 823 | 165.8 |
| B | 12 | 111 | 18521 | 111.69 | 848 | 829 | 158.4 |
| B | 11 | 111 | 16129 | 96.59 | 848 | 829 | 158.4 |
| B | 14 | 111 | 14895 | 88.8 | 848 | 829 | 158.4 |
| C | 14 | 238 | 133074 | 692.1 | 822 | 831 | 191.1 |
| C | 4 | 254 | 113045 | 587.28 | 822 | 831 | 191.1 |
| C | 3 | 233 | 98113 | 509.13 | 822 | 831 | 191.1 |
| D | 1 | 52 | 131667 | 666.84 | 827 | 810 | 196.2 |
| D | 2 | 234 | 24884 | 122.68 | 827 | 810 | 196.2 |
| D | 11 | 176 | 16936 | 82.18 | 827 | 810 | 196.2 |
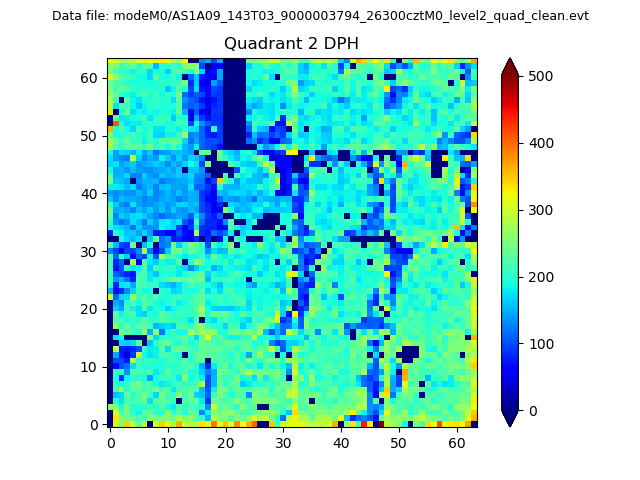
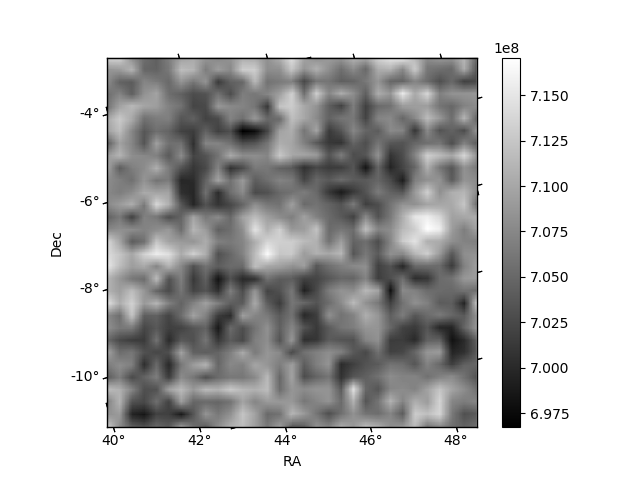
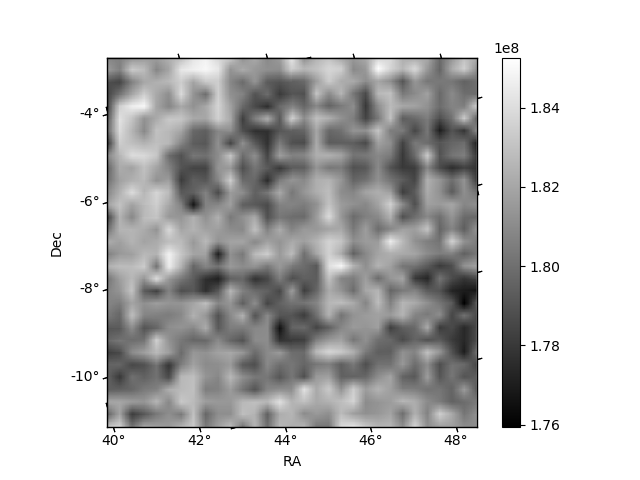
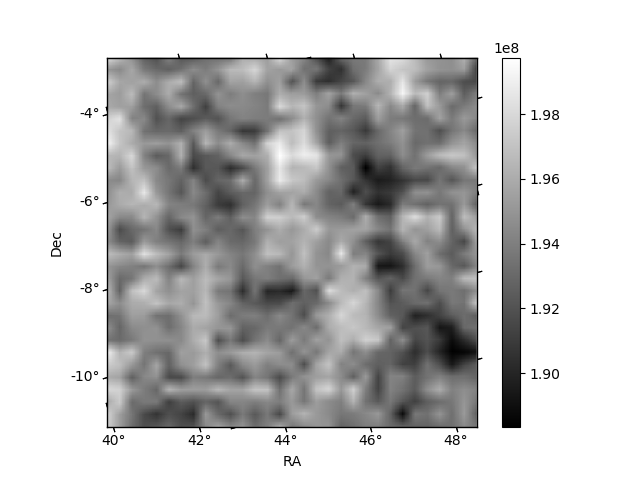
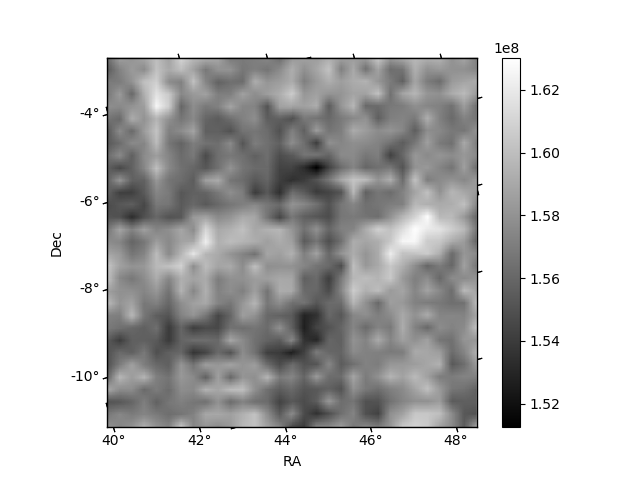
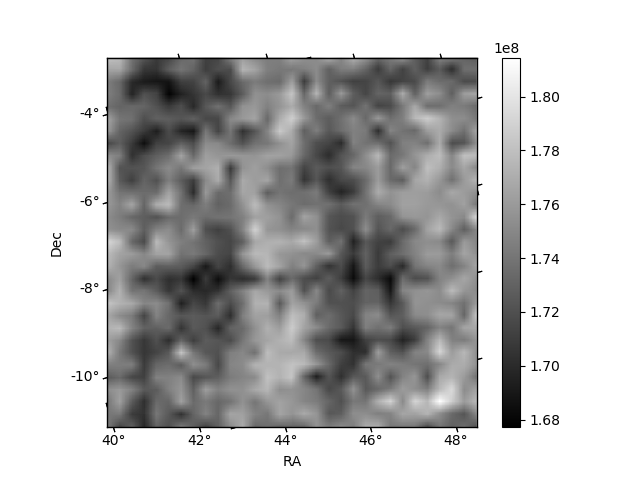
Histogram calculated using DETX and DETY for each event in the final _common_clean file
| Quadrant A | 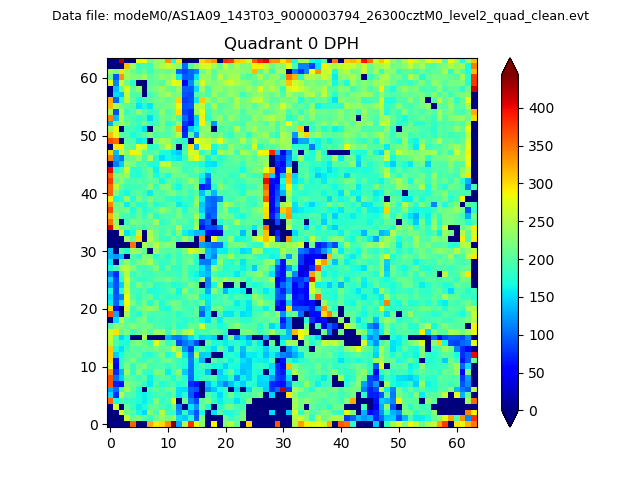 |
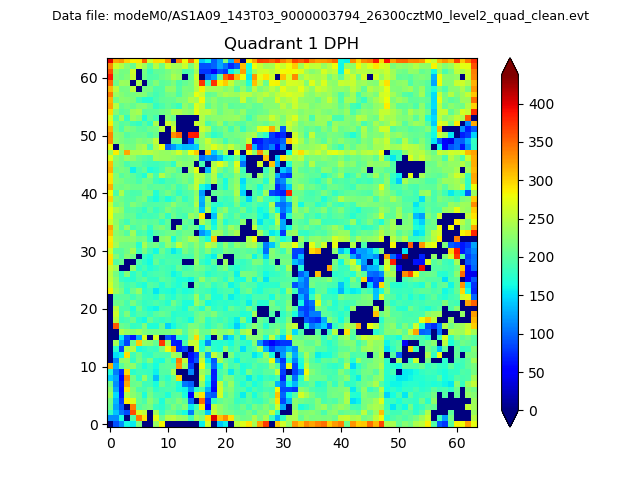 |
Quadrant B |
|---|---|---|---|
| Quadrant D | 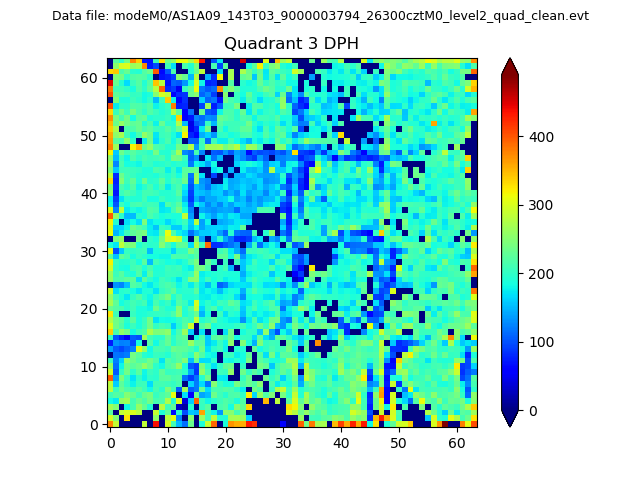 |
 |
Quadrant C |
| Plot type | Count rate plots | Images |
|---|---|---|
| Comparison with Poisson distribution Blue bars denote a histogram of data divided into 1 sec bins. Red curve is a Poisson curve with rate = median count rate of data. |
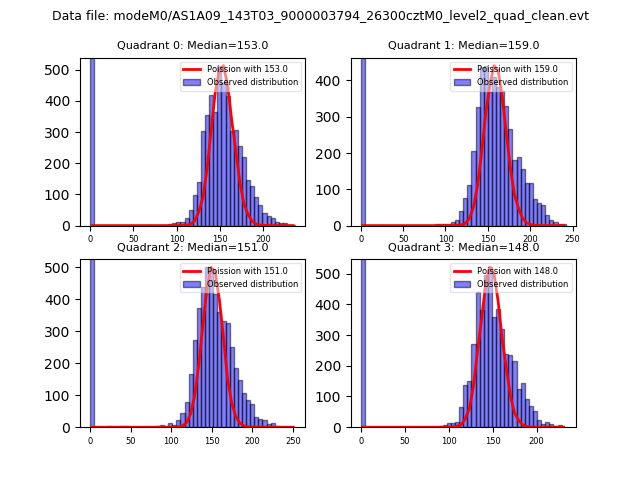 |
 |
| Quadrant-wise count rates Data is divided into 100 sec bins |
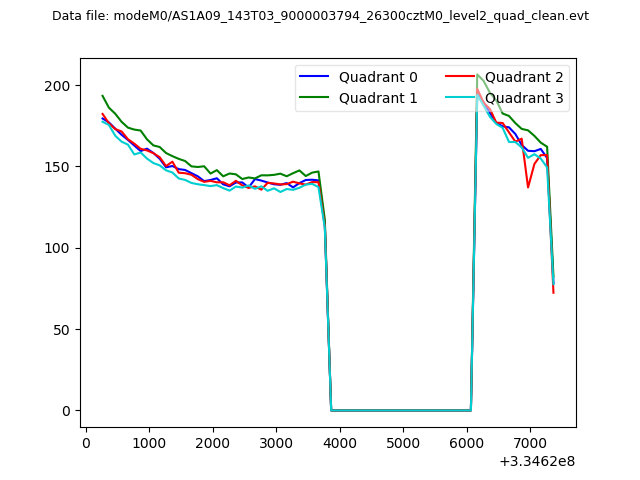 |
|
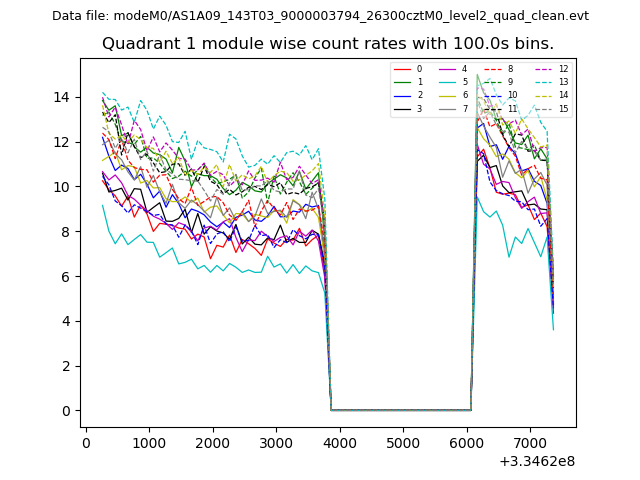
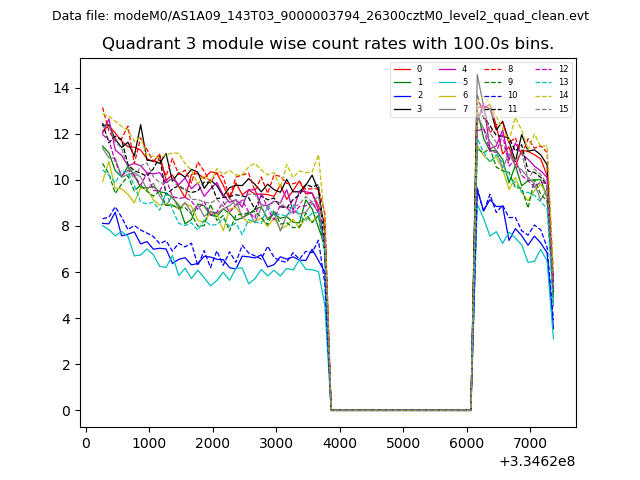
| Module-wise count rates for Quadrant A Data is divided into 100 sec bins |
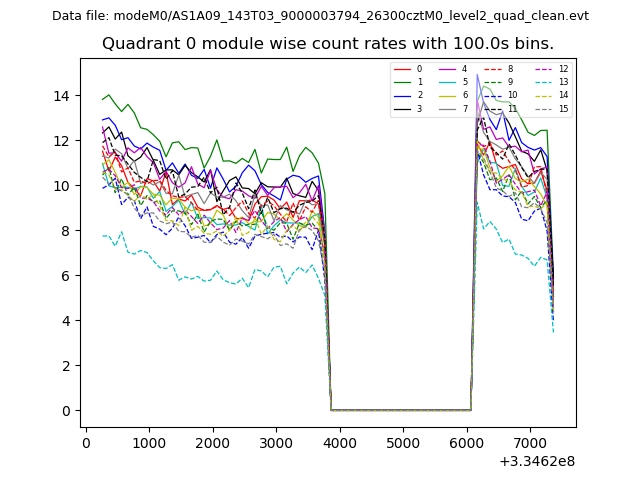 |
 |
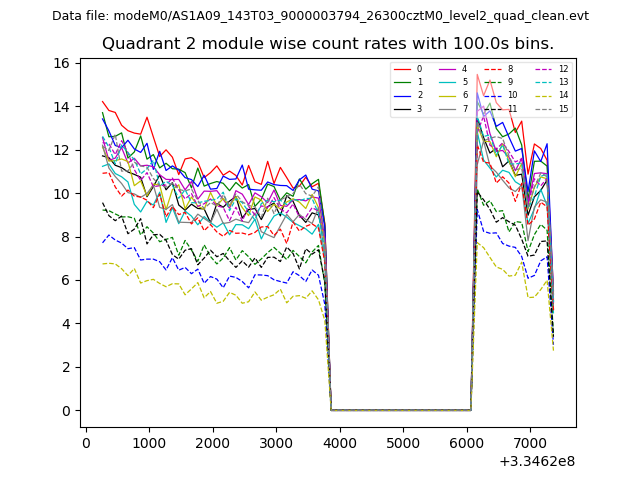
| Module-wise count rates for Quadrant B Data is divided into 100 sec bins |
 |
 |
| Module-wise count rates for Quadrant C Data is divided into 100 sec bins |
 |
 |
| Module-wise count rates for Quadrant D Data is divided into 100 sec bins |
 |
 |
| Parameter | Plot |
|---|---|
| CZT HV Monitor | 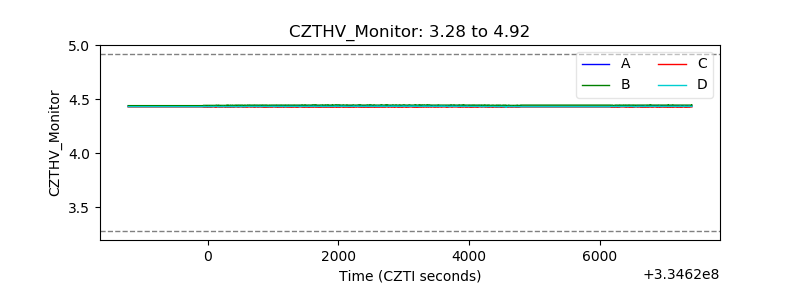 |
| D_VDD | 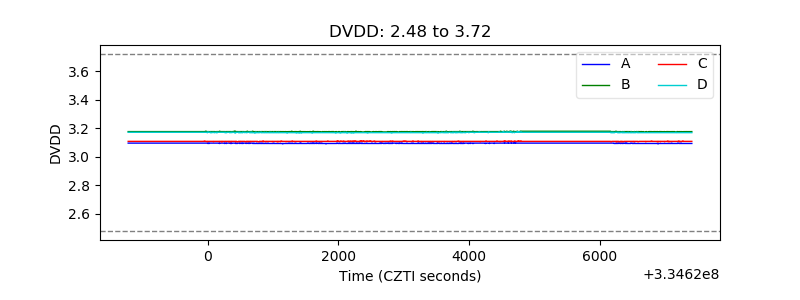 |
| Temperature 1 | 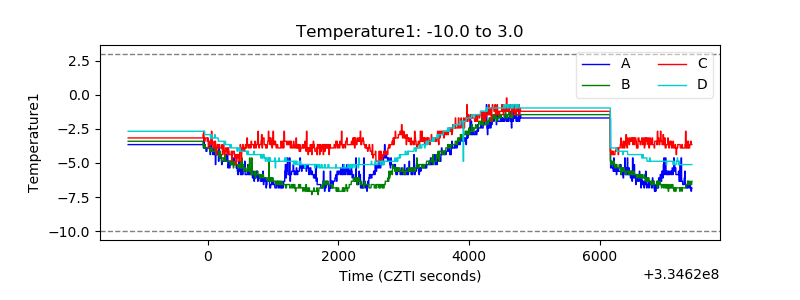 |
| Veto HV Monitor | 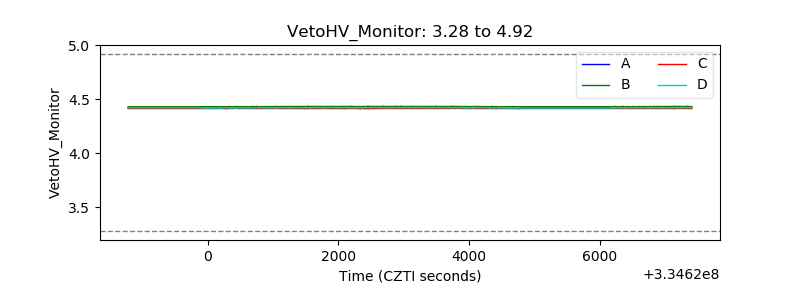 |
| Veto LLD | 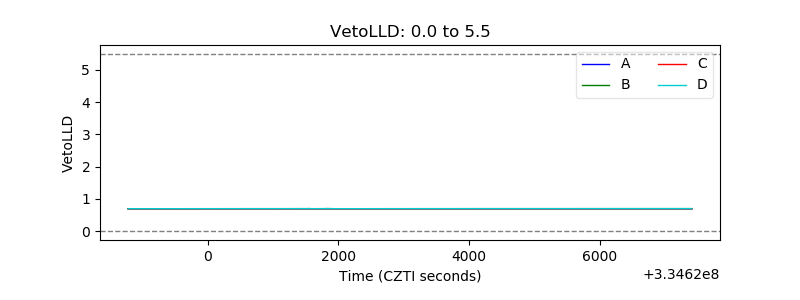 |
| Alpha Counter | 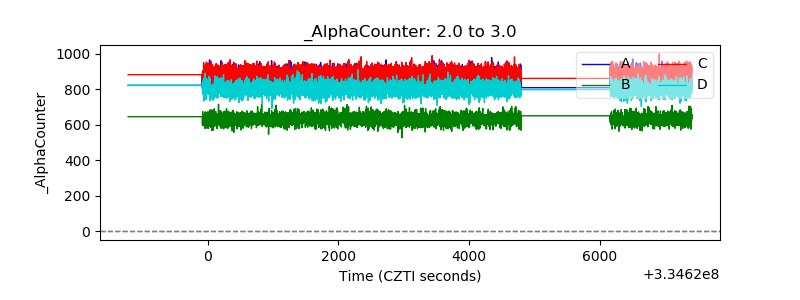 |
| _CPM_Rate | 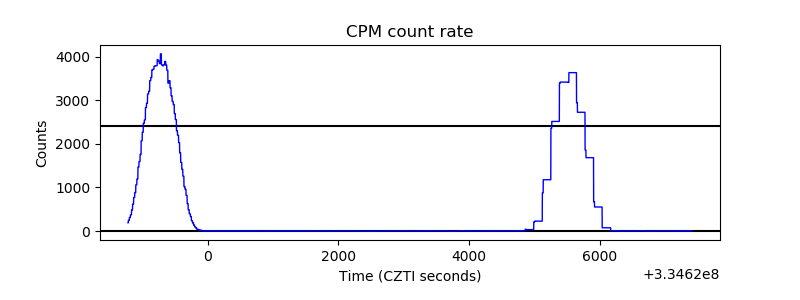 |
| CZT Counter | 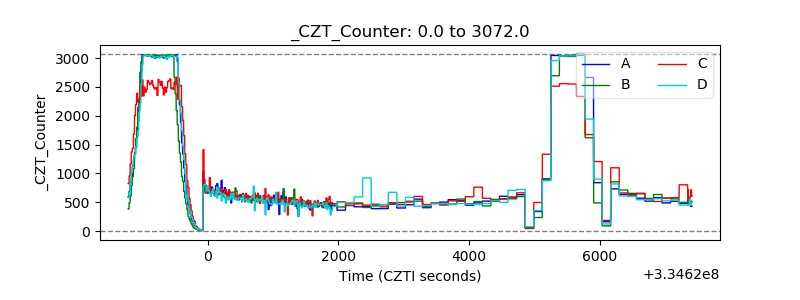 |
| +2.5 Volts monitor |  |
| +5 Volts monitor | 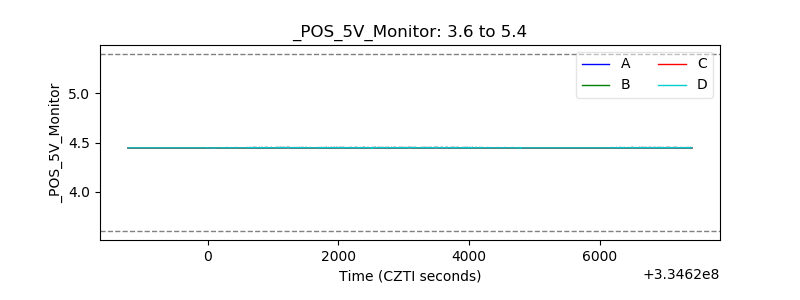 |
| _ROLL_ROT | 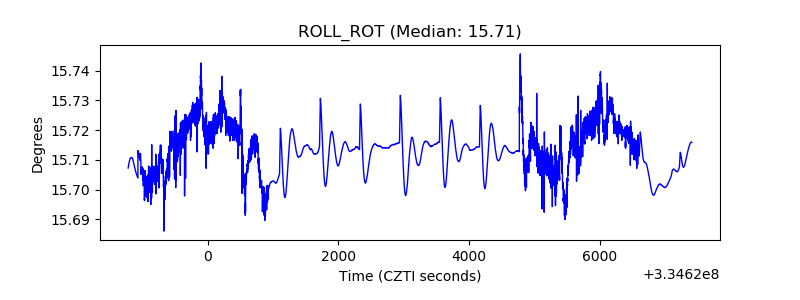 |
| _Roll_DEC | 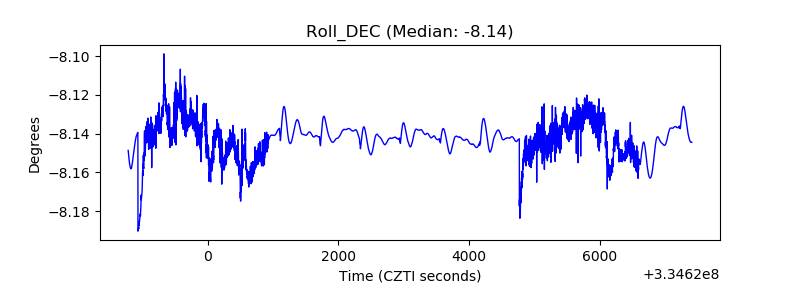 |
| _Roll_RA | 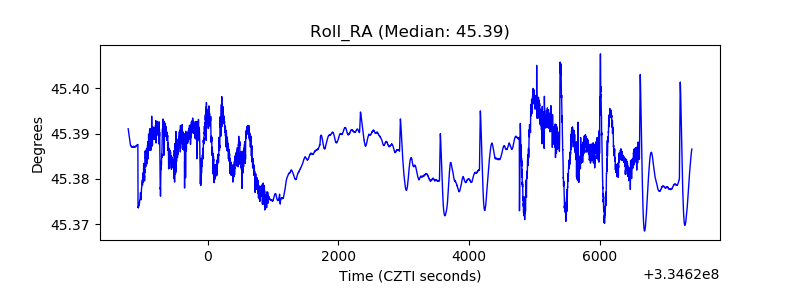 |
| Veto Counter | 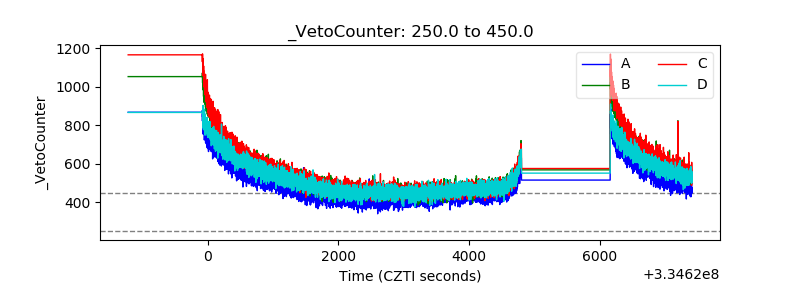 |