| Param | Original file | Final file |
|---|---|---|
| Filename | modeM0/AS1A09_143T03_9000003794_26301cztM0_level2.evt | modeM0/AS1A09_143T03_9000003794_26301cztM0_level2_quad_clean.evt |
| Size (bytes) | 458,614,080 | 111,087,360 |
| Size | 437.4 MB | 105.9 MB |
| Events in quadrant A | 3,200,421 | 733,350 |
| Events in quadrant B | 3,248,868 | 767,902 |
| Events in quadrant C | 3,924,857 | 719,280 |
| Events in quadrant D | 3,099,919 | 717,227 |
| Mode M0 | |||
|---|---|---|---|
| Quadrant | BADHDUFLAG | Total packets | Discarded packets |
| A | 0 | 13219 | 0 |
| B | 0 | 13404 | 0 |
| C | 0 | 15526 | 0 |
| D | 0 | 12998 | 0 |
| Mode M9 | |||
|---|---|---|---|
| Quadrant | BADHDUFLAG | Total packets | Discarded packets |
| A | 0 | 16 | 0 |
| B | 0 | 17 | 0 |
| C | 0 | 17 | 0 |
| D | 0 | 17 | 0 |
| Quadrant | Total seconds | Saturated seconds | Saturation percentage |
|---|---|---|---|
| A | 6114 | 32 | 0.523389% |
| B | 6114 | 49 | 0.801439% |
| C | 6113 | 267 | 4.367741% |
| D | 6113 | 33 | 0.539833% |
Noise dominated data is calculated using 1-second bins in cleaned event files. If a bin has >2000 counts, and if more than 50% of those come from <1% of pixels, then it is considered to be noise-dominated and hence unusable.
| Quadrant | # 1 sec bins | Bins with >0 counts | Bins with >2000 counts | High rate bins dominated by noise | Noise dominated (total time) | Noise dominated (detector-on time) | Marked lightcurve |
|---|---|---|---|---|---|---|---|
| A | 7474 | 6115 | 0 | 0 | 0.00% | 0.00% | 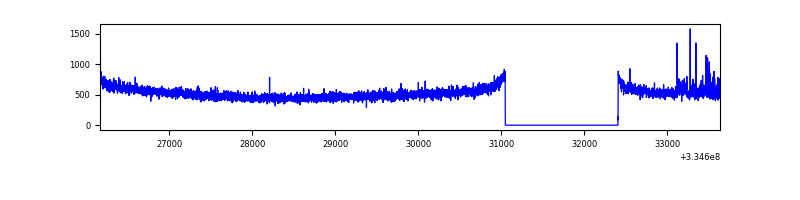 |
| B | 7474 | 6115 | 0 | 0 | 0.00% | 0.00% | 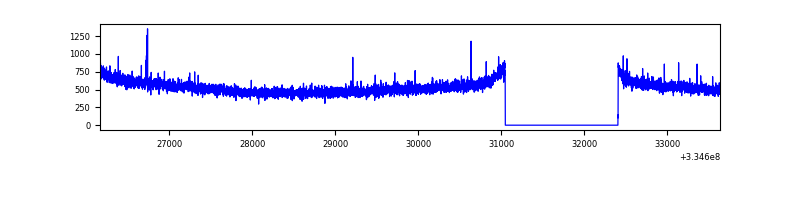 |
| C | 7473 | 6114 | 137 | 137 | 1.83% | 2.24% | 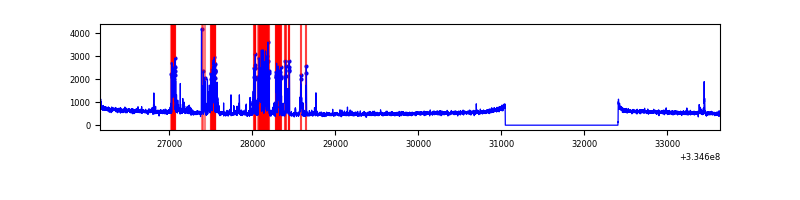 |
| D | 7473 | 6114 | 1 | 1 | 0.01% | 0.02% | 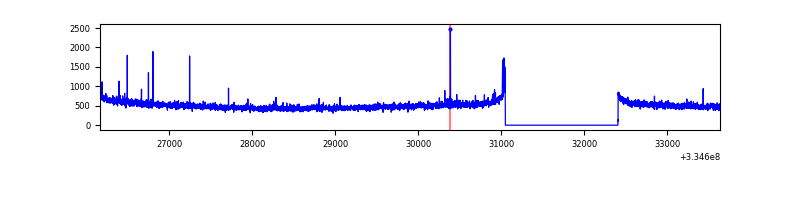 |
Top three noisy pixels from each quadrant. If the there are fewer than three noisy pixels in the level2.evt file, extra rows are filled as -1
| Pixel properties | Quadrant properties | ||||||
|---|---|---|---|---|---|---|---|
| Quadrant | DetID | PixID | Counts | Sigma | Mean | Median | Sigma |
| A | 0 | 13 | 41220 | 248.69 | 819 | 805 | 162.5 |
| A | 13 | 254 | 9937 | 56.19 | 819 | 805 | 162.5 |
| A | 3 | 137 | 6993 | 38.08 | 819 | 805 | 162.5 |
| B | 12 | 111 | 18248 | 112.29 | 830 | 812 | 155.3 |
| B | 11 | 111 | 16079 | 98.32 | 830 | 812 | 155.3 |
| B | 14 | 111 | 14770 | 89.89 | 830 | 812 | 155.3 |
| C | 4 | 254 | 593842 | 3216.74 | 799 | 807 | 184.4 |
| C | 14 | 238 | 127432 | 686.84 | 799 | 807 | 184.4 |
| C | 3 | 233 | 89513 | 481.16 | 799 | 807 | 184.4 |
| D | 2 | 234 | 24848 | 125.81 | 807 | 789 | 191.2 |
| D | 10 | 103 | 19230 | 96.43 | 807 | 789 | 191.2 |
| D | 2 | 153 | 9140 | 43.67 | 807 | 789 | 191.2 |
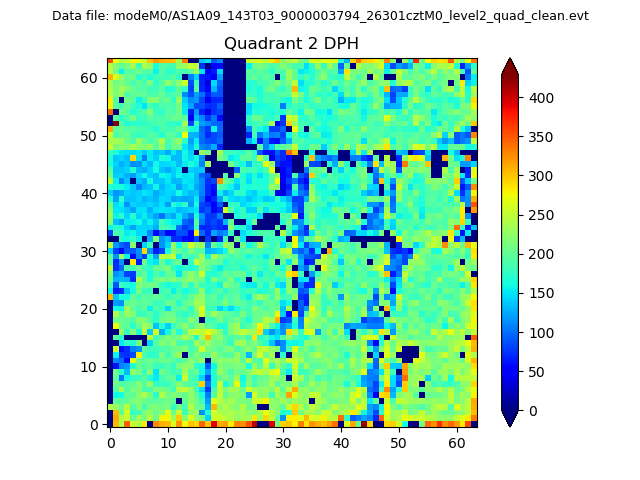
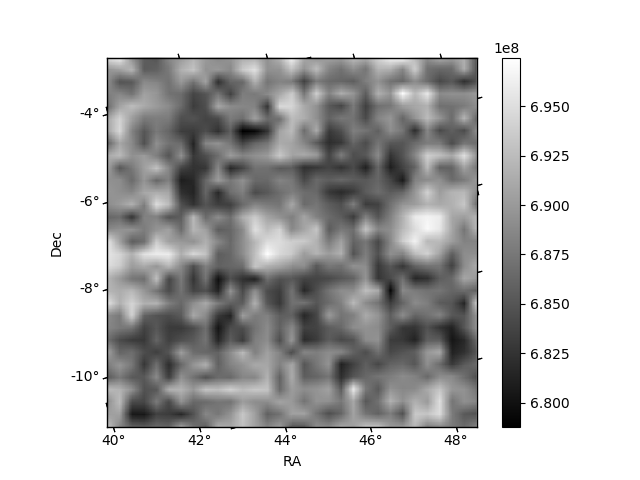
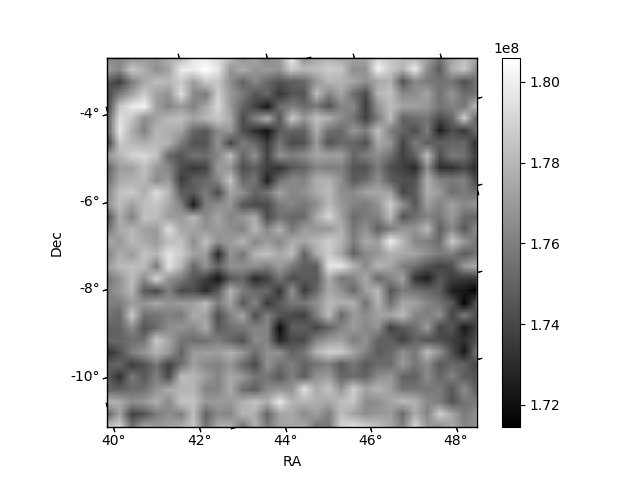
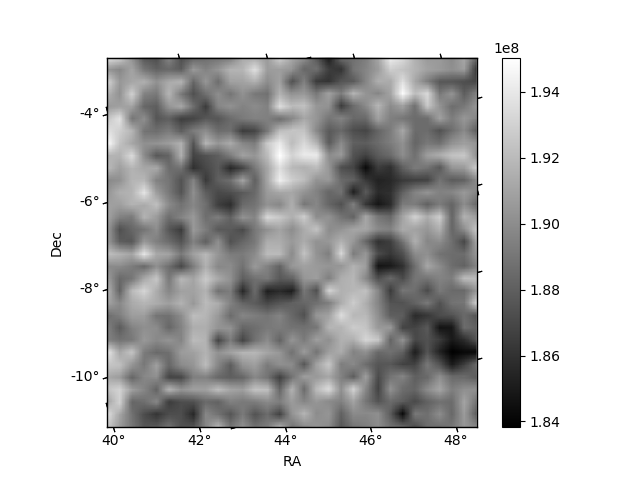
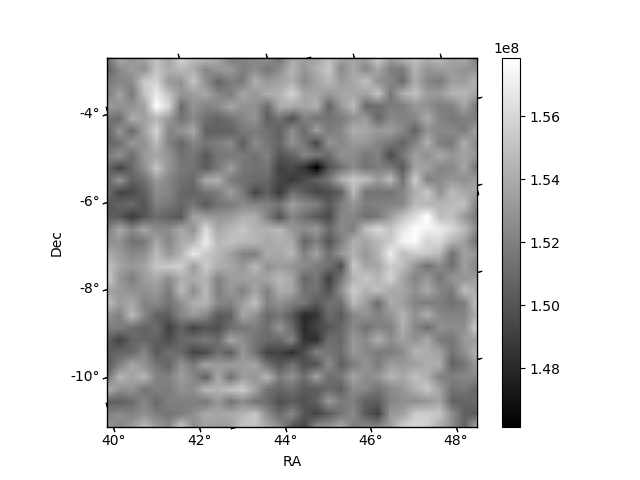
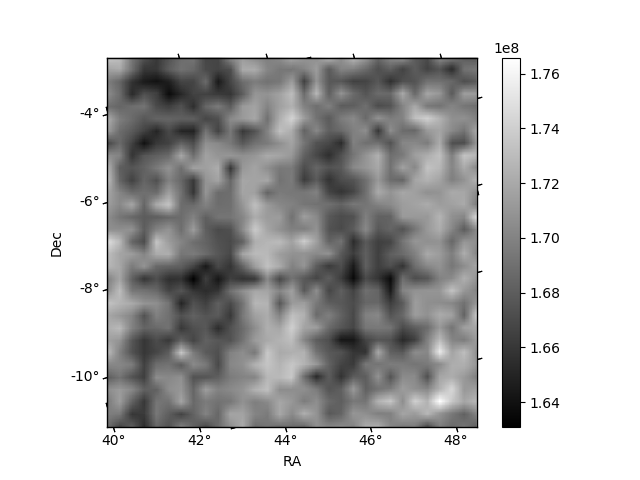
Histogram calculated using DETX and DETY for each event in the final _common_clean file
| Quadrant A | 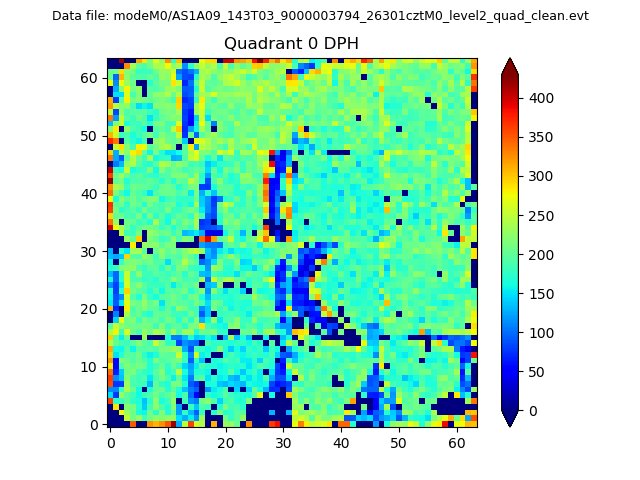 |
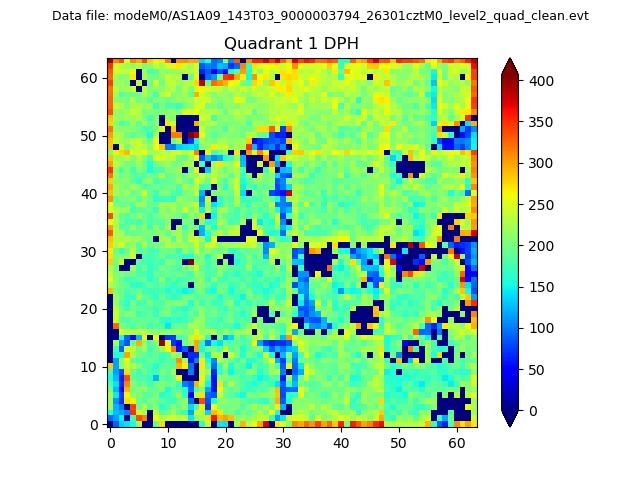 |
Quadrant B |
|---|---|---|---|
| Quadrant D | 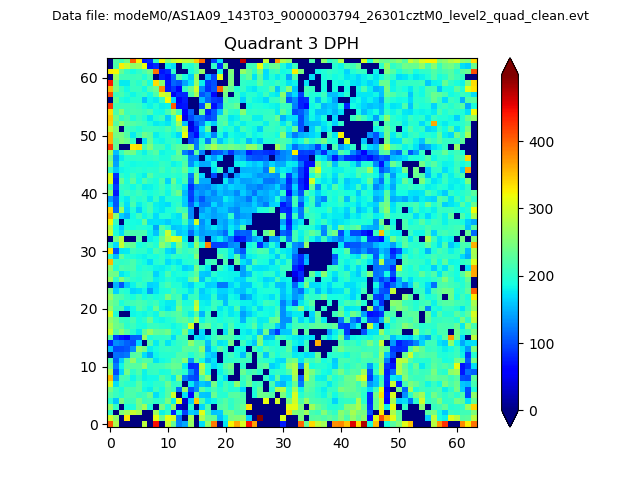 |
 |
Quadrant C |
| Plot type | Count rate plots | Images |
|---|---|---|
| Comparison with Poisson distribution Blue bars denote a histogram of data divided into 1 sec bins. Red curve is a Poisson curve with rate = median count rate of data. |
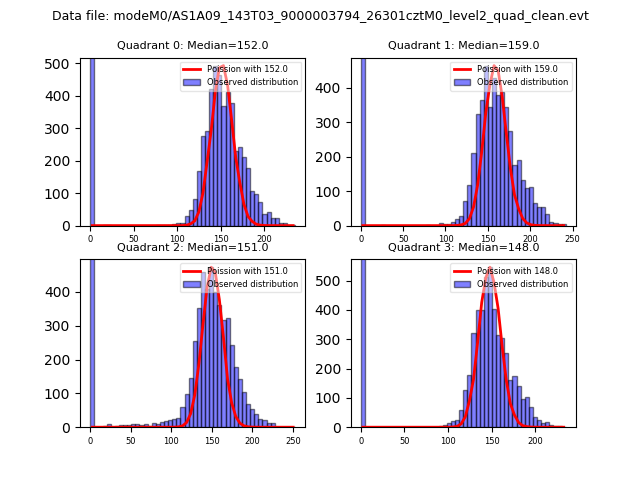 |
 |
| Quadrant-wise count rates Data is divided into 100 sec bins |
 |
|
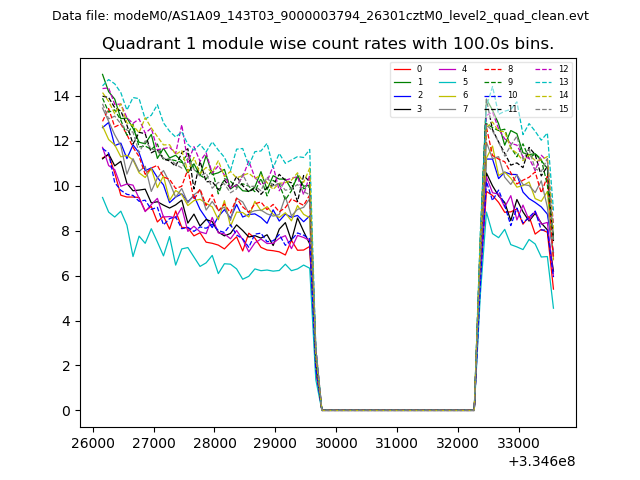
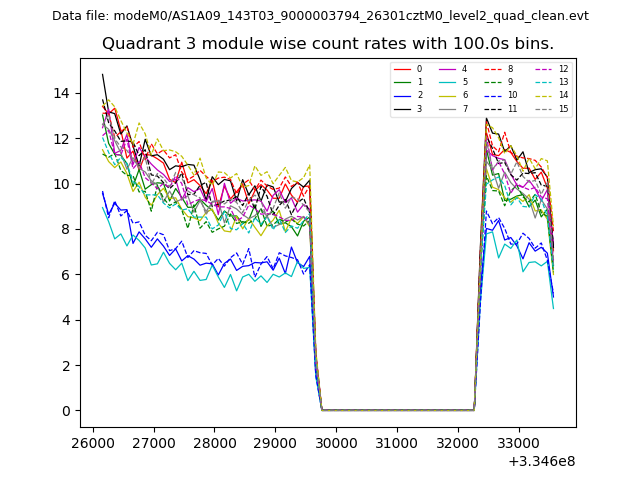
| Module-wise count rates for Quadrant A Data is divided into 100 sec bins |
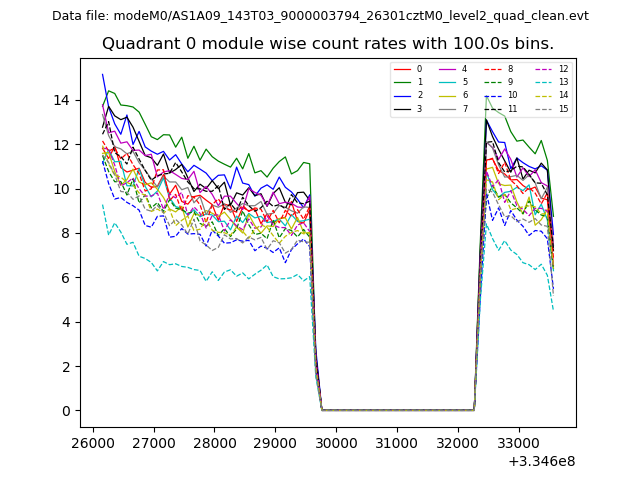 |
 |
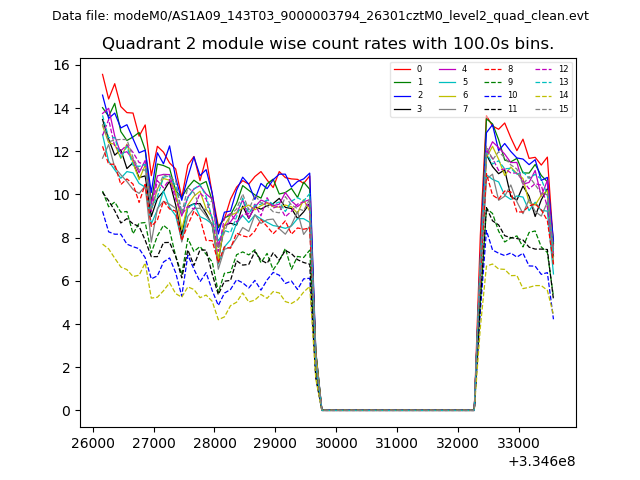
| Module-wise count rates for Quadrant B Data is divided into 100 sec bins |
 |
 |
| Module-wise count rates for Quadrant C Data is divided into 100 sec bins |
 |
 |
| Module-wise count rates for Quadrant D Data is divided into 100 sec bins |
 |
 |
| Parameter | Plot |
|---|---|
| CZT HV Monitor | 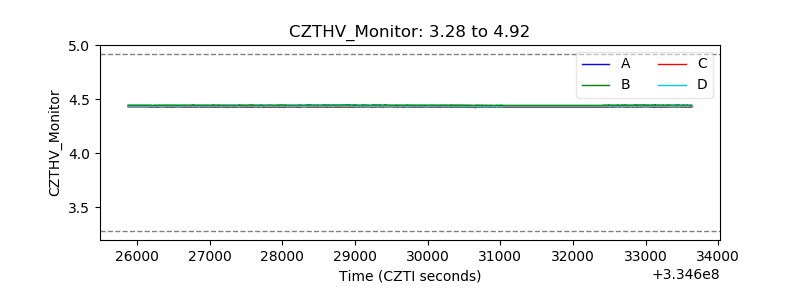 |
| D_VDD | 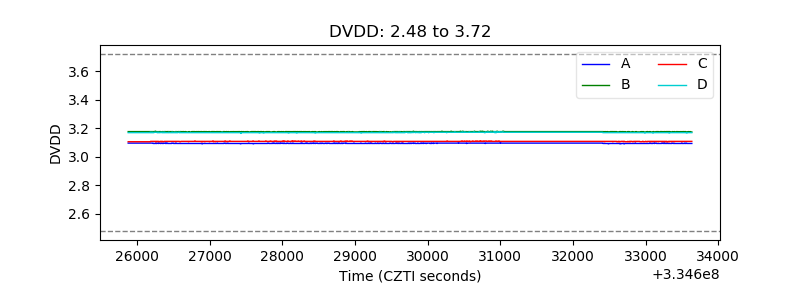 |
| Temperature 1 | 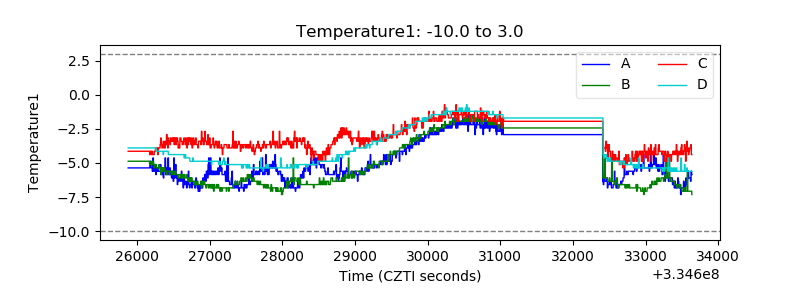 |
| Veto HV Monitor | 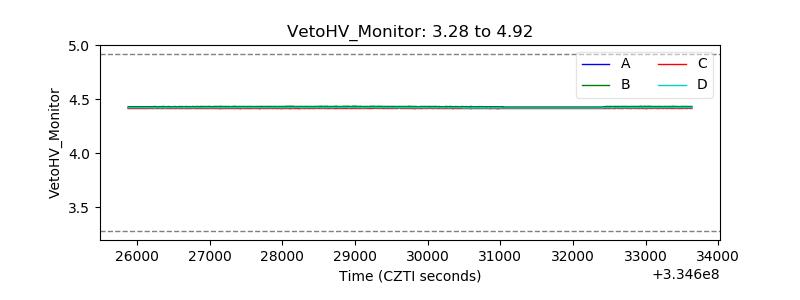 |
| Veto LLD |  |
| Alpha Counter |  |
| _CPM_Rate | 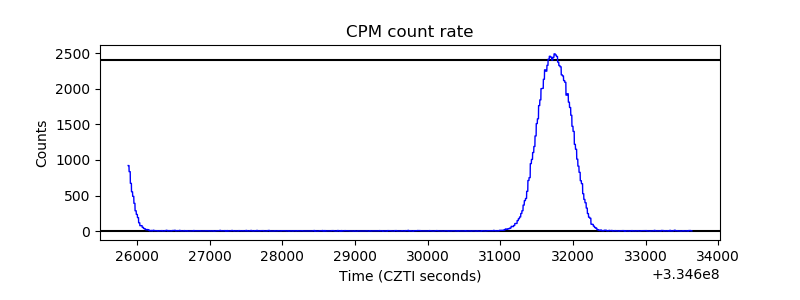 |
| CZT Counter |  |
| +2.5 Volts monitor |  |
| +5 Volts monitor |  |
| _ROLL_ROT | 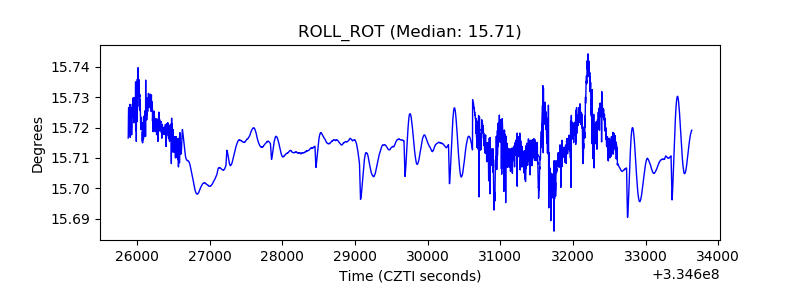 |
| _Roll_DEC | 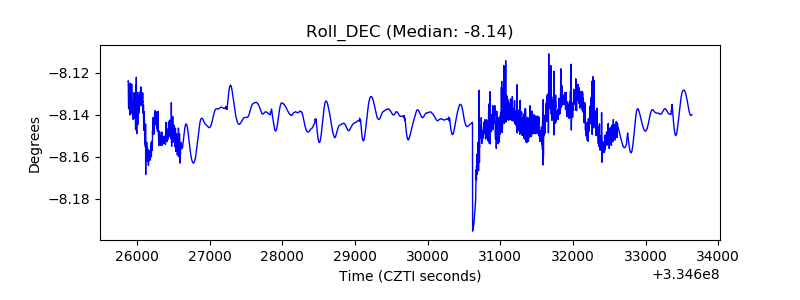 |
| _Roll_RA | 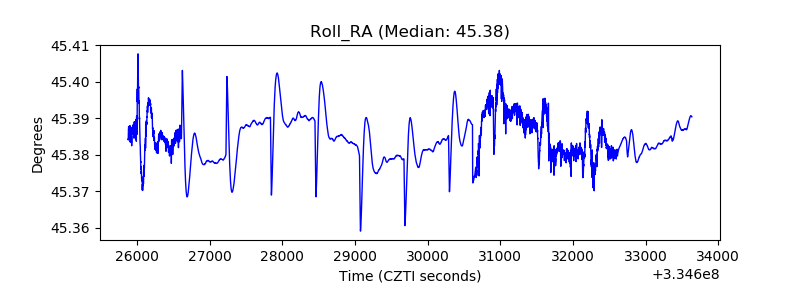 |
| Veto Counter | 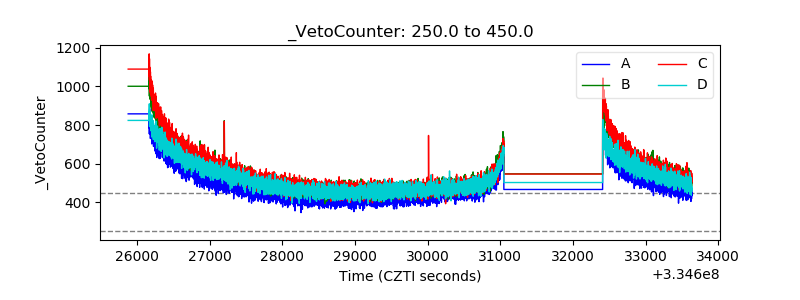 |