| Param | Original file | Final file |
|---|---|---|
| Filename | modeM0/AS1A09_143T03_9000003794_26302cztM0_level2.evt | modeM0/AS1A09_143T03_9000003794_26302cztM0_level2_quad_clean.evt |
| Size (bytes) | 441,282,240 | 99,342,720 |
| Size | 420.8 MB | 94.7 MB |
| Events in quadrant A | 3,348,220 | 641,759 |
| Events in quadrant B | 3,185,815 | 669,044 |
| Events in quadrant C | 3,347,842 | 638,629 |
| Events in quadrant D | 3,060,451 | 625,790 |
| Mode M0 | |||
|---|---|---|---|
| Quadrant | BADHDUFLAG | Total packets | Discarded packets |
| A | 0 | 13741 | 0 |
| B | 0 | 13203 | 0 |
| C | 0 | 13622 | 0 |
| D | 0 | 13042 | 0 |
| Mode M9 | |||
|---|---|---|---|
| Quadrant | BADHDUFLAG | Total packets | Discarded packets |
| A | 0 | 23 | 0 |
| B | 0 | 24 | 0 |
| C | 0 | 24 | 0 |
| D | 0 | 24 | 0 |
| Quadrant | Total seconds | Saturated seconds | Saturation percentage |
|---|---|---|---|
| A | 6210 | 33 | 0.531401% |
| B | 6210 | 32 | 0.515298% |
| C | 6210 | 78 | 1.256039% |
| D | 6210 | 15 | 0.241546% |
Noise dominated data is calculated using 1-second bins in cleaned event files. If a bin has >2000 counts, and if more than 50% of those come from <1% of pixels, then it is considered to be noise-dominated and hence unusable.
| Quadrant | # 1 sec bins | Bins with >0 counts | Bins with >2000 counts | High rate bins dominated by noise | Noise dominated (total time) | Noise dominated (detector-on time) | Marked lightcurve |
|---|---|---|---|---|---|---|---|
| A | 7505 | 6211 | 13 | 13 | 0.17% | 0.21% | 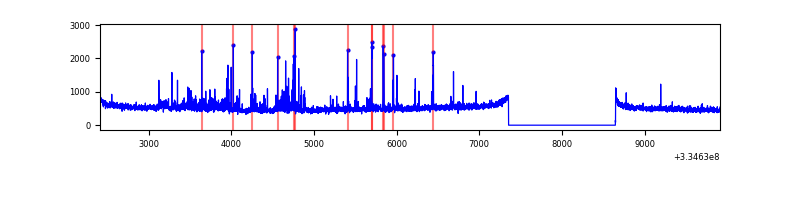 |
| B | 7505 | 6211 | 0 | 0 | 0.00% | 0.00% | 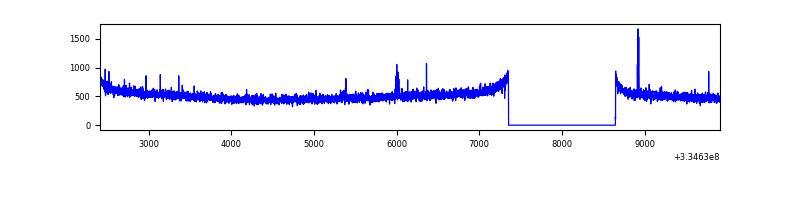 |
| C | 7505 | 6211 | 11 | 11 | 0.15% | 0.18% | 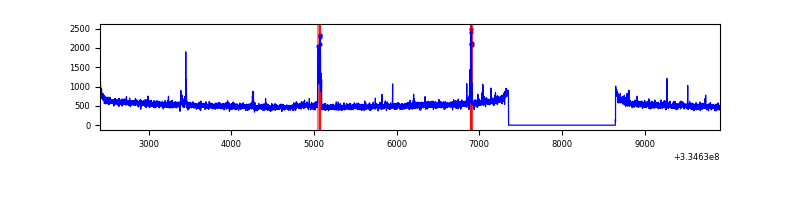 |
| D | 7505 | 6211 | 10 | 10 | 0.13% | 0.16% | 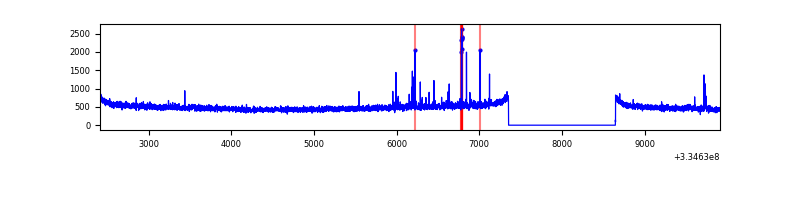 |
Top three noisy pixels from each quadrant. If the there are fewer than three noisy pixels in the level2.evt file, extra rows are filled as -1
| Pixel properties | Quadrant properties | ||||||
|---|---|---|---|---|---|---|---|
| Quadrant | DetID | PixID | Counts | Sigma | Mean | Median | Sigma |
| A | 0 | 13 | 250206 | 1552.47 | 803 | 788 | 160.7 |
| A | 13 | 254 | 9622 | 54.99 | 803 | 788 | 160.7 |
| A | 3 | 137 | 7134 | 39.5 | 803 | 788 | 160.7 |
| B | 12 | 111 | 18038 | 111.52 | 812 | 792 | 154.6 |
| B | 11 | 111 | 16233 | 99.85 | 812 | 792 | 154.6 |
| B | 14 | 111 | 14828 | 90.76 | 812 | 792 | 154.6 |
| C | 14 | 238 | 125310 | 678.91 | 788 | 796 | 183.4 |
| C | 3 | 233 | 110678 | 599.13 | 788 | 796 | 183.4 |
| C | 2 | 16 | 40762 | 217.91 | 788 | 796 | 183.4 |
| D | 11 | 176 | 29173 | 152.16 | 790 | 773 | 186.6 |
| D | 2 | 234 | 23291 | 120.65 | 790 | 773 | 186.6 |
| D | 2 | 153 | 21865 | 113.01 | 790 | 773 | 186.6 |
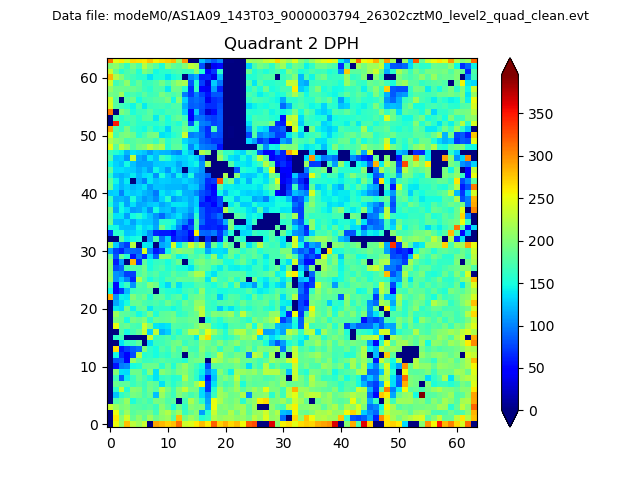
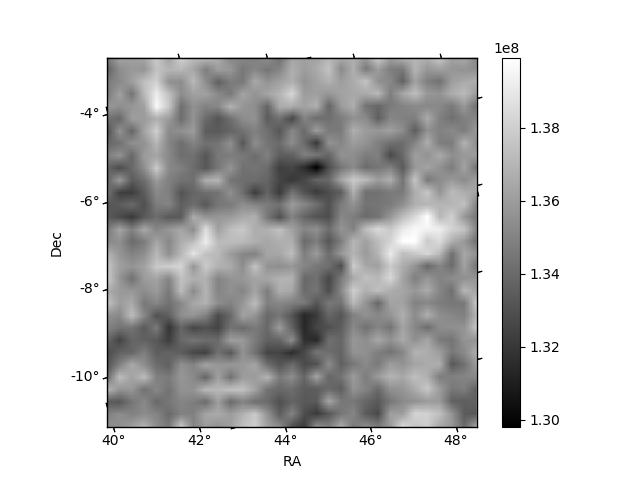
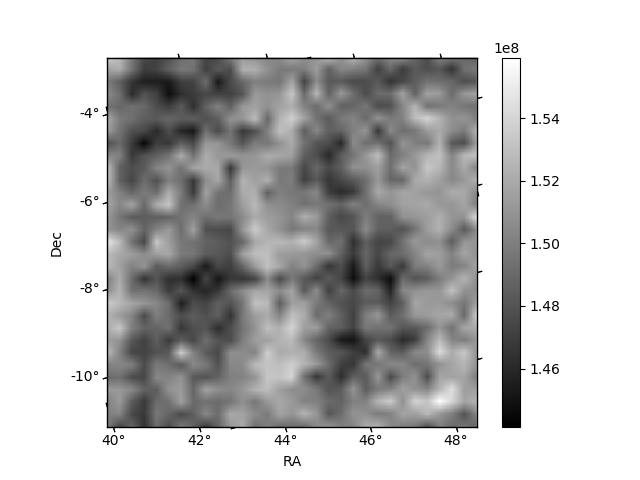
Histogram calculated using DETX and DETY for each event in the final _common_clean file
| Quadrant A | 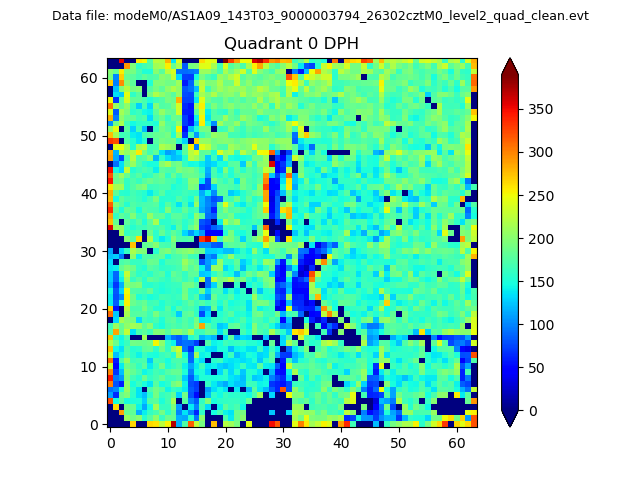 |
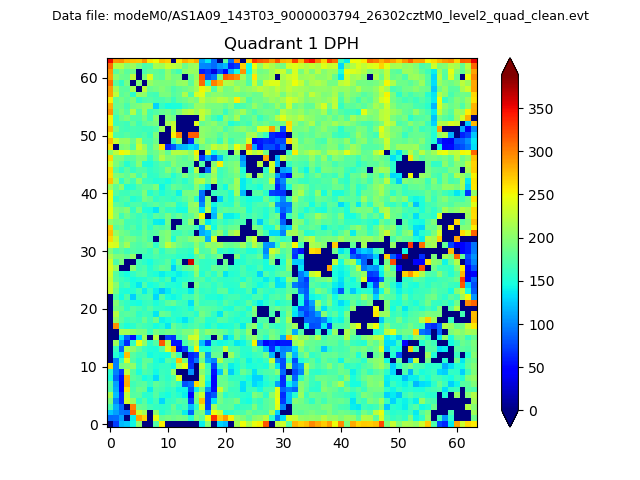 |
Quadrant B |
|---|---|---|---|
| Quadrant D | 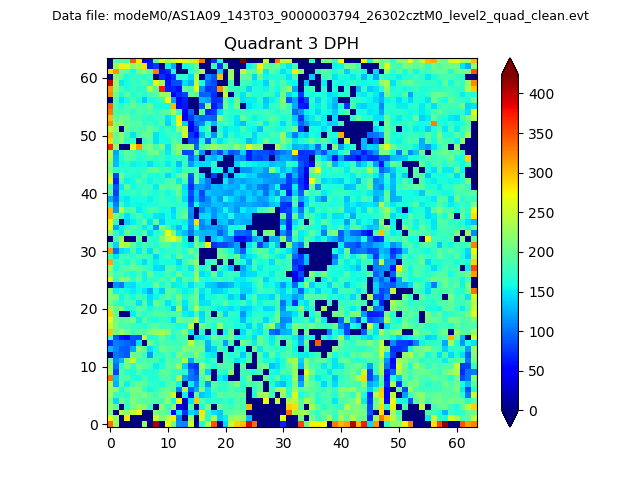 |
 |
Quadrant C |
| Plot type | Count rate plots | Images |
|---|---|---|
| Comparison with Poisson distribution Blue bars denote a histogram of data divided into 1 sec bins. Red curve is a Poisson curve with rate = median count rate of data. |
 |
 |
| Quadrant-wise count rates Data is divided into 100 sec bins |
 |
|
| Module-wise count rates for Quadrant A Data is divided into 100 sec bins |
 |
 |
| Module-wise count rates for Quadrant B Data is divided into 100 sec bins |
 |
 |
| Module-wise count rates for Quadrant C Data is divided into 100 sec bins |
 |
 |
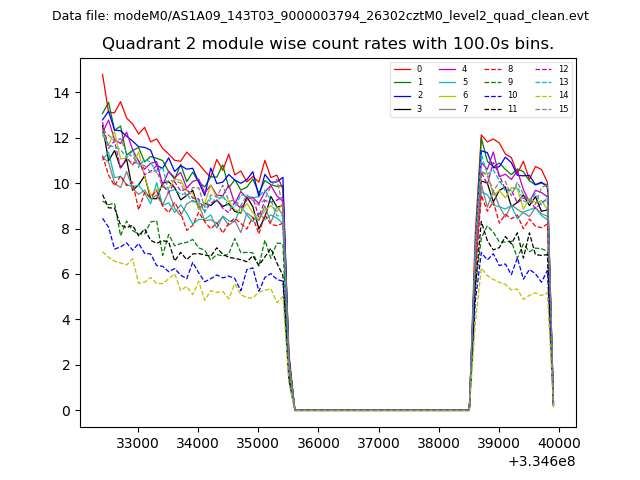
| Module-wise count rates for Quadrant D Data is divided into 100 sec bins |
 |
 |
| Parameter | Plot |
|---|---|
| CZT HV Monitor | 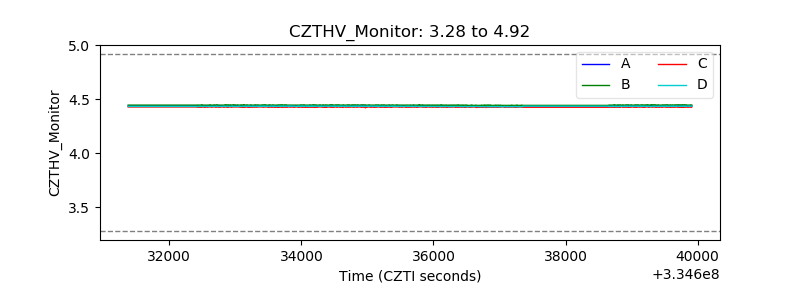 |
| D_VDD | 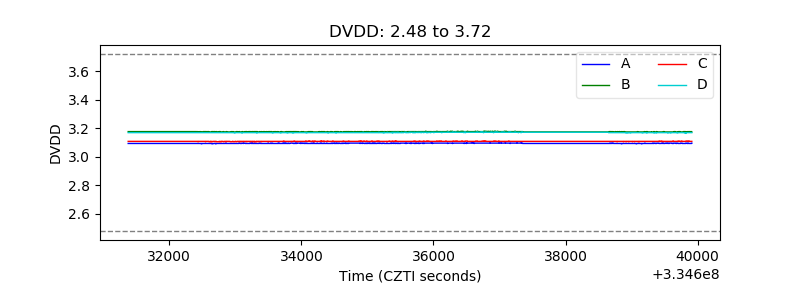 |
| Temperature 1 | 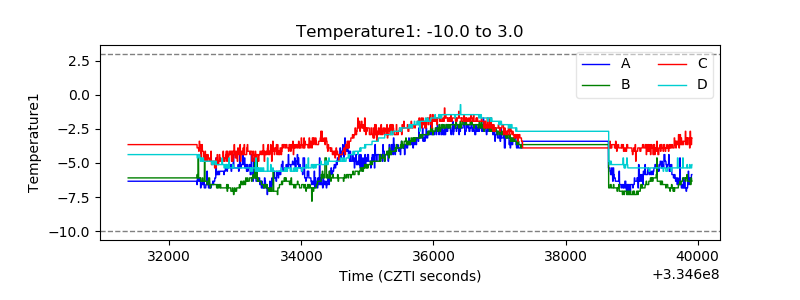 |
| Veto HV Monitor |  |
| Veto LLD | 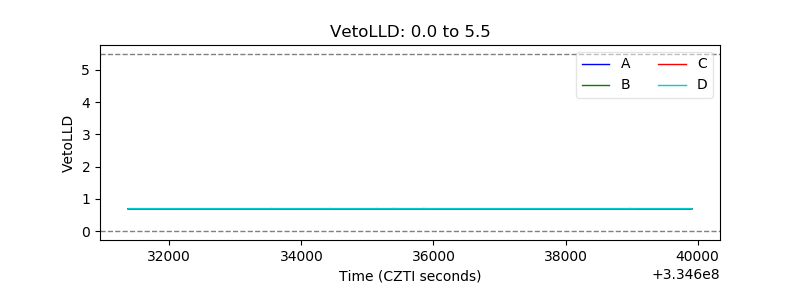 |
| Alpha Counter | 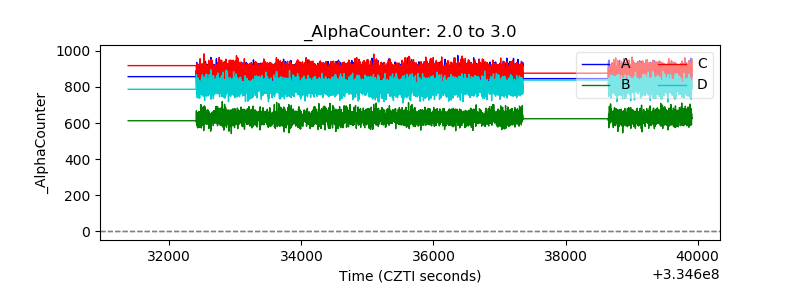 |
| _CPM_Rate | 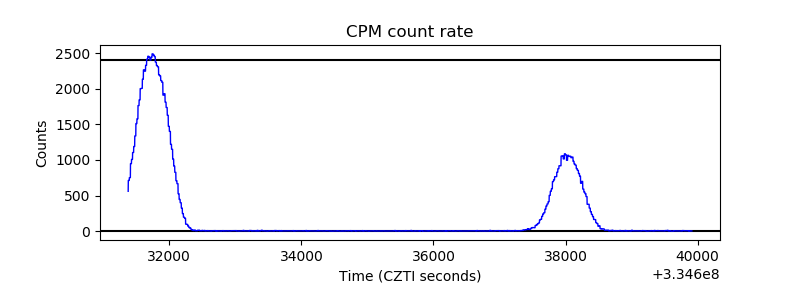 |
| CZT Counter | 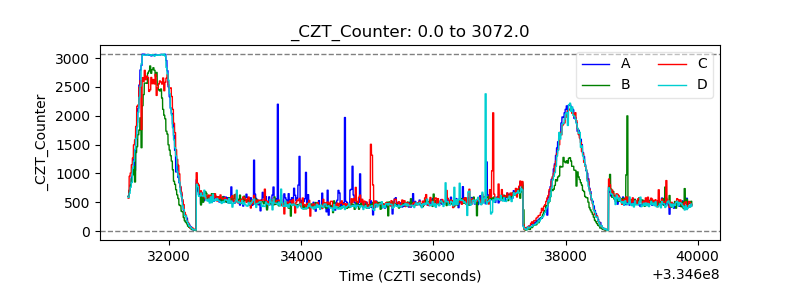 |
| +2.5 Volts monitor |  |
| +5 Volts monitor |  |
| _ROLL_ROT | 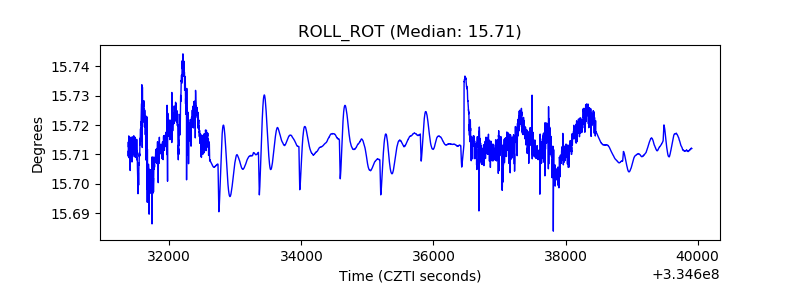 |
| _Roll_DEC |  |
| _Roll_RA | 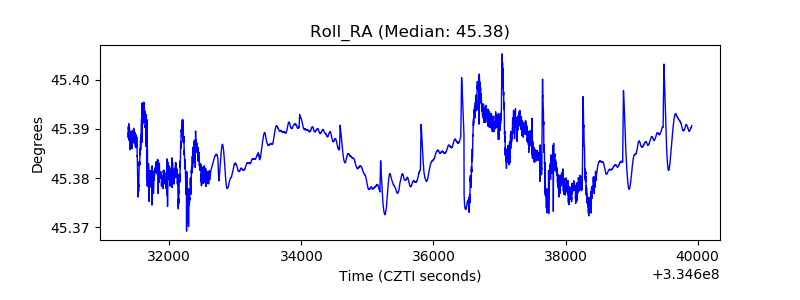 |
| Veto Counter |  |