| Param | Original file | Final file |
|---|---|---|
| Filename | modeM0/AS1A09_143T03_9000003794_26303cztM0_level2.evt | modeM0/AS1A09_143T03_9000003794_26303cztM0_level2_quad_clean.evt |
| Size (bytes) | 446,201,280 | 93,306,240 |
| Size | 425.5 MB | 89.0 MB |
| Events in quadrant A | 3,315,234 | 591,306 |
| Events in quadrant B | 3,271,432 | 613,679 |
| Events in quadrant C | 3,320,482 | 585,238 |
| Events in quadrant D | 3,158,674 | 576,633 |
| Mode M0 | |||
|---|---|---|---|
| Quadrant | BADHDUFLAG | Total packets | Discarded packets |
| A | 0 | 13931 | 0 |
| B | 0 | 13747 | 0 |
| C | 0 | 13787 | 0 |
| D | 0 | 13670 | 0 |
| Mode M9 | |||
|---|---|---|---|
| Quadrant | BADHDUFLAG | Total packets | Discarded packets |
| A | 0 | 14 | 0 |
| B | 0 | 15 | 0 |
| C | 0 | 15 | 0 |
| D | 0 | 15 | 0 |
| Quadrant | Total seconds | Saturated seconds | Saturation percentage |
|---|---|---|---|
| A | 6578 | 38 | 0.577683% |
| B | 6578 | 53 | 0.805716% |
| C | 6578 | 68 | 1.033749% |
| D | 6578 | 17 | 0.258437% |
Noise dominated data is calculated using 1-second bins in cleaned event files. If a bin has >2000 counts, and if more than 50% of those come from <1% of pixels, then it is considered to be noise-dominated and hence unusable.
| Quadrant | # 1 sec bins | Bins with >0 counts | Bins with >2000 counts | High rate bins dominated by noise | Noise dominated (total time) | Noise dominated (detector-on time) | Marked lightcurve |
|---|---|---|---|---|---|---|---|
| A | 7573 | 6579 | 5 | 5 | 0.07% | 0.08% | 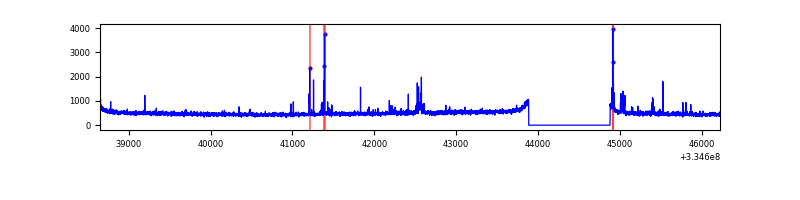 |
| B | 7573 | 6579 | 2 | 2 | 0.03% | 0.03% | 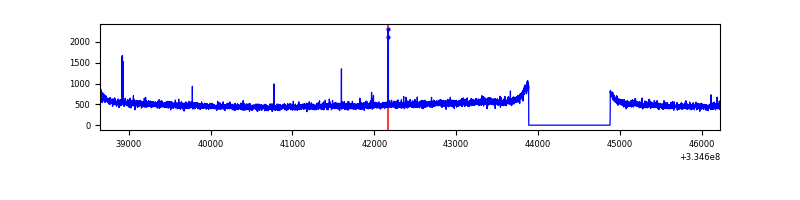 |
| C | 7573 | 6579 | 0 | 0 | 0.00% | 0.00% | 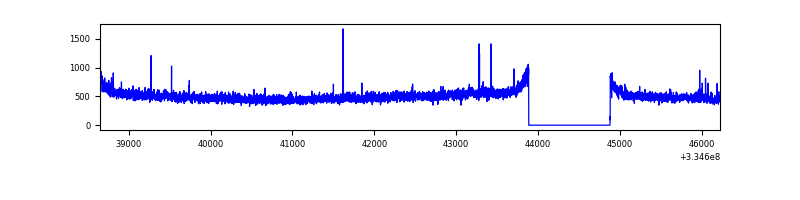 |
| D | 7573 | 6579 | 9 | 9 | 0.12% | 0.14% | 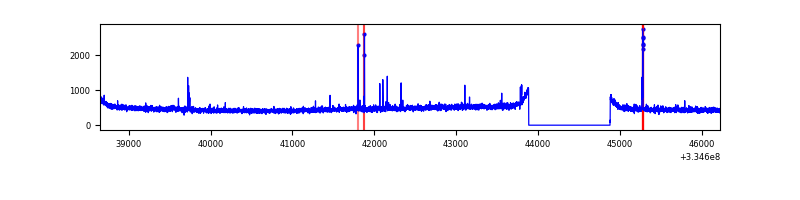 |
Top three noisy pixels from each quadrant. If the there are fewer than three noisy pixels in the level2.evt file, extra rows are filled as -1
| Pixel properties | Quadrant properties | ||||||
|---|---|---|---|---|---|---|---|
| Quadrant | DetID | PixID | Counts | Sigma | Mean | Median | Sigma |
| A | 0 | 13 | 118356 | 705.45 | 828 | 812 | 166.6 |
| A | 13 | 254 | 10336 | 57.16 | 828 | 812 | 166.6 |
| A | 3 | 137 | 7492 | 40.09 | 828 | 812 | 166.6 |
| B | 12 | 111 | 19316 | 115.94 | 831 | 812 | 159.6 |
| B | 11 | 111 | 17003 | 101.45 | 831 | 812 | 159.6 |
| B | 14 | 111 | 15749 | 93.59 | 831 | 812 | 159.6 |
| C | 14 | 238 | 126653 | 665.11 | 808 | 816 | 189.2 |
| C | 3 | 233 | 25427 | 130.08 | 808 | 816 | 189.2 |
| C | 2 | 16 | 23950 | 122.27 | 808 | 816 | 189.2 |
| D | 11 | 176 | 44688 | 223.97 | 814 | 795 | 196.0 |
| D | 2 | 234 | 25155 | 124.3 | 814 | 795 | 196.0 |
| D | 8 | 195 | 23432 | 115.51 | 814 | 795 | 196.0 |
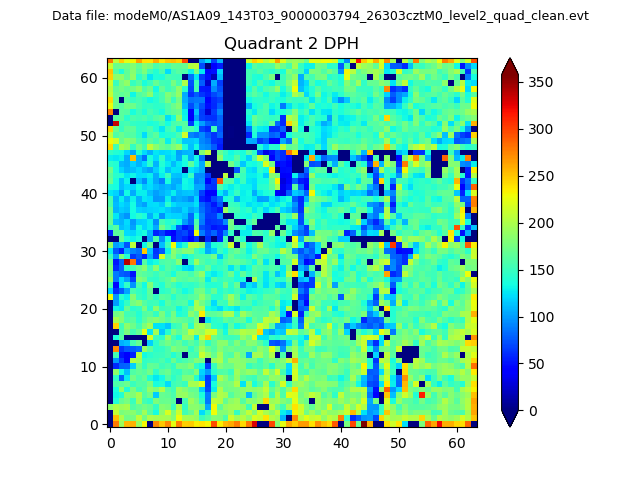
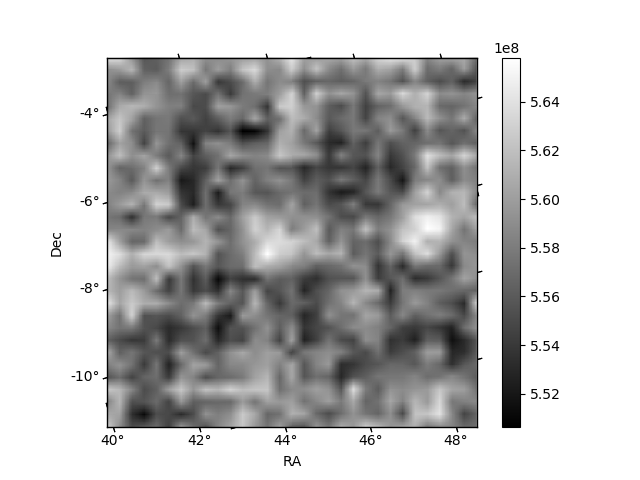
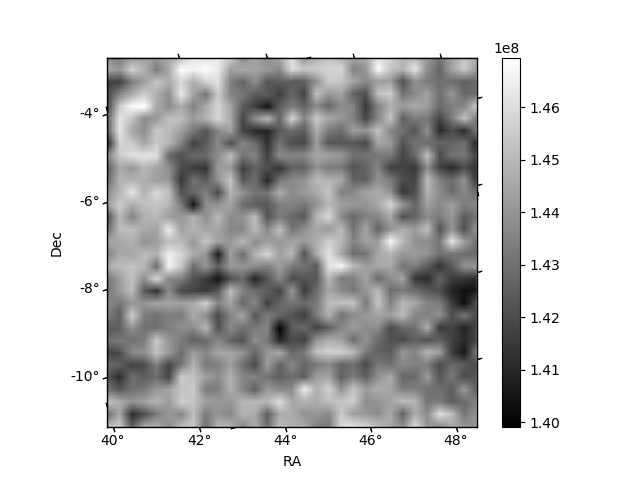
Histogram calculated using DETX and DETY for each event in the final _common_clean file
| Quadrant A | 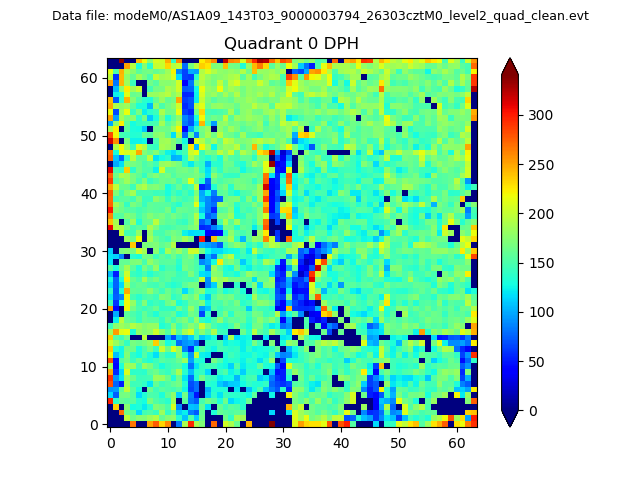 |
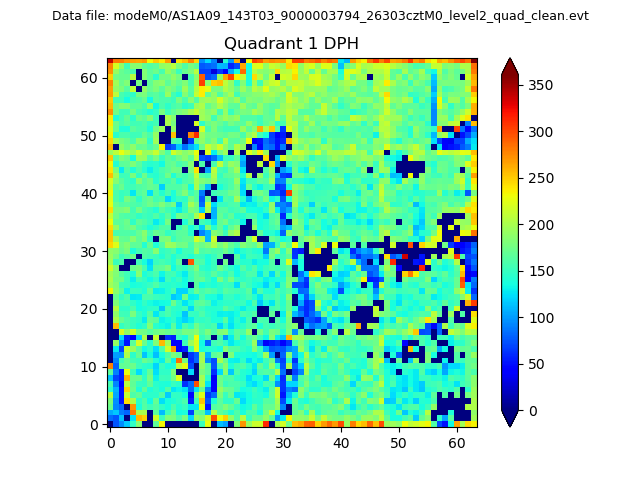 |
Quadrant B |
|---|---|---|---|
| Quadrant D | 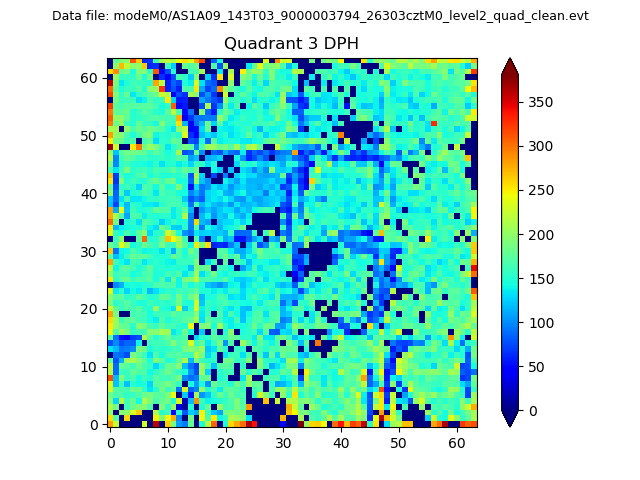 |
 |
Quadrant C |
| Plot type | Count rate plots | Images |
|---|---|---|
| Comparison with Poisson distribution Blue bars denote a histogram of data divided into 1 sec bins. Red curve is a Poisson curve with rate = median count rate of data. |
 |
 |
| Quadrant-wise count rates Data is divided into 100 sec bins |
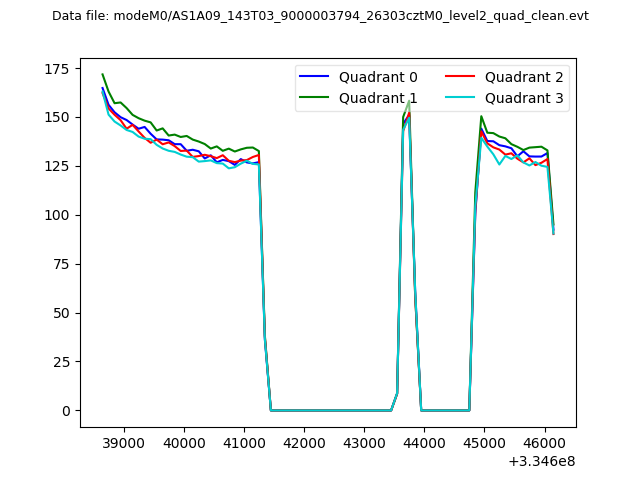 |
|
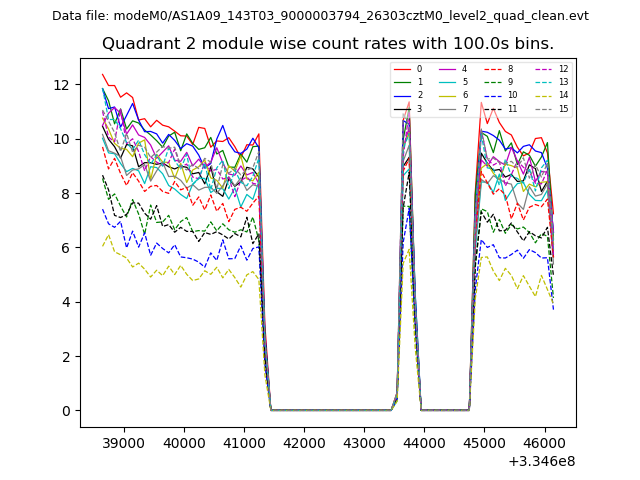
| Module-wise count rates for Quadrant A Data is divided into 100 sec bins |
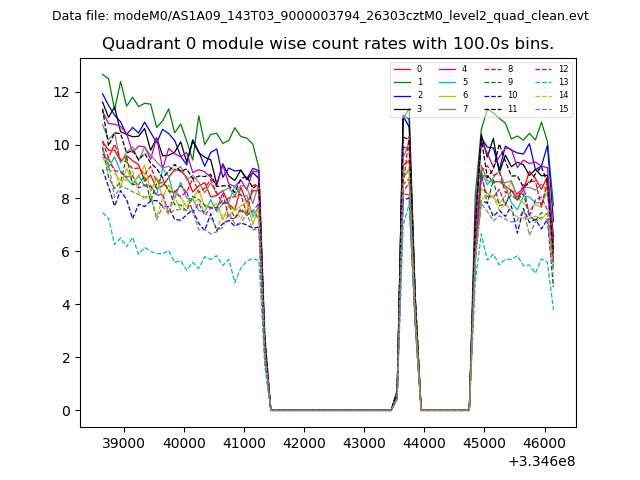 |
 |
| Module-wise count rates for Quadrant B Data is divided into 100 sec bins |
 |
 |
| Module-wise count rates for Quadrant C Data is divided into 100 sec bins |
 |
 |
| Module-wise count rates for Quadrant D Data is divided into 100 sec bins |
 |
 |
| Parameter | Plot |
|---|---|
| CZT HV Monitor | 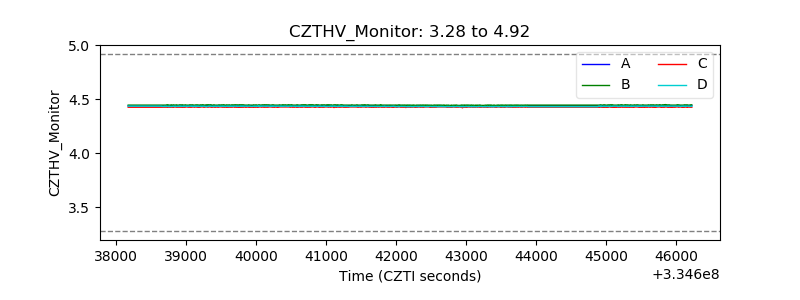 |
| D_VDD | 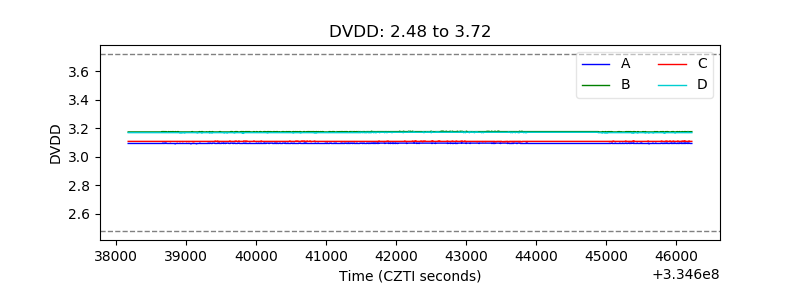 |
| Temperature 1 | 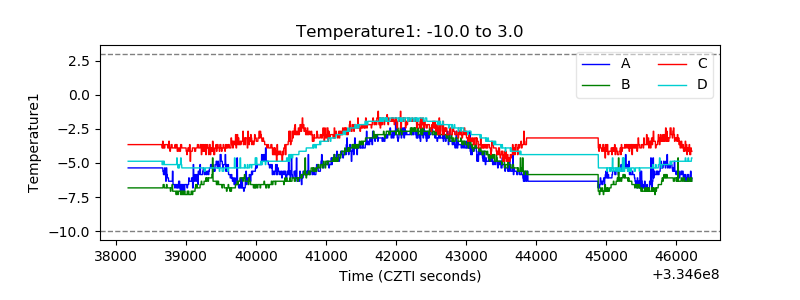 |
| Veto HV Monitor | 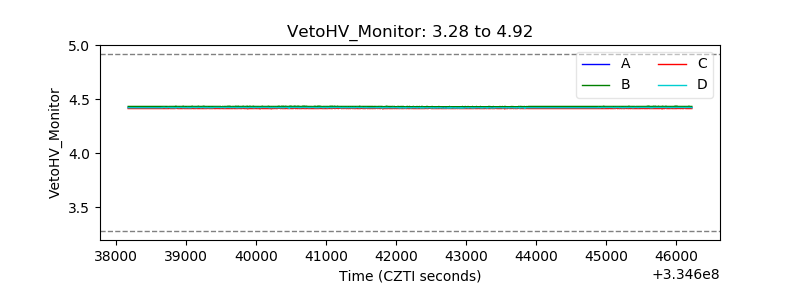 |
| Veto LLD | 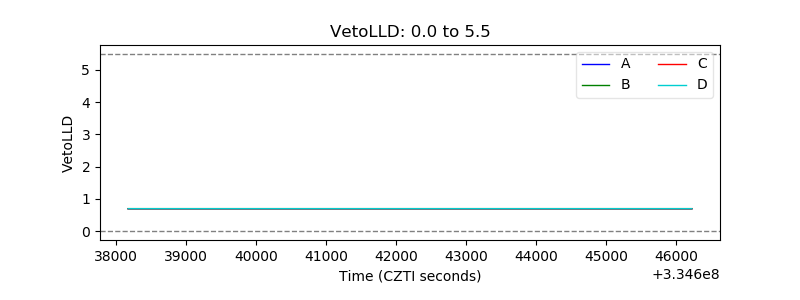 |
| Alpha Counter | 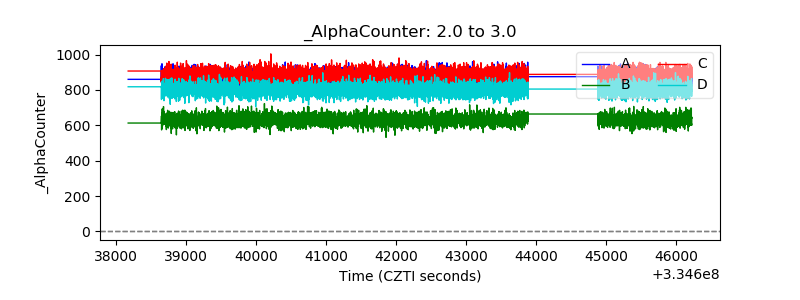 |
| _CPM_Rate | 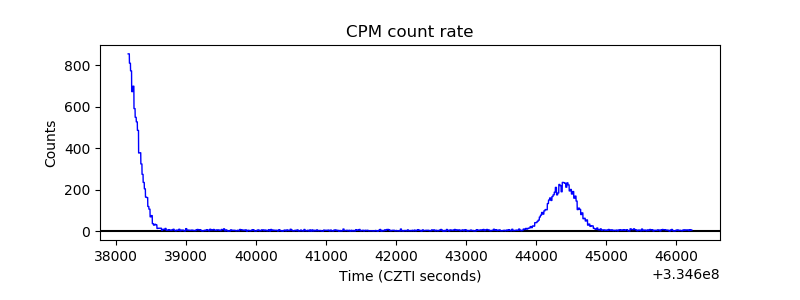 |
| CZT Counter | 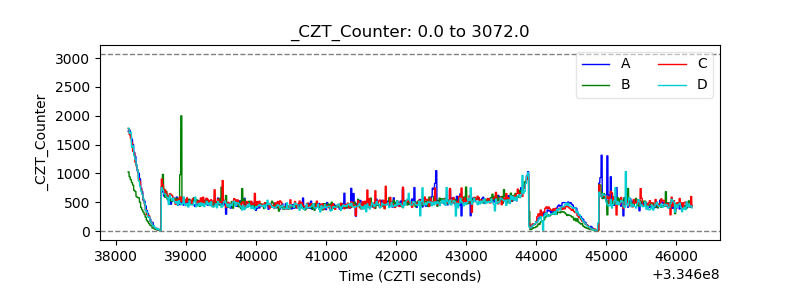 |
| +2.5 Volts monitor |  |
| +5 Volts monitor |  |
| _ROLL_ROT | 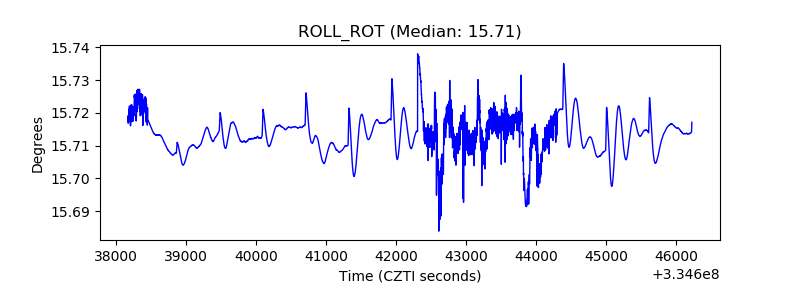 |
| _Roll_DEC | 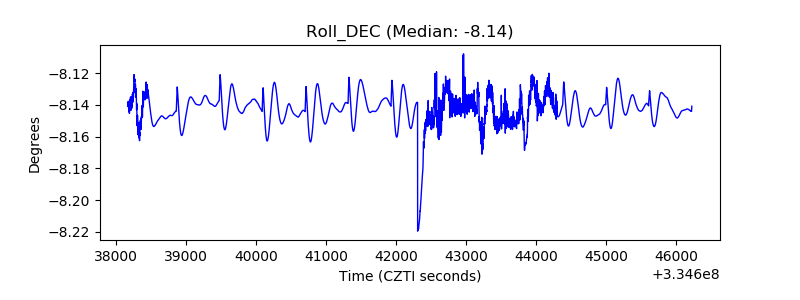 |
| _Roll_RA | 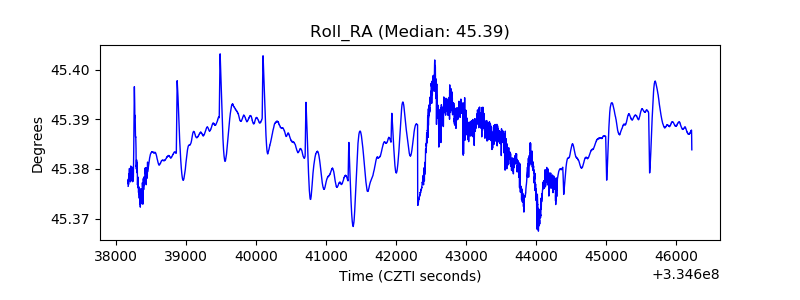 |
| Veto Counter | 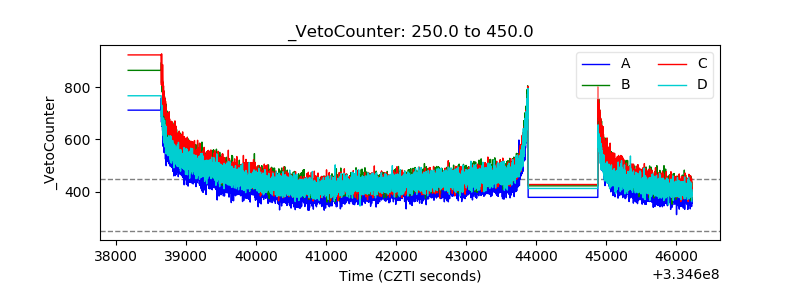 |