| Param | Original file | Final file |
|---|---|---|
| Filename | modeM0/AS1A09_143T03_9000003794_26305cztM0_level2.evt | modeM0/AS1A09_143T03_9000003794_26305cztM0_level2_quad_clean.evt |
| Size (bytes) | 437,909,760 | 82,229,760 |
| Size | 417.6 MB | 78.4 MB |
| Events in quadrant A | 3,127,247 | 502,497 |
| Events in quadrant B | 3,147,649 | 520,086 |
| Events in quadrant C | 3,359,365 | 496,728 |
| Events in quadrant D | 3,160,453 | 491,874 |
| Mode M0 | |||
|---|---|---|---|
| Quadrant | BADHDUFLAG | Total packets | Discarded packets |
| A | 0 | 13852 | 0 |
| B | 0 | 13837 | 0 |
| C | 0 | 14427 | 0 |
| D | 0 | 14185 | 0 |
| Quadrant | Total seconds | Saturated seconds | Saturation percentage |
|---|---|---|---|
| A | 6875 | 6 | 0.087273% |
| B | 6876 | 4 | 0.058173% |
| C | 6877 | 100 | 1.454122% |
| D | 6877 | 19 | 0.276283% |
Noise dominated data is calculated using 1-second bins in cleaned event files. If a bin has >2000 counts, and if more than 50% of those come from <1% of pixels, then it is considered to be noise-dominated and hence unusable.
| Quadrant | # 1 sec bins | Bins with >0 counts | Bins with >2000 counts | High rate bins dominated by noise | Noise dominated (total time) | Noise dominated (detector-on time) | Marked lightcurve |
|---|---|---|---|---|---|---|---|
| A | 10422 | 6876 | 0 | 0 | 0.00% | 0.00% | 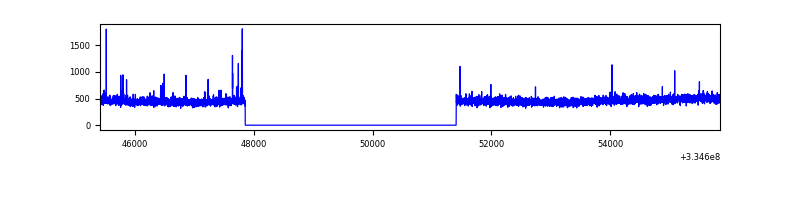 |
| B | 10422 | 6877 | 0 | 0 | 0.00% | 0.00% | 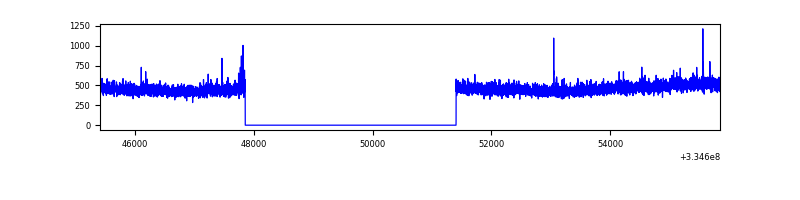 |
| C | 10423 | 6878 | 59 | 59 | 0.57% | 0.86% | 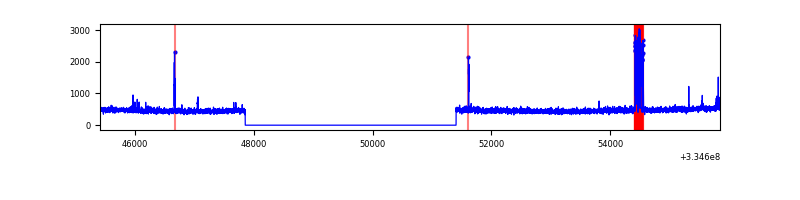 |
| D | 10423 | 6878 | 13 | 13 | 0.12% | 0.19% | 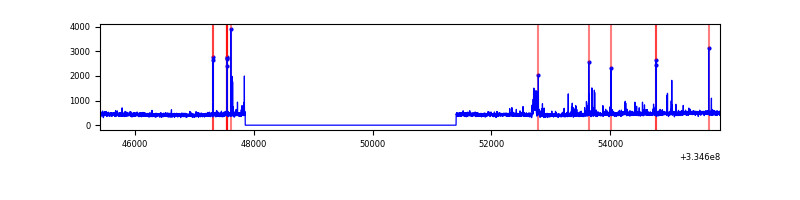 |
Top three noisy pixels from each quadrant. If the there are fewer than three noisy pixels in the level2.evt file, extra rows are filled as -1
| Pixel properties | Quadrant properties | ||||||
|---|---|---|---|---|---|---|---|
| Quadrant | DetID | PixID | Counts | Sigma | Mean | Median | Sigma |
| A | 0 | 13 | 33845 | 203.53 | 802 | 787 | 162.4 |
| A | 13 | 254 | 10299 | 58.56 | 802 | 787 | 162.4 |
| A | 3 | 137 | 7323 | 40.24 | 802 | 787 | 162.4 |
| B | 12 | 111 | 18512 | 116.75 | 797 | 778 | 151.9 |
| B | 0 | 230 | 17511 | 110.16 | 797 | 778 | 151.9 |
| B | 11 | 111 | 16887 | 106.05 | 797 | 778 | 151.9 |
| C | 2 | 16 | 194630 | 1067.72 | 770 | 775 | 181.6 |
| C | 14 | 238 | 122961 | 672.98 | 770 | 775 | 181.6 |
| C | 3 | 233 | 41459 | 224.08 | 770 | 775 | 181.6 |
| D | 11 | 176 | 75893 | 401.19 | 785 | 768 | 187.3 |
| D | 1 | 52 | 72972 | 385.59 | 785 | 768 | 187.3 |
| D | 8 | 195 | 32257 | 168.16 | 785 | 768 | 187.3 |
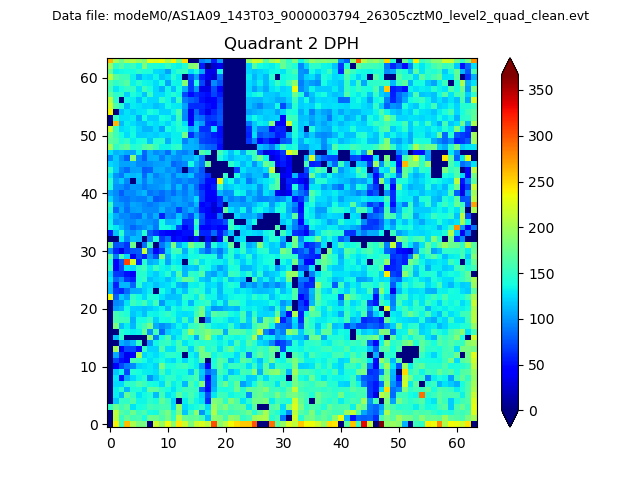
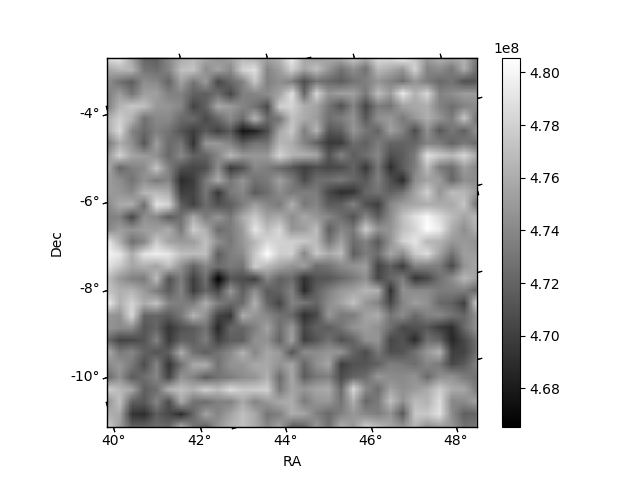
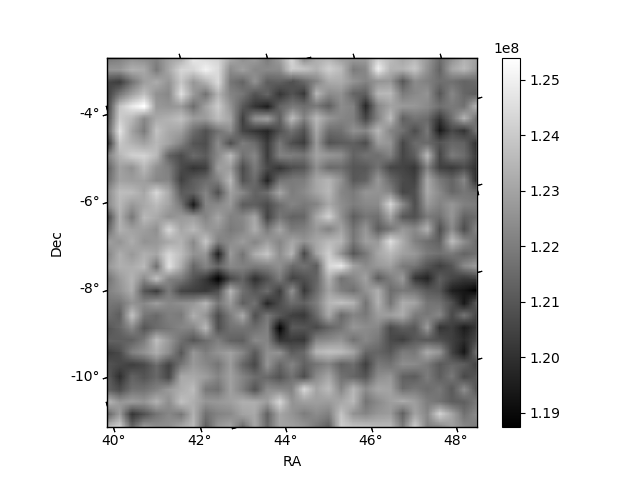
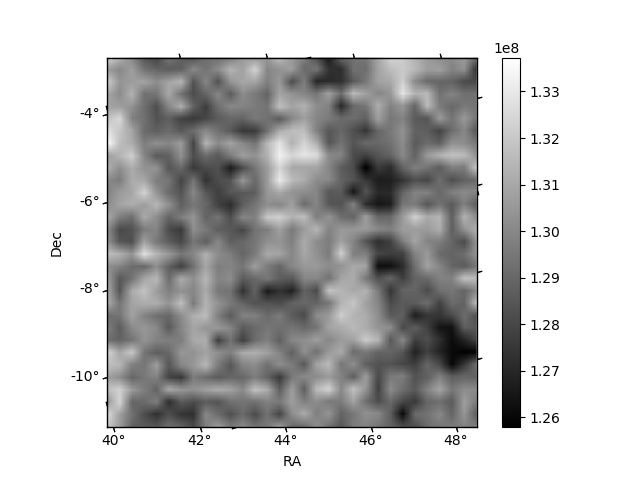
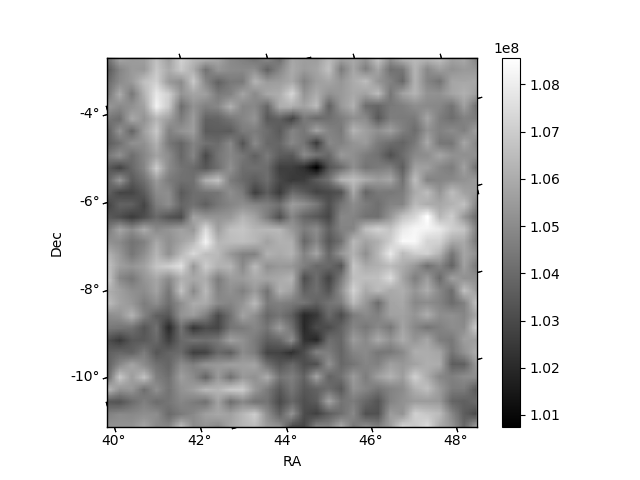
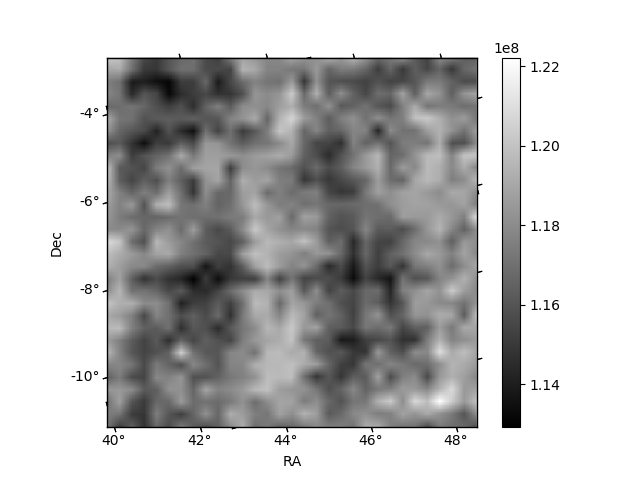
Histogram calculated using DETX and DETY for each event in the final _common_clean file
| Quadrant A | 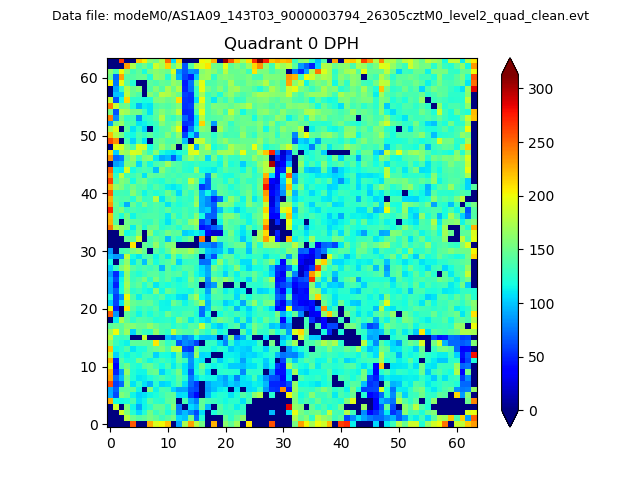 |
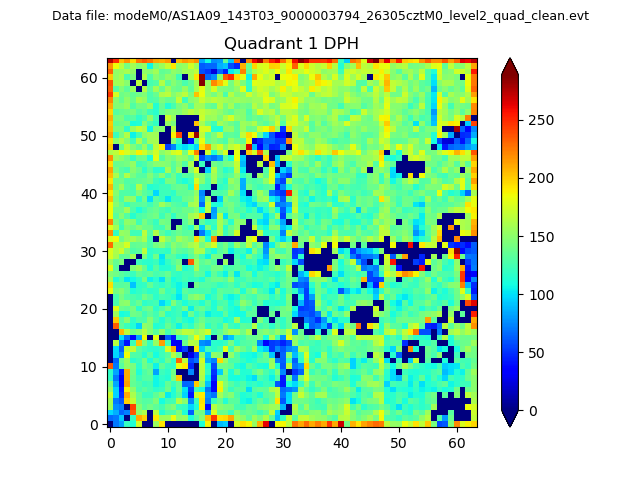 |
Quadrant B |
|---|---|---|---|
| Quadrant D | 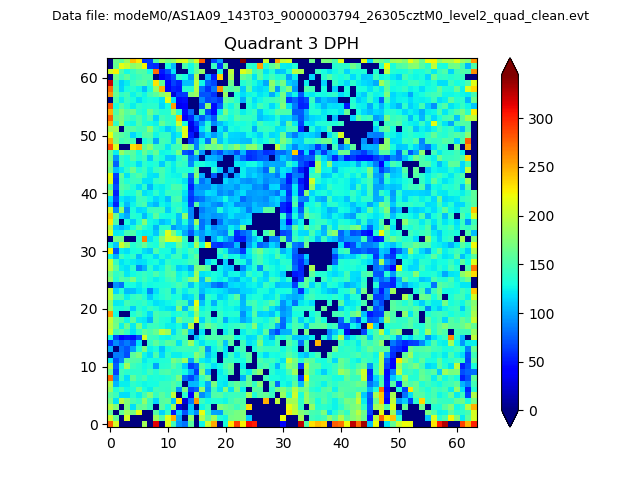 |
 |
Quadrant C |
| Plot type | Count rate plots | Images |
|---|---|---|
| Comparison with Poisson distribution Blue bars denote a histogram of data divided into 1 sec bins. Red curve is a Poisson curve with rate = median count rate of data. |
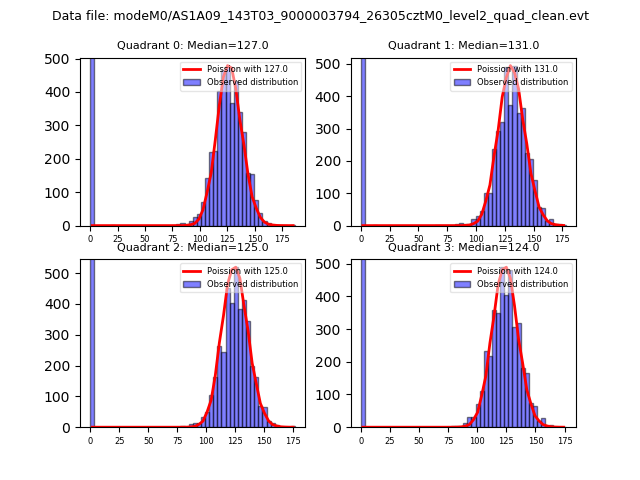 |
 |
| Quadrant-wise count rates Data is divided into 100 sec bins |
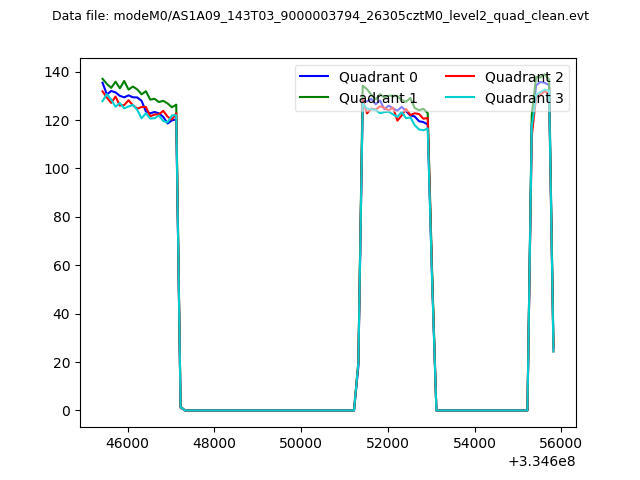 |
|
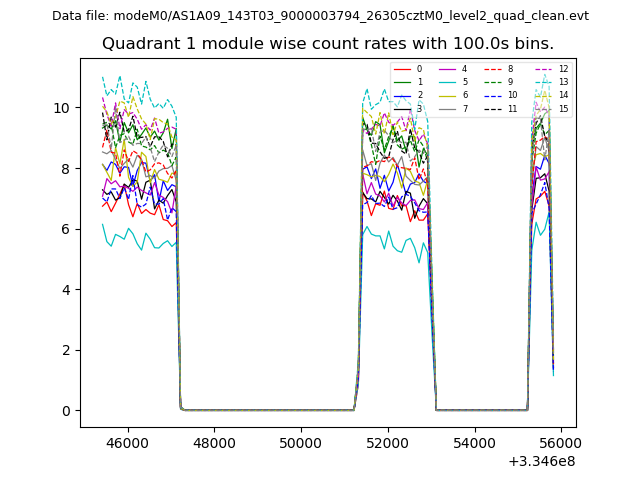
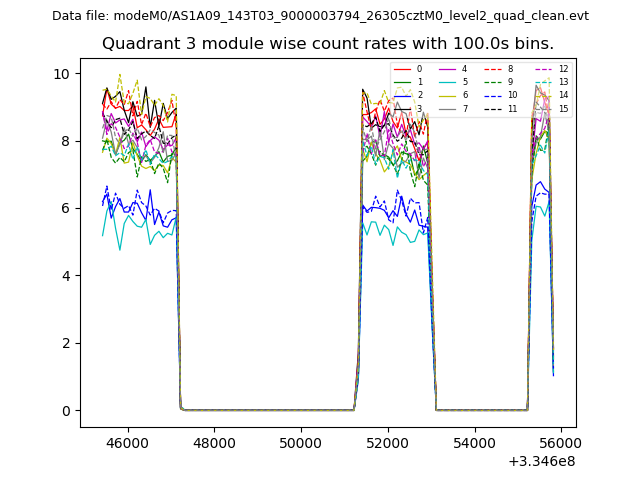
| Module-wise count rates for Quadrant A Data is divided into 100 sec bins |
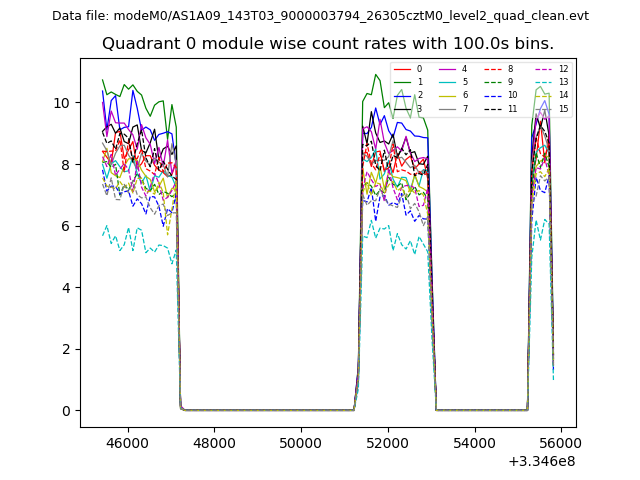 |
 |
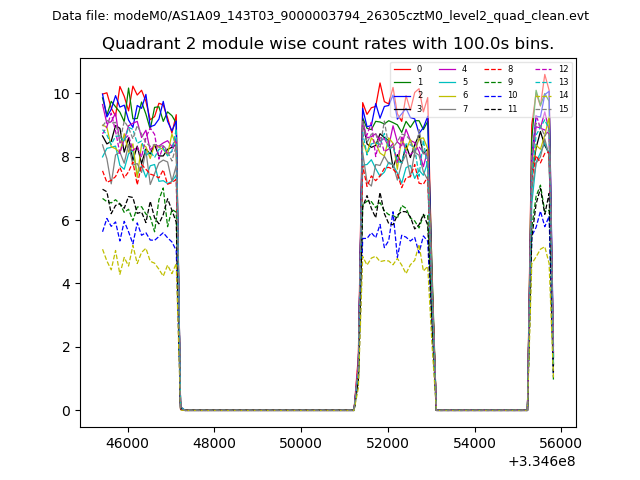
| Module-wise count rates for Quadrant B Data is divided into 100 sec bins |
 |
 |
| Module-wise count rates for Quadrant C Data is divided into 100 sec bins |
 |
 |
| Module-wise count rates for Quadrant D Data is divided into 100 sec bins |
 |
 |
| Parameter | Plot |
|---|---|
| CZT HV Monitor | 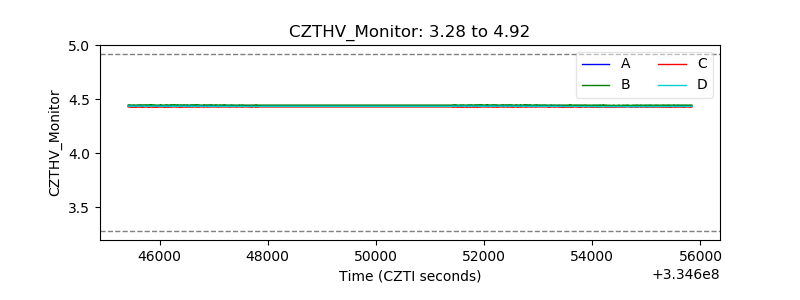 |
| D_VDD | 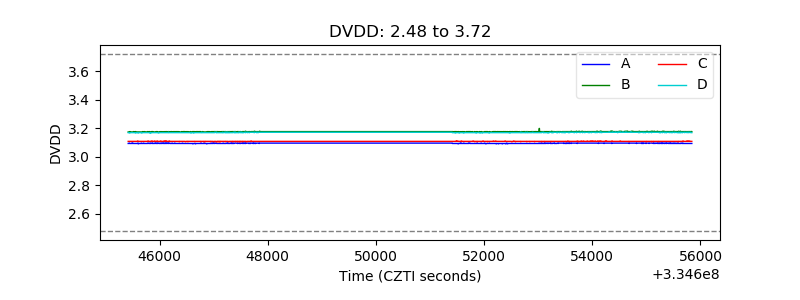 |
| Temperature 1 | 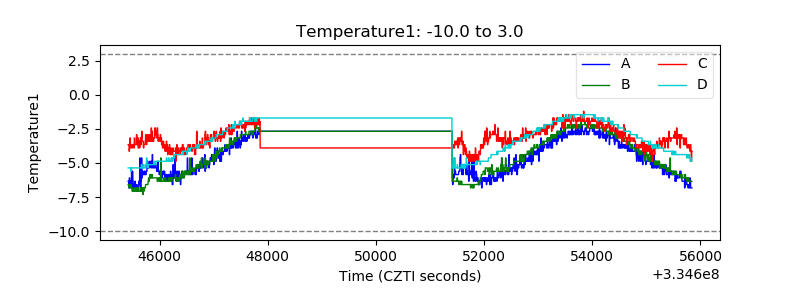 |
| Veto HV Monitor | 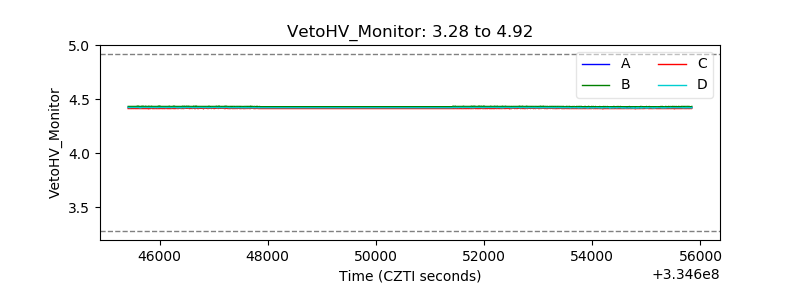 |
| Veto LLD | 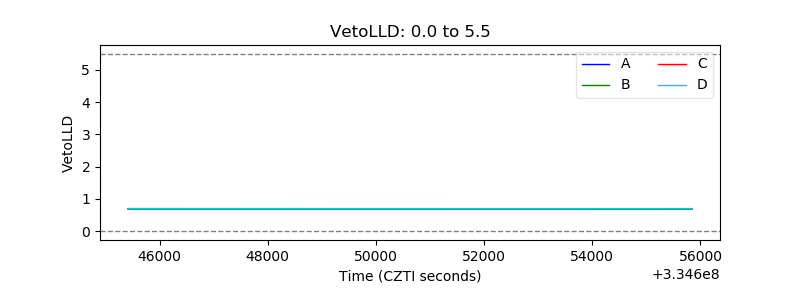 |
| Alpha Counter | 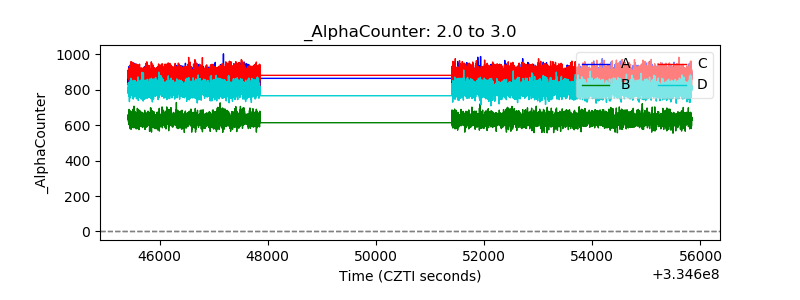 |
| _CPM_Rate | 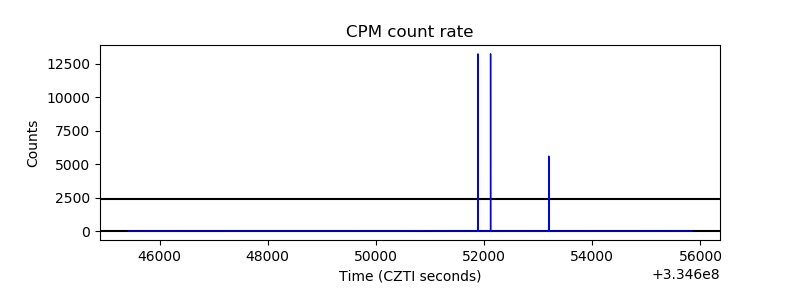 |
| CZT Counter | 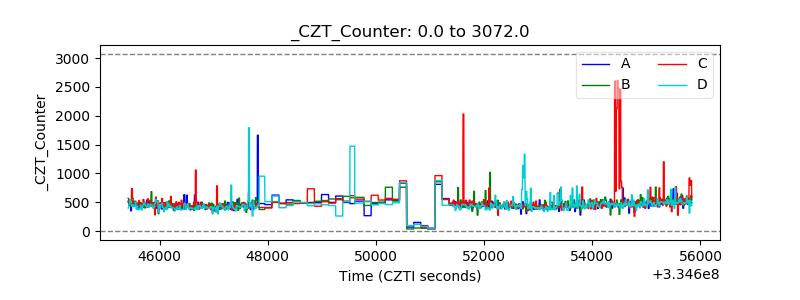 |
| +2.5 Volts monitor |  |
| +5 Volts monitor |  |
| _ROLL_ROT | 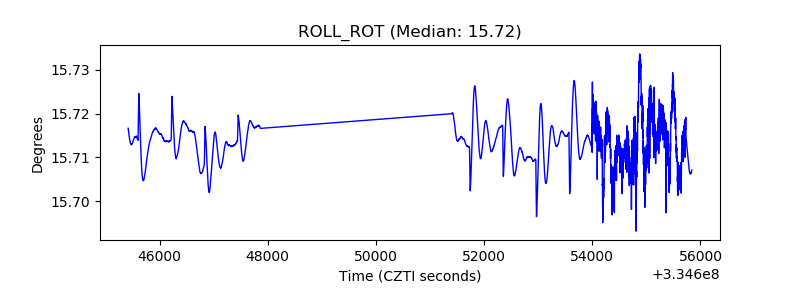 |
| _Roll_DEC | 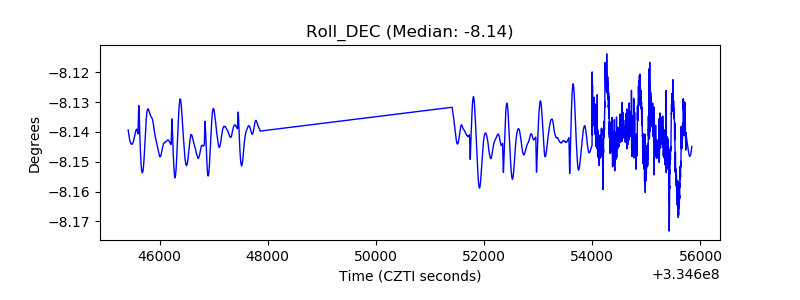 |
| _Roll_RA | 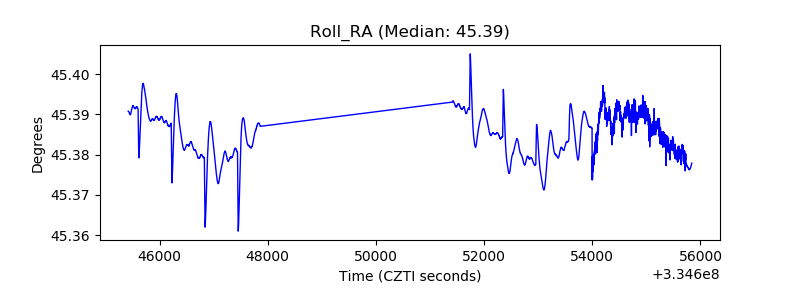 |
| Veto Counter | 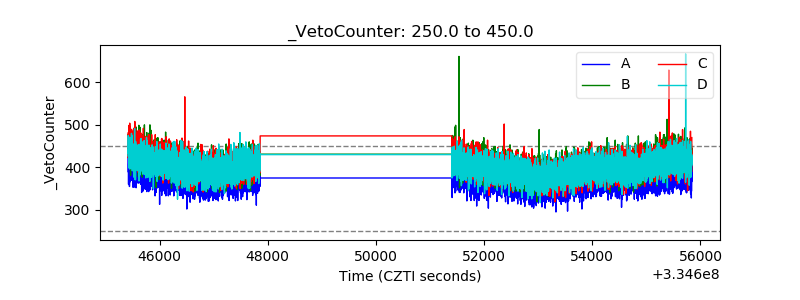 |