| Param | Original file | Final file |
|---|---|---|
| Filename | modeM0/AS1A09_143T03_9000003794_26306cztM0_level2.evt | modeM0/AS1A09_143T03_9000003794_26306cztM0_level2_quad_clean.evt |
| Size (bytes) | 133,496,640 | 35,377,920 |
| Size | 127.3 MB | 33.7 MB |
| Events in quadrant A | 973,486 | 227,888 |
| Events in quadrant B | 965,810 | 236,428 |
| Events in quadrant C | 1,004,891 | 224,898 |
| Events in quadrant D | 946,860 | 223,088 |
| Mode M0 | |||
|---|---|---|---|
| Quadrant | BADHDUFLAG | Total packets | Discarded packets |
| A | 0 | 4416 | 0 |
| B | 0 | 4389 | 0 |
| C | 0 | 4448 | 0 |
| D | 0 | 4443 | 0 |
| Quadrant | Total seconds | Saturated seconds | Saturation percentage |
|---|---|---|---|
| A | 2192 | 1 | 0.045620% |
| B | 2191 | 0 | 0.000000% |
| C | 2192 | 5 | 0.228102% |
| D | 2192 | 8 | 0.364964% |
Noise dominated data is calculated using 1-second bins in cleaned event files. If a bin has >2000 counts, and if more than 50% of those come from <1% of pixels, then it is considered to be noise-dominated and hence unusable.
| Quadrant | # 1 sec bins | Bins with >0 counts | Bins with >2000 counts | High rate bins dominated by noise | Noise dominated (total time) | Noise dominated (detector-on time) | Marked lightcurve |
|---|---|---|---|---|---|---|---|
| A | 2192 | 2192 | 0 | 0 | 0.00% | 0.00% | 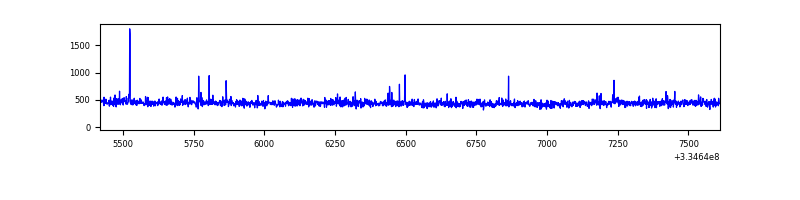 |
| B | 2191 | 2191 | 0 | 0 | 0.00% | 0.00% | 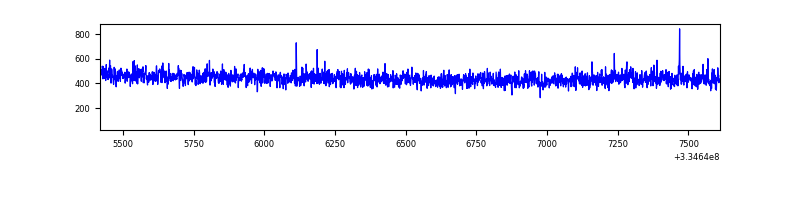 |
| C | 2192 | 2192 | 1 | 1 | 0.05% | 0.05% | 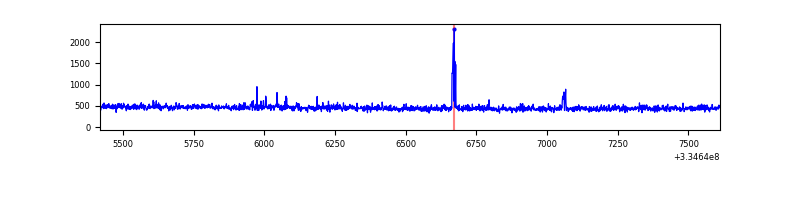 |
| D | 2192 | 2192 | 6 | 6 | 0.27% | 0.27% | 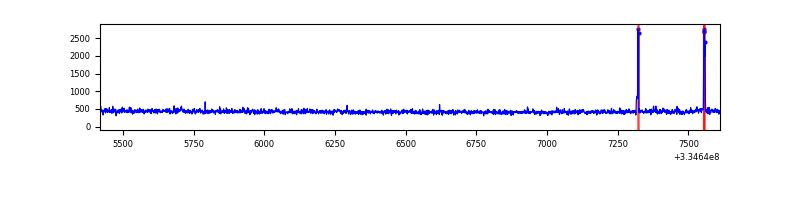 |
Top three noisy pixels from each quadrant. If the there are fewer than three noisy pixels in the level2.evt file, extra rows are filled as -1
| Pixel properties | Quadrant properties | ||||||
|---|---|---|---|---|---|---|---|
| Quadrant | DetID | PixID | Counts | Sigma | Mean | Median | Sigma |
| A | 0 | 13 | 16347 | 316.37 | 247 | 242 | 50.9 |
| A | 13 | 254 | 3373 | 61.51 | 247 | 242 | 50.9 |
| A | 3 | 137 | 2192 | 38.31 | 247 | 242 | 50.9 |
| B | 12 | 111 | 5622 | 110.95 | 246 | 241 | 48.5 |
| B | 11 | 111 | 5061 | 99.39 | 246 | 241 | 48.5 |
| B | 14 | 111 | 4722 | 92.4 | 246 | 241 | 48.5 |
| C | 14 | 238 | 37984 | 650.66 | 241 | 242 | 58.0 |
| C | 3 | 233 | 23905 | 407.94 | 241 | 242 | 58.0 |
| C | 2 | 16 | 4869 | 79.77 | 241 | 242 | 58.0 |
| D | 11 | 176 | 22972 | 382.16 | 243 | 237 | 59.5 |
| D | 2 | 234 | 7888 | 128.61 | 243 | 237 | 59.5 |
| D | 8 | 195 | 7767 | 126.57 | 243 | 237 | 59.5 |
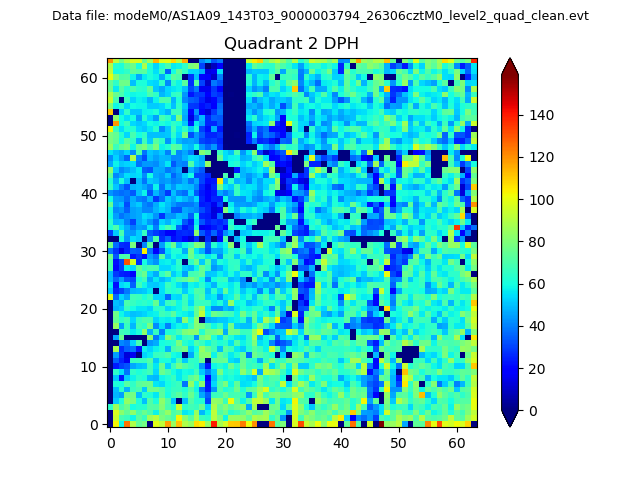
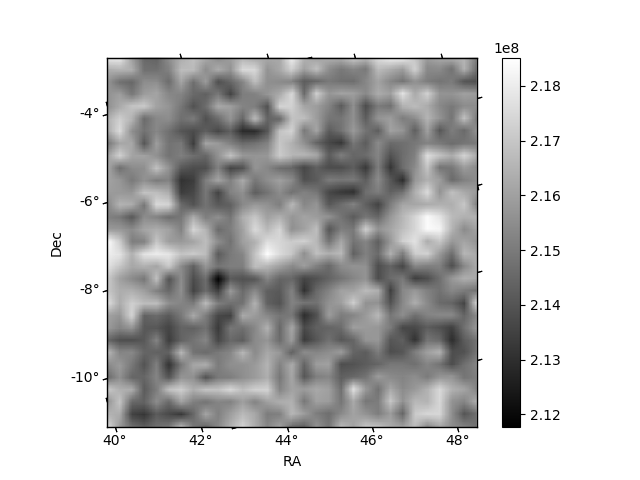
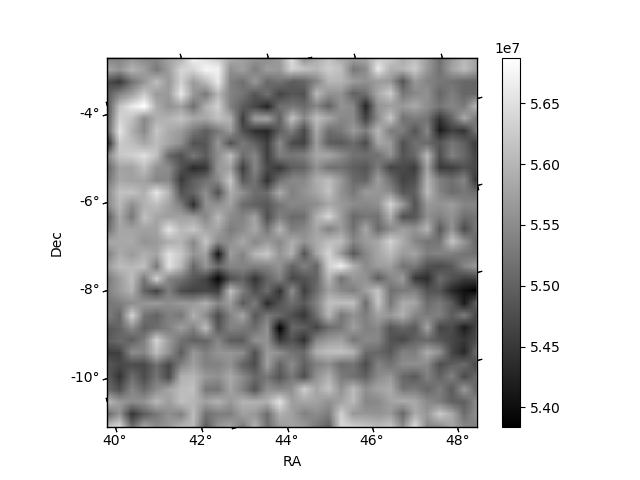
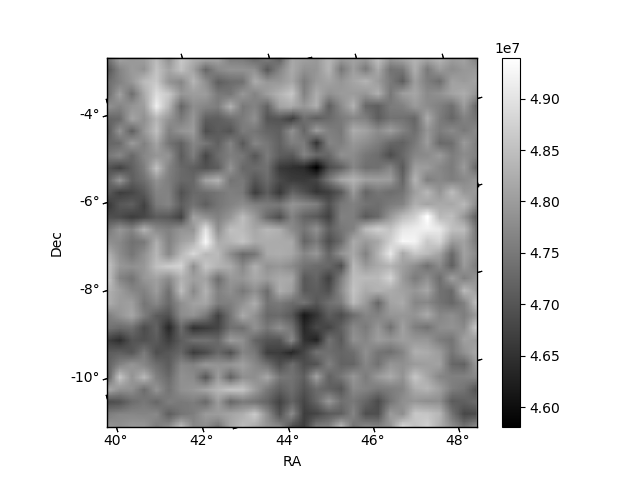
Histogram calculated using DETX and DETY for each event in the final _common_clean file
| Quadrant A | 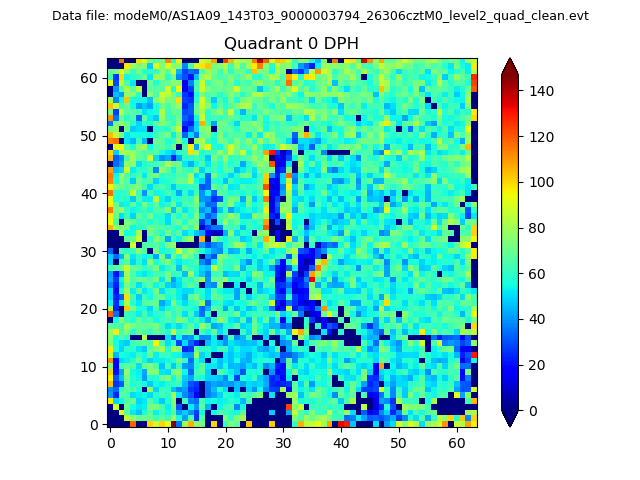 |
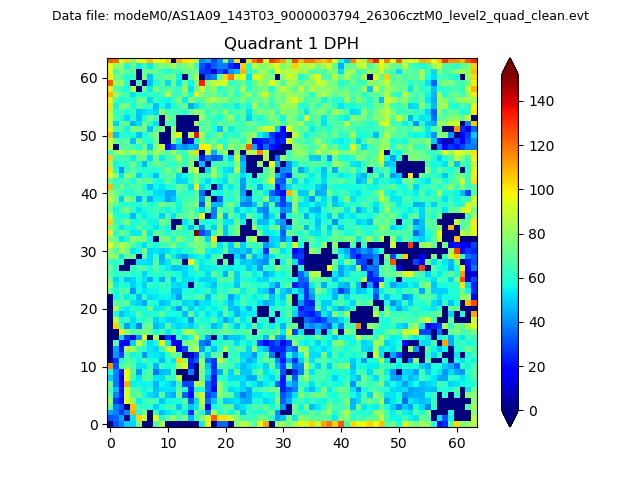 |
Quadrant B |
|---|---|---|---|
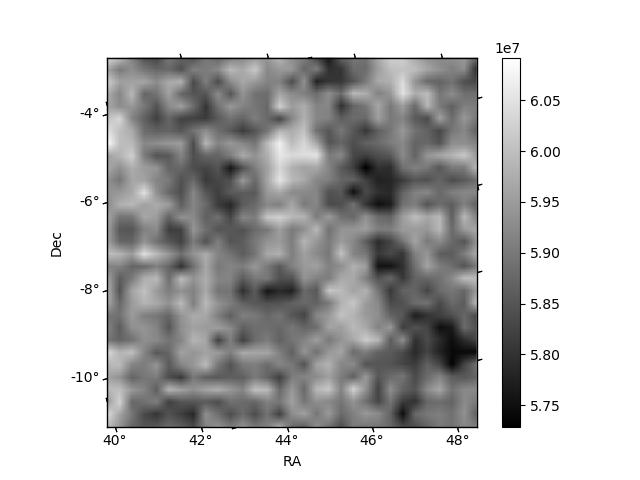
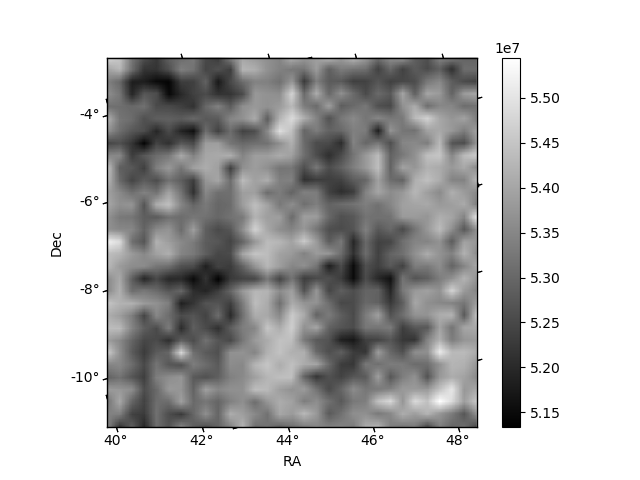
| Quadrant D | 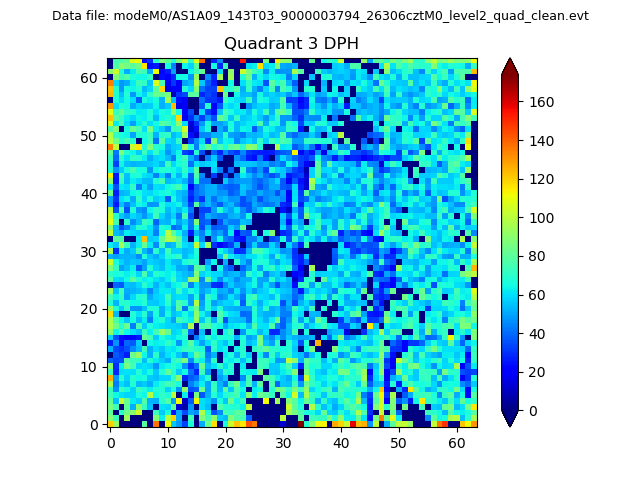 |
 |
Quadrant C |
| Plot type | Count rate plots | Images |
|---|---|---|
| Comparison with Poisson distribution Blue bars denote a histogram of data divided into 1 sec bins. Red curve is a Poisson curve with rate = median count rate of data. |
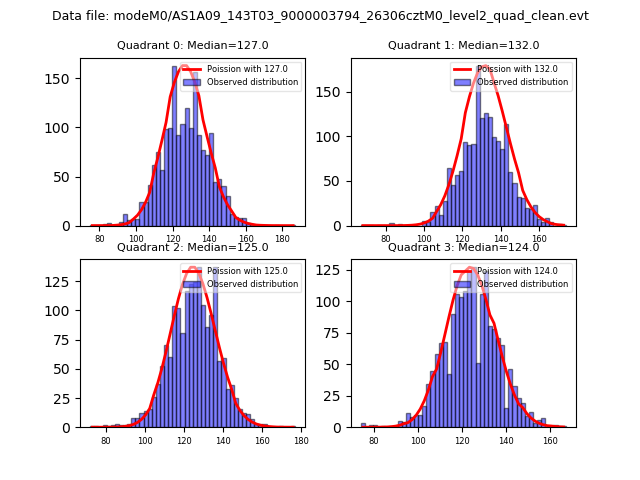 |
 |
| Quadrant-wise count rates Data is divided into 100 sec bins |
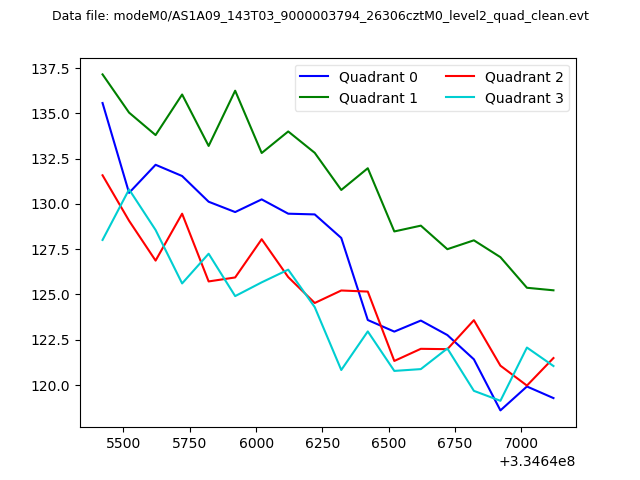 |
|
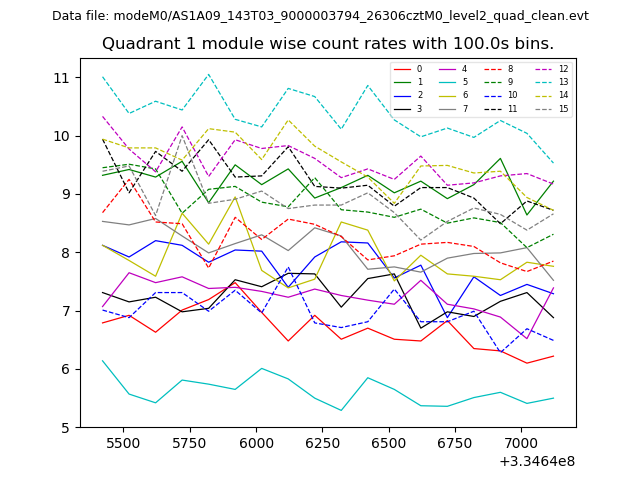
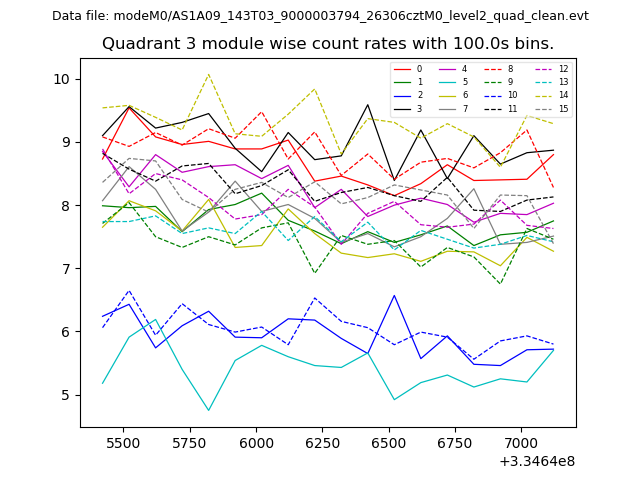
| Module-wise count rates for Quadrant A Data is divided into 100 sec bins |
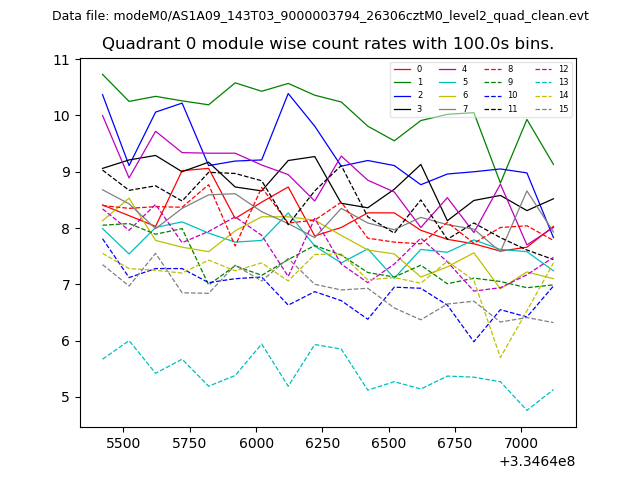 |
 |
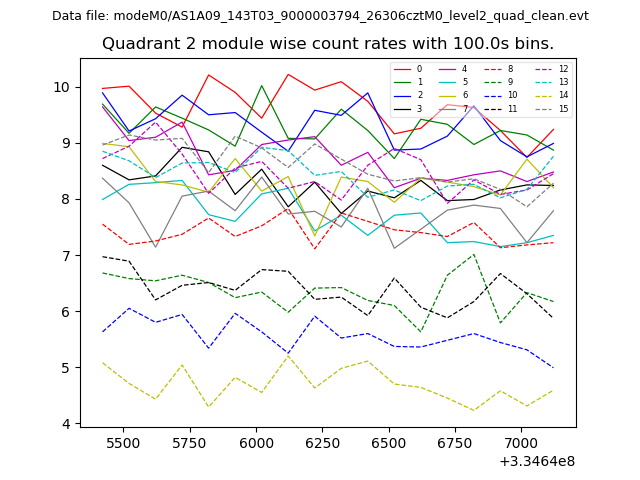
| Module-wise count rates for Quadrant B Data is divided into 100 sec bins |
 |
 |
| Module-wise count rates for Quadrant C Data is divided into 100 sec bins |
 |
 |
| Module-wise count rates for Quadrant D Data is divided into 100 sec bins |
 |
 |
| Parameter | Plot |
|---|---|
| CZT HV Monitor | 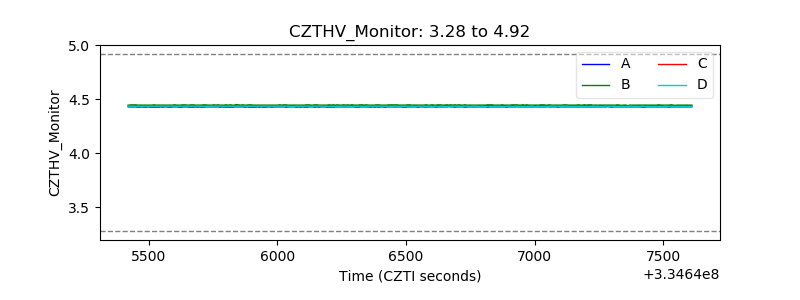 |
| D_VDD | 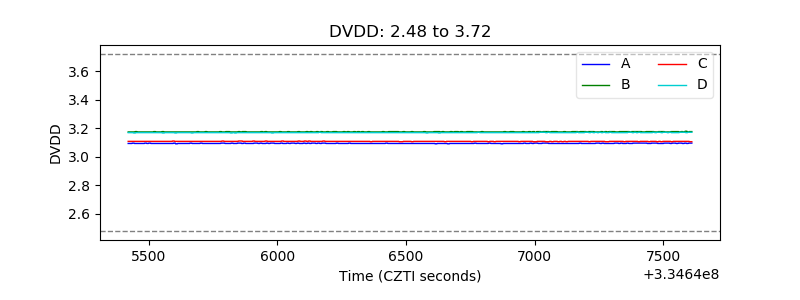 |
| Temperature 1 | 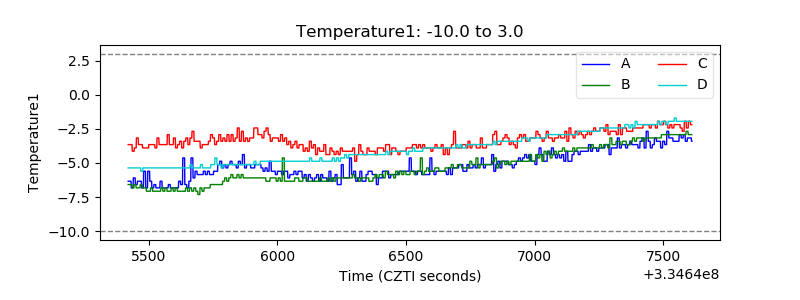 |
| Veto HV Monitor | 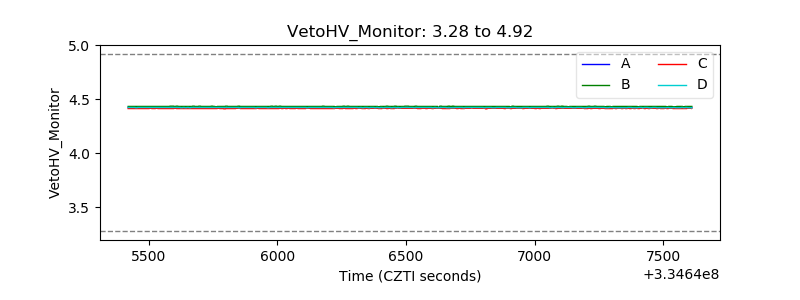 |
| Veto LLD | 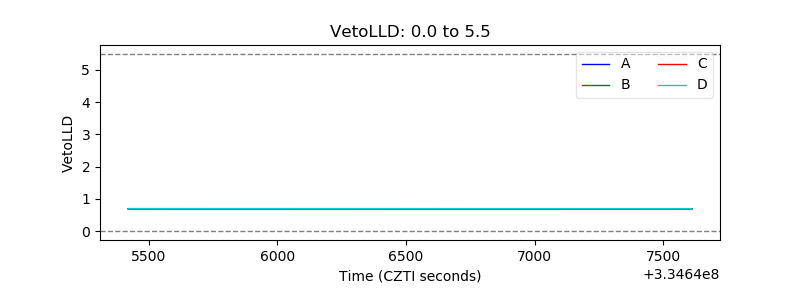 |
| Alpha Counter | 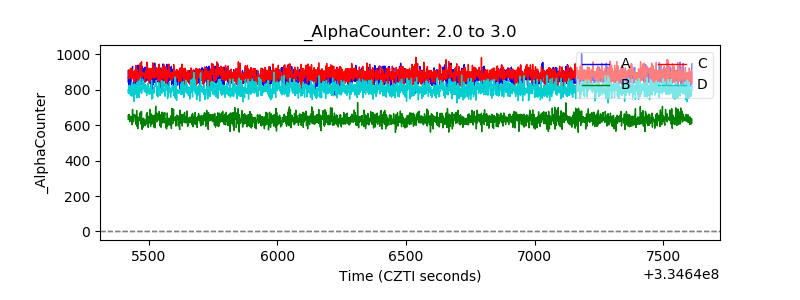 |
| _CPM_Rate | 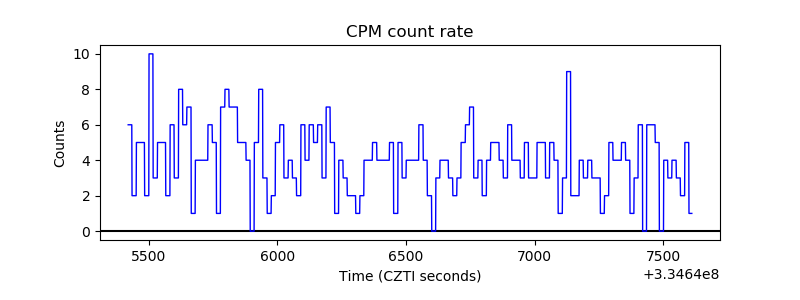 |
| CZT Counter | 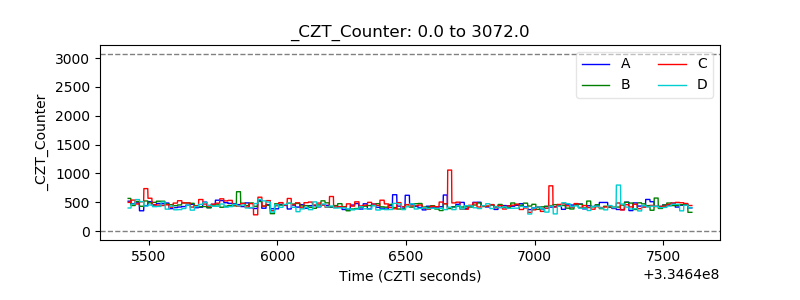 |
| +2.5 Volts monitor |  |
| +5 Volts monitor |  |
| _ROLL_ROT | 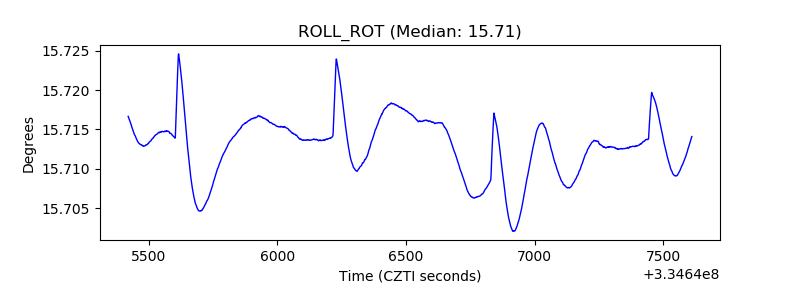 |
| _Roll_DEC | 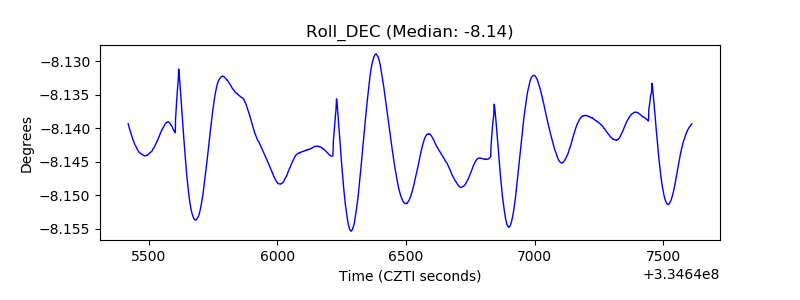 |
| _Roll_RA | 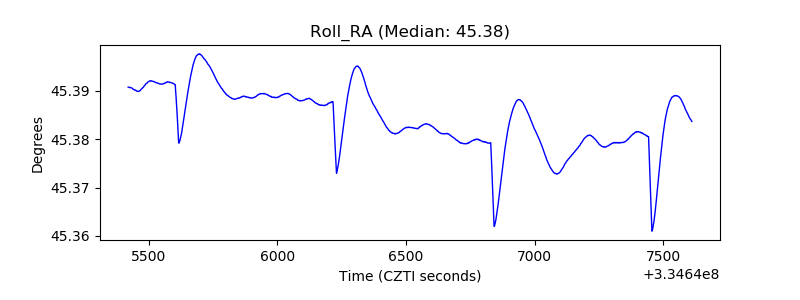 |
| Veto Counter | 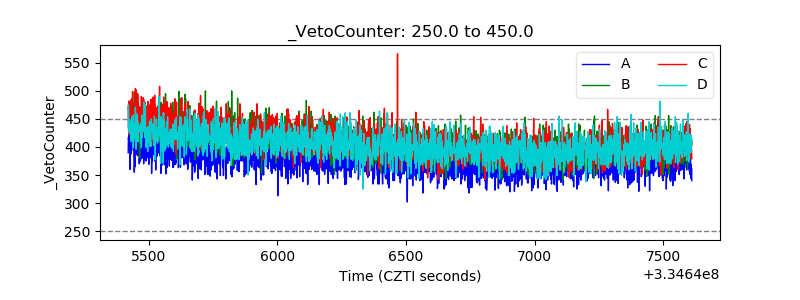 |