| Param | Original file | Final file |
|---|---|---|
| Filename | modeM0/AS1A09_143T03_9000003794_26310cztM0_level2.evt | modeM0/AS1A09_143T03_9000003794_26310cztM0_level2_quad_clean.evt |
| Size (bytes) | 651,317,760 | 113,388,480 |
| Size | 621.1 MB | 108.1 MB |
| Events in quadrant A | 4,668,026 | 688,958 |
| Events in quadrant B | 4,696,420 | 712,118 |
| Events in quadrant C | 4,916,745 | 678,649 |
| Events in quadrant D | 4,776,284 | 671,679 |
| Mode M0 | |||
|---|---|---|---|
| Quadrant | BADHDUFLAG | Total packets | Discarded packets |
| A | 0 | 20104 | 0 |
| B | 0 | 20122 | 0 |
| C | 0 | 20719 | 0 |
| D | 0 | 20763 | 0 |
| Mode M9 | |||
|---|---|---|---|
| Quadrant | BADHDUFLAG | Total packets | Discarded packets |
| A | 0 | 6 | 0 |
| B | 0 | 6 | 0 |
| C | 0 | 6 | 0 |
| D | 0 | 6 | 0 |
| Quadrant | Total seconds | Saturated seconds | Saturation percentage |
|---|---|---|---|
| A | 9847 | 63 | 0.639789% |
| B | 9847 | 76 | 0.771809% |
| C | 9848 | 176 | 1.787165% |
| D | 9848 | 78 | 0.792039% |
Noise dominated data is calculated using 1-second bins in cleaned event files. If a bin has >2000 counts, and if more than 50% of those come from <1% of pixels, then it is considered to be noise-dominated and hence unusable.
| Quadrant | # 1 sec bins | Bins with >0 counts | Bins with >2000 counts | High rate bins dominated by noise | Noise dominated (total time) | Noise dominated (detector-on time) | Marked lightcurve |
|---|---|---|---|---|---|---|---|
| A | 10422 | 9848 | 0 | 0 | 0.00% | 0.00% | 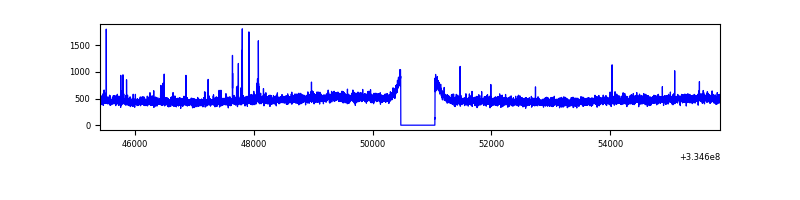 |
| B | 10422 | 9848 | 0 | 0 | 0.00% | 0.00% | 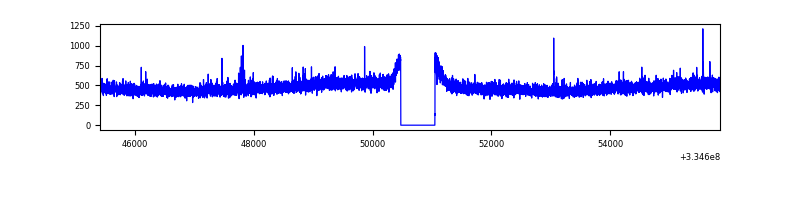 |
| C | 10423 | 9849 | 59 | 59 | 0.57% | 0.60% | 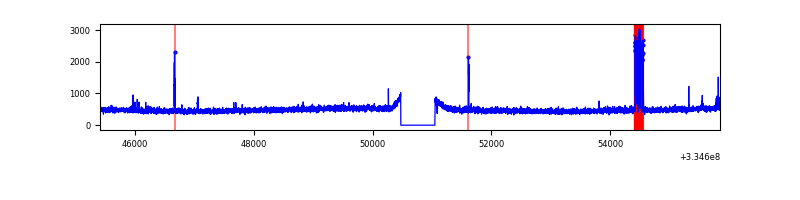 |
| D | 10423 | 9849 | 35 | 35 | 0.34% | 0.36% | 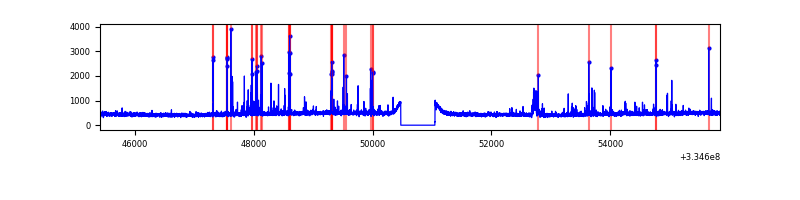 |
Top three noisy pixels from each quadrant. If the there are fewer than three noisy pixels in the level2.evt file, extra rows are filled as -1
| Pixel properties | Quadrant properties | ||||||
|---|---|---|---|---|---|---|---|
| Quadrant | DetID | PixID | Counts | Sigma | Mean | Median | Sigma |
| A | 0 | 13 | 46802 | 188.12 | 1198 | 1170 | 242.6 |
| A | 13 | 254 | 15283 | 58.18 | 1198 | 1170 | 242.6 |
| A | 3 | 137 | 11295 | 41.74 | 1198 | 1170 | 242.6 |
| B | 12 | 111 | 28324 | 118.28 | 1192 | 1163 | 229.6 |
| B | 11 | 111 | 25464 | 105.82 | 1192 | 1163 | 229.6 |
| B | 14 | 111 | 22897 | 94.64 | 1192 | 1163 | 229.6 |
| C | 2 | 16 | 198534 | 727.96 | 1153 | 1159 | 271.1 |
| C | 14 | 238 | 182944 | 670.46 | 1153 | 1159 | 271.1 |
| C | 3 | 233 | 45584 | 163.85 | 1153 | 1159 | 271.1 |
| D | 11 | 176 | 167387 | 595.52 | 1172 | 1146 | 279.1 |
| D | 1 | 52 | 91472 | 323.57 | 1172 | 1146 | 279.1 |
| D | 8 | 195 | 42006 | 146.37 | 1172 | 1146 | 279.1 |
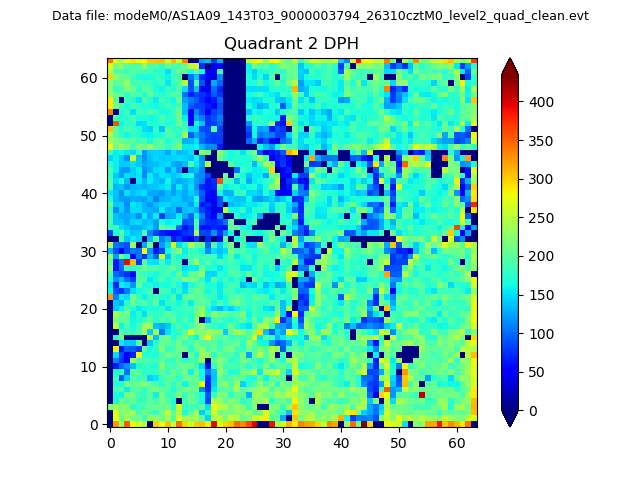
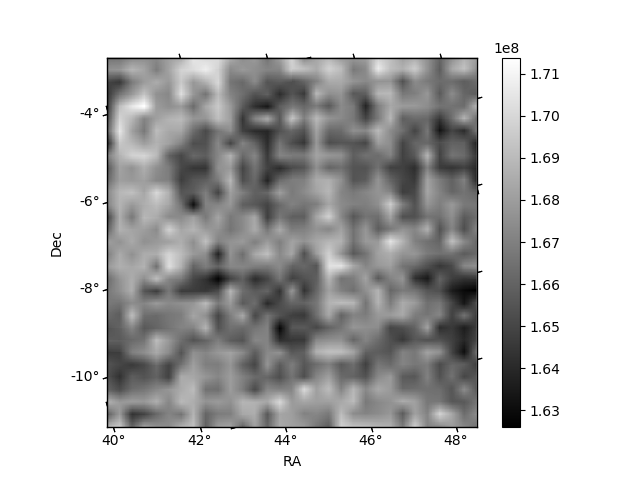
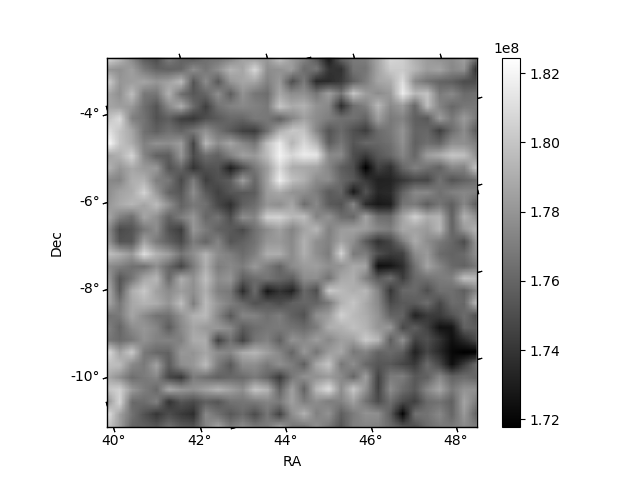
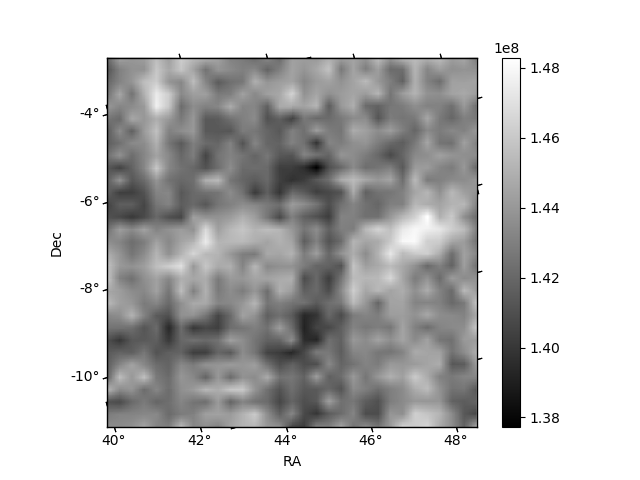
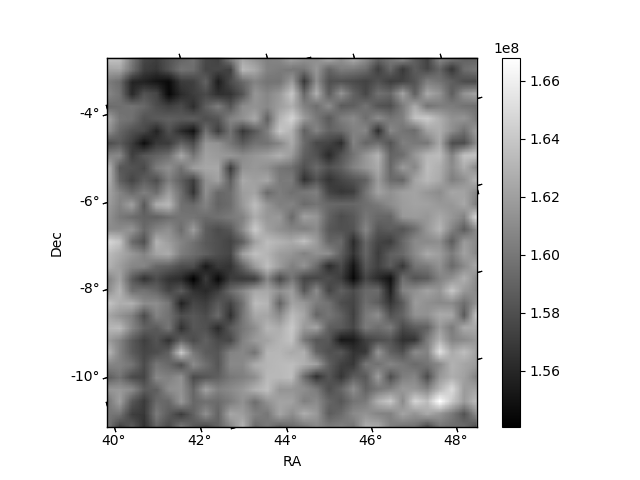
Histogram calculated using DETX and DETY for each event in the final _common_clean file
| Quadrant A | 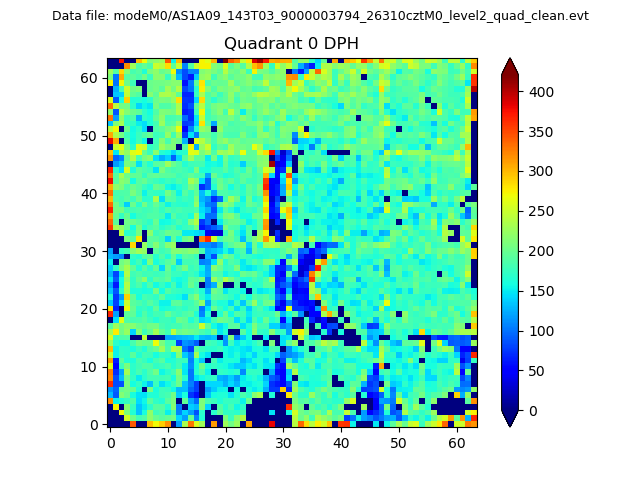 |
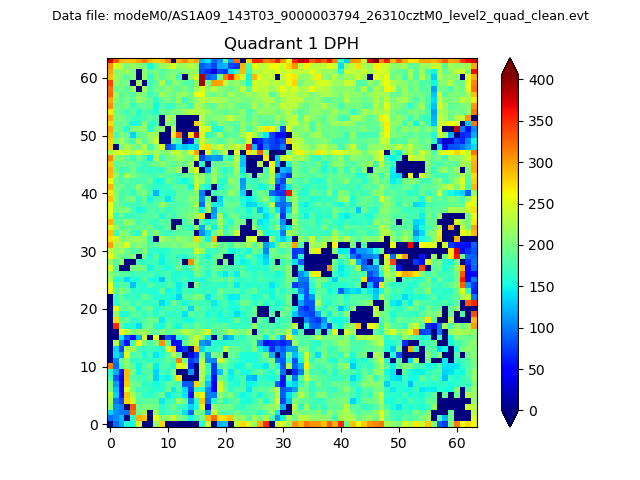 |
Quadrant B |
|---|---|---|---|
| Quadrant D | 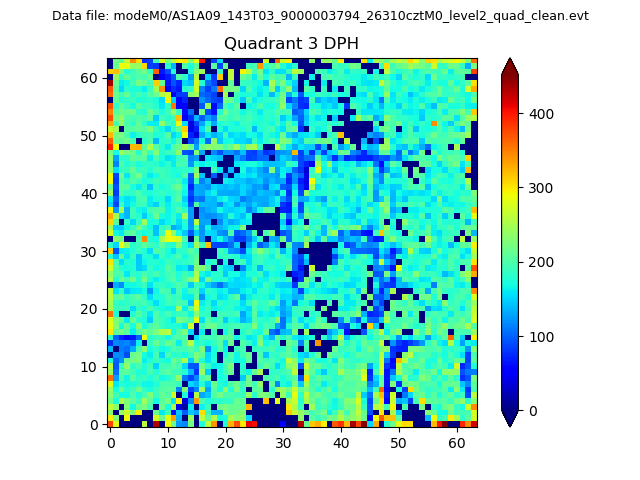 |
 |
Quadrant C |
| Plot type | Count rate plots | Images |
|---|---|---|
| Comparison with Poisson distribution Blue bars denote a histogram of data divided into 1 sec bins. Red curve is a Poisson curve with rate = median count rate of data. |
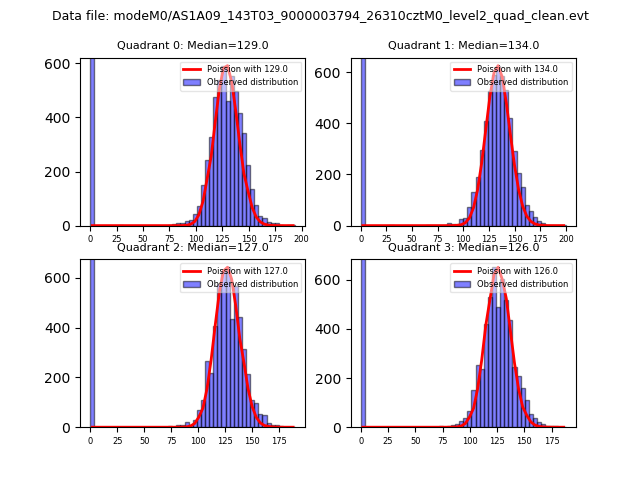 |
 |
| Quadrant-wise count rates Data is divided into 100 sec bins |
 |
|
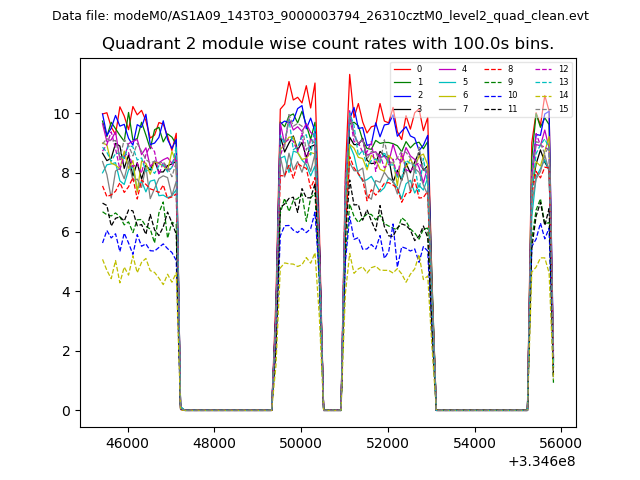
| Module-wise count rates for Quadrant A Data is divided into 100 sec bins |
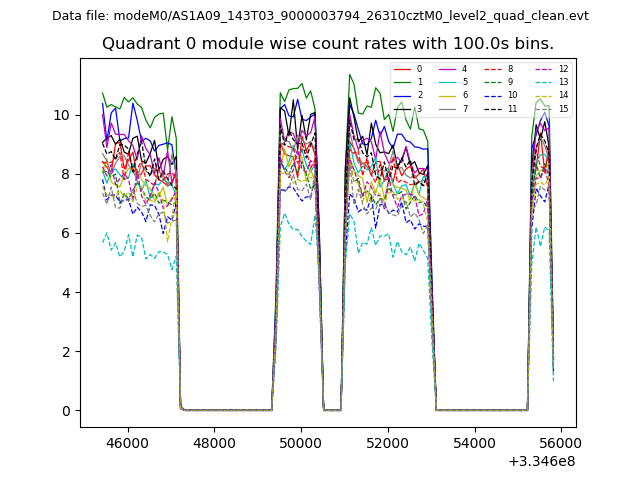 |
 |
| Module-wise count rates for Quadrant B Data is divided into 100 sec bins |
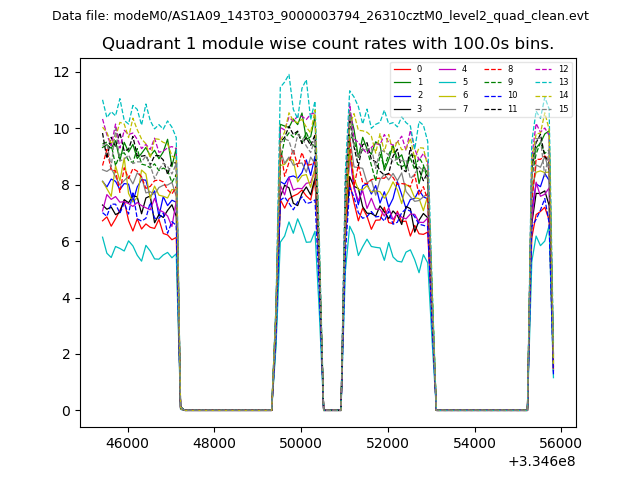 |
 |
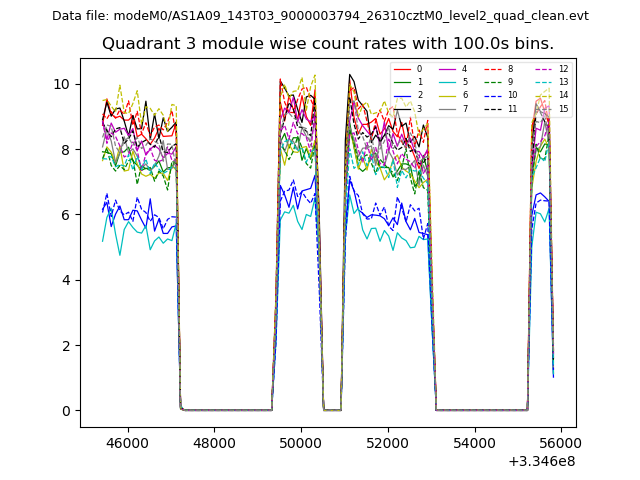
| Module-wise count rates for Quadrant C Data is divided into 100 sec bins |
 |
 |
| Module-wise count rates for Quadrant D Data is divided into 100 sec bins |
 |
 |
| Parameter | Plot |
|---|---|
| CZT HV Monitor | 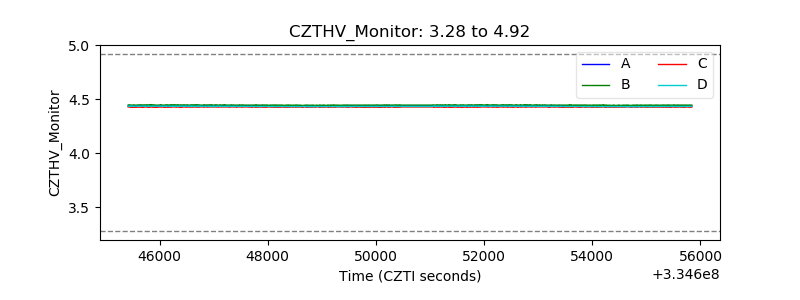 |
| D_VDD | 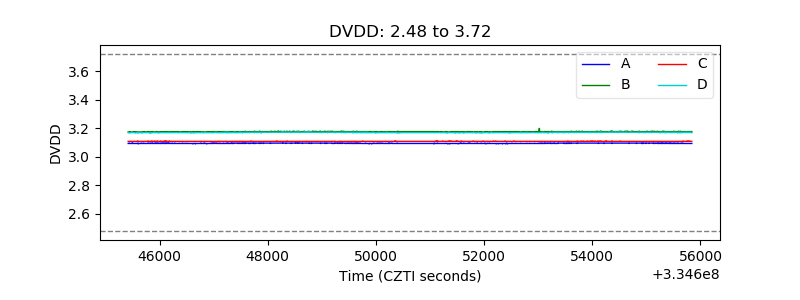 |
| Temperature 1 | 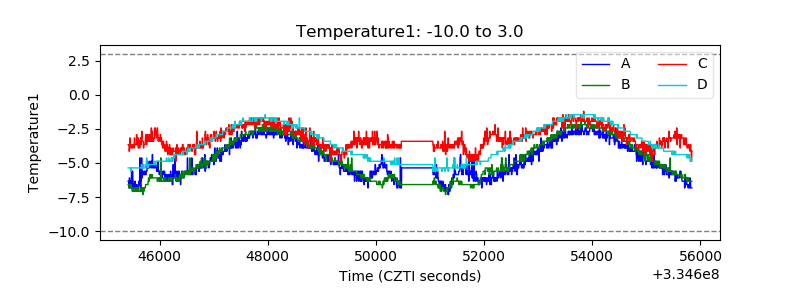 |
| Veto HV Monitor | 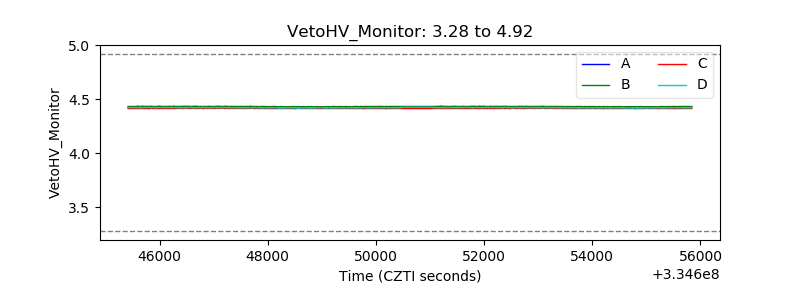 |
| Veto LLD | 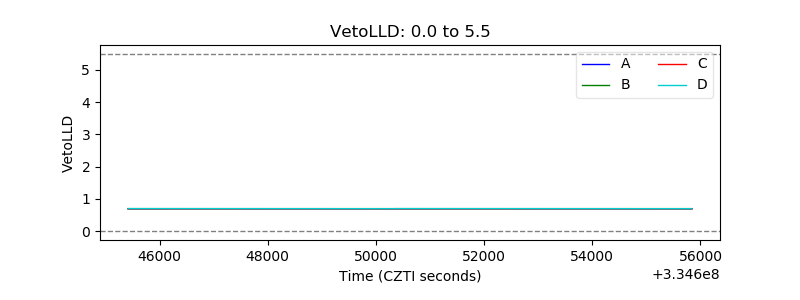 |
| Alpha Counter | 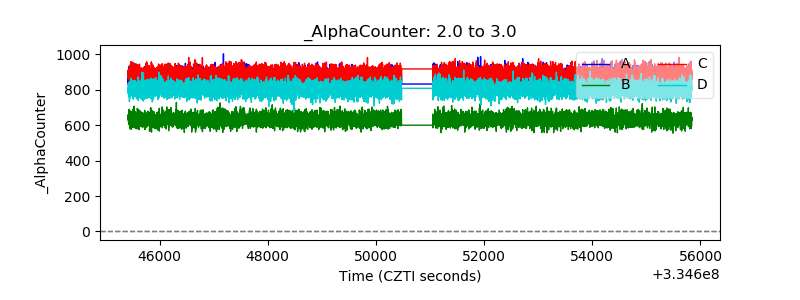 |
| _CPM_Rate | 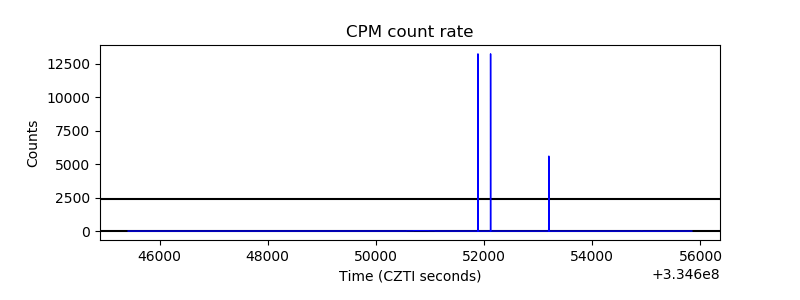 |
| CZT Counter | 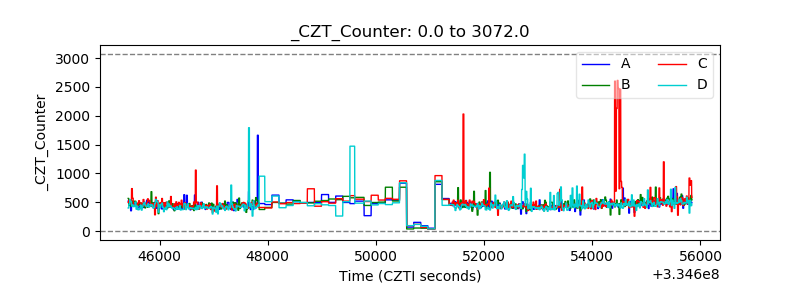 |
| +2.5 Volts monitor |  |
| +5 Volts monitor |  |
| _ROLL_ROT | 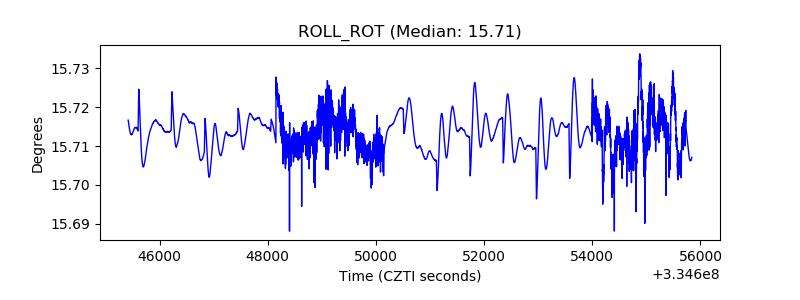 |
| _Roll_DEC | 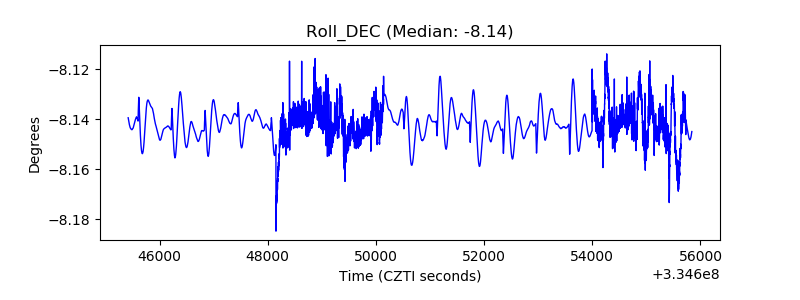 |
| _Roll_RA |  |
| Veto Counter | 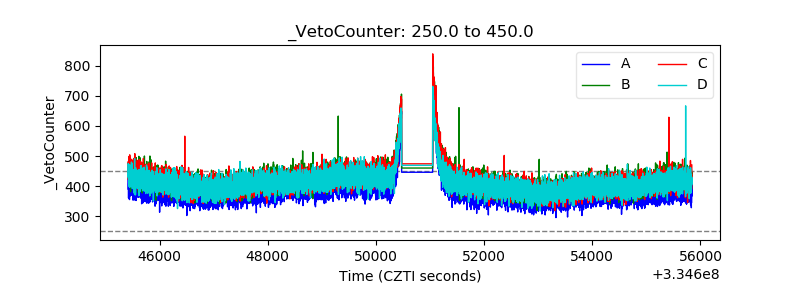 |