| Param | Original file | Final file |
|---|---|---|
| Filename | modeM0/AS1A09_008T02_9000003796cztM0_level2.fits | modeM0/AS1A09_008T02_9000003796cztM0_level2_quad_clean.evt |
| Size (bytes) | 1,914,727,680 | 1,970,913,600 |
| Size | 1.8 GB | 1.8 GB |
| Events in quadrant A | 12,087,318 | 12,450,996 |
| Events in quadrant B | 11,591,338 | 12,601,318 |
| Events in quadrant C | 11,619,000 | 11,676,979 |
| Events in quadrant D | 9,281,482 | 9,569,073 |
| Mode SS | |||
|---|---|---|---|
| Quadrant | BADHDUFLAG | Total packets | Discarded packets |
| A | 0 | 3986 | 0 |
| B | 0 | 3986 | 0 |
| C | 0 | 3986 | 0 |
| D | 0 | 3986 | 0 |
| Mode M0 | |||
|---|---|---|---|
| Quadrant | BADHDUFLAG | Total packets | Discarded packets |
| A | 0 | 404528 | 0 |
| B | 0 | 409442 | 0 |
| C | 0 | 480651 | 0 |
| D | 0 | 681660 | 0 |
| Mode M9 | |||
|---|---|---|---|
| Quadrant | BADHDUFLAG | Total packets | Discarded packets |
| A | 0 | 323 | 0 |
| B | 0 | 323 | 0 |
| C | 0 | 323 | 0 |
| D | 0 | 323 | 0 |
| Quadrant | Total seconds | Saturated seconds | Saturation percentage |
|---|---|---|---|
| A | 195495 | 2020 | 1.033275% |
| B | 195494 | 2688 | 1.374978% |
| C | 195492 | 10474 | 5.357764% |
| D | 195493 | 33077 | 16.919787% |
Noise dominated data is calculated using 1-second bins in cleaned event files. If a bin has >2000 counts, and if more than 50% of those come from <1% of pixels, then it is considered to be noise-dominated and hence unusable.
| Quadrant | # 1 sec bins | Bins with >0 counts | Bins with >2000 counts | High rate bins dominated by noise | Noise dominated (total time) | Noise dominated (detector-on time) | Marked lightcurve |
|---|---|---|---|---|---|---|---|
| A | 236776 | 195492 | 0 | 0 | 0.00% | 0.00% |  |
| B | 236776 | 195489 | 0 | 0 | 0.00% | 0.00% |  |
| C | 236776 | 195473 | 0 | 0 | 0.00% | 0.00% |  |
| D | 236776 | 191894 | 0 | 0 | 0.00% | 0.00% |  |
Top three noisy pixels from each quadrant. If the there are fewer than three noisy pixels in the level2.evt file, extra rows are filled as -1
| Pixel properties | Quadrant properties | ||||||
|---|---|---|---|---|---|---|---|
| Quadrant | DetID | PixID | Counts | Sigma | Mean | Median | Sigma |
| A | 0 | 29 | 9965 | 9.11 | 3153 | 2973 | 767.2 |
| A | 7 | 110 | 9409 | 8.39 | 3153 | 2973 | 767.2 |
| A | 9 | 19 | 9035 | 7.9 | 3153 | 2973 | 767.2 |
| B | 2 | 9 | 9315 | 10.85 | 3072 | 2947 | 587.0 |
| B | 2 | 8 | 7791 | 8.25 | 3072 | 2947 | 587.0 |
| B | 3 | 17 | 7676 | 8.06 | 3072 | 2947 | 587.0 |
| C | 12 | 241 | 8276 | 7.0 | 3072 | 2892 | 768.9 |
| C | 3 | 126 | 7814 | 6.4 | 3072 | 2892 | 768.9 |
| C | 9 | 209 | 7705 | 6.26 | 3072 | 2892 | 768.9 |
| D | 3 | 14 | 6849 | 6.35 | 2646 | 2415 | 698.2 |
| D | 10 | 189 | 6569 | 5.95 | 2646 | 2415 | 698.2 |
| D | 6 | 67 | 6487 | 5.83 | 2646 | 2415 | 698.2 |
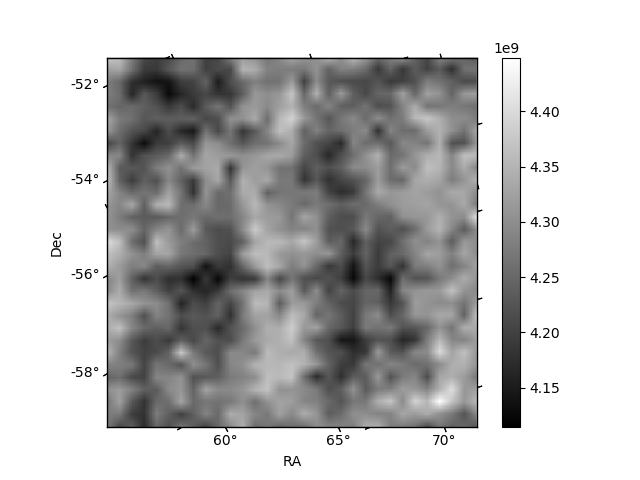
Histogram calculated using DETX and DETY for each event in the final _common_clean file
| Quadrant A | 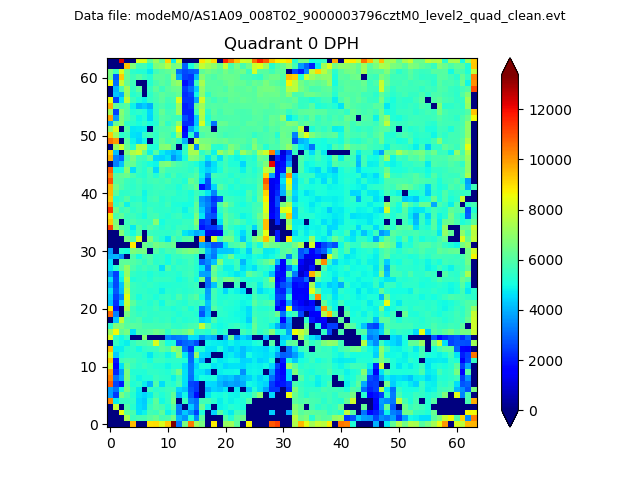 |
 |
Quadrant B |
|---|---|---|---|
| Quadrant D |  |
 |
Quadrant C |
| Plot type | Count rate plots | Images |
|---|---|---|
| Comparison with Poisson distribution Blue bars denote a histogram of data divided into 1 sec bins. Red curve is a Poisson curve with rate = median count rate of data. |
 |
 |
| Quadrant-wise count rates Data is divided into 100 sec bins |
 |
|
| Module-wise count rates for Quadrant A Data is divided into 100 sec bins |
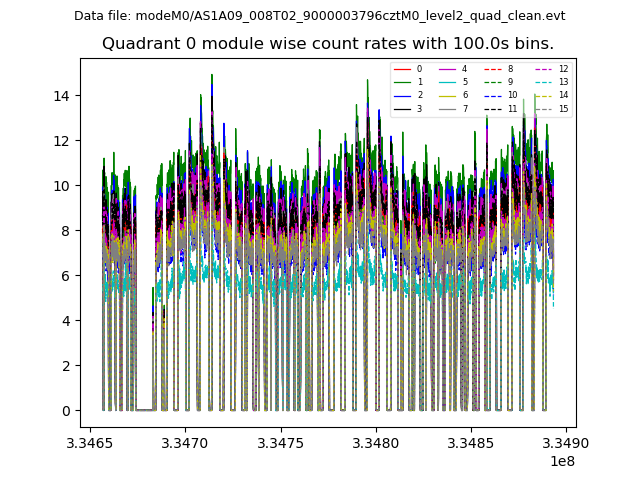 |
 |
| Module-wise count rates for Quadrant B Data is divided into 100 sec bins |
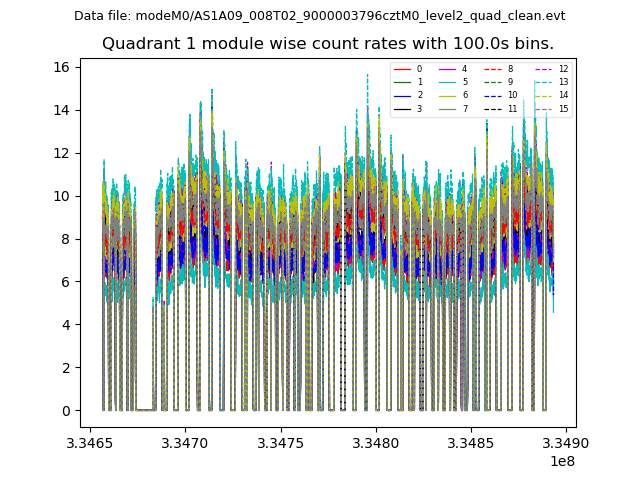 |
 |
| Module-wise count rates for Quadrant C Data is divided into 100 sec bins |
 |
 |
| Module-wise count rates for Quadrant D Data is divided into 100 sec bins |
 |
 |
| Parameter | Plot |
|---|---|
| CZT HV Monitor |  |
| D_VDD | 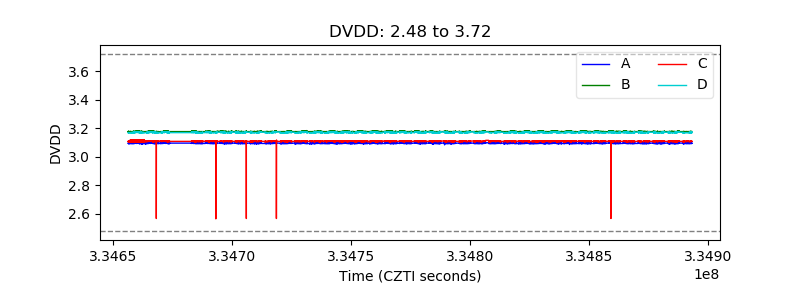 |
| Temperature 1 |  |
| Veto HV Monitor | 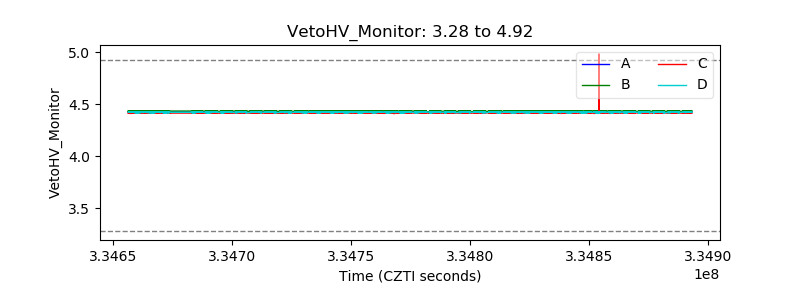 |
| Veto LLD |  |
| Alpha Counter |  |
| _CPM_Rate |  |
| CZT Counter | 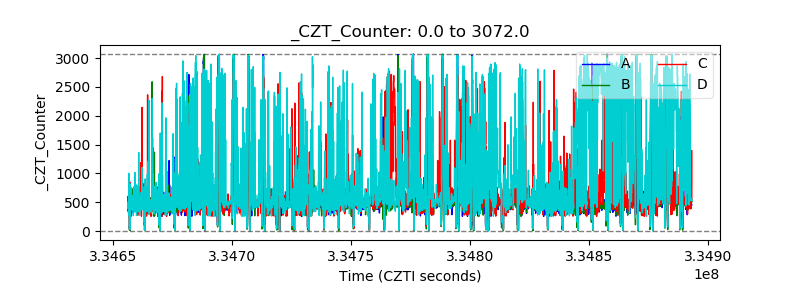 |
| +2.5 Volts monitor |  |
| +5 Volts monitor |  |
| _ROLL_ROT |  |
| _Roll_DEC | 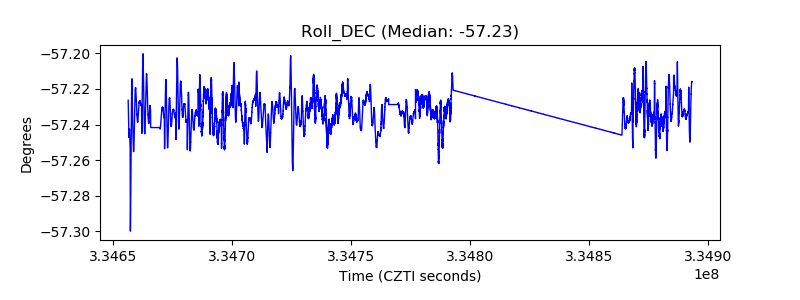 |
| _Roll_RA |  |
| Veto Counter |  |