| Param | Original file | Final file |
|---|---|---|
| Filename | modeM0/AS1A09_008T02_9000003796_26305cztM0_level2.evt | modeM0/AS1A09_008T02_9000003796_26305cztM0_level2_quad_clean.evt |
| Size (bytes) | 156,470,400 | 45,578,880 |
| Size | 149.2 MB | 43.5 MB |
| Events in quadrant A | 1,128,952 | 301,021 |
| Events in quadrant B | 1,140,327 | 310,943 |
| Events in quadrant C | 1,185,232 | 299,617 |
| Events in quadrant D | 1,119,472 | 296,706 |
| Mode M0 | |||
|---|---|---|---|
| Quadrant | BADHDUFLAG | Total packets | Discarded packets |
| A | 0 | 4946 | 0 |
| B | 0 | 4969 | 0 |
| C | 0 | 5001 | 0 |
| D | 0 | 4956 | 0 |
| Mode M9 | |||
|---|---|---|---|
| Quadrant | BADHDUFLAG | Total packets | Discarded packets |
| A | 0 | 3 | 0 |
| B | 0 | 3 | 0 |
| C | 0 | 3 | 0 |
| D | 0 | 3 | 0 |
| Quadrant | Total seconds | Saturated seconds | Saturation percentage |
|---|---|---|---|
| A | 2384 | 83 | 3.481544% |
| B | 2384 | 104 | 4.362416% |
| C | 2384 | 118 | 4.949664% |
| D | 2384 | 64 | 2.684564% |
Noise dominated data is calculated using 1-second bins in cleaned event files. If a bin has >2000 counts, and if more than 50% of those come from <1% of pixels, then it is considered to be noise-dominated and hence unusable.
| Quadrant | # 1 sec bins | Bins with >0 counts | Bins with >2000 counts | High rate bins dominated by noise | Noise dominated (total time) | Noise dominated (detector-on time) | Marked lightcurve |
|---|---|---|---|---|---|---|---|
| A | 2659 | 2386 | 0 | 0 | 0.00% | 0.00% | 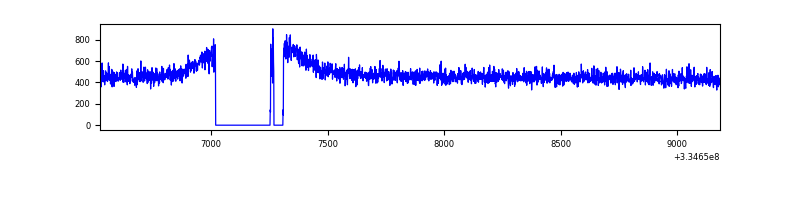 |
| B | 2659 | 2386 | 0 | 0 | 0.00% | 0.00% | 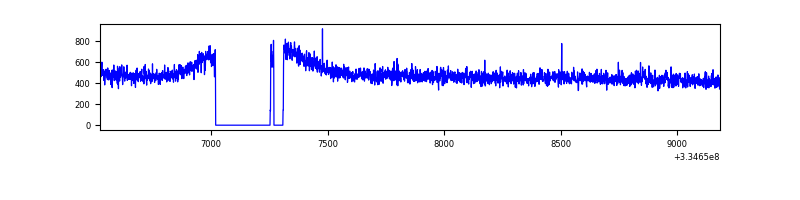 |
| C | 2659 | 2386 | 0 | 0 | 0.00% | 0.00% | 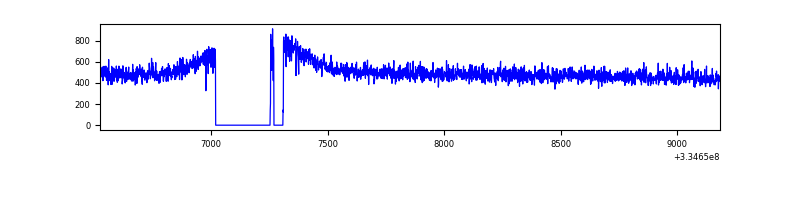 |
| D | 2659 | 2386 | 1 | 1 | 0.04% | 0.04% | 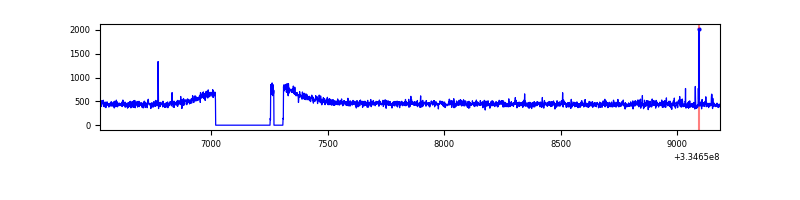 |
Top three noisy pixels from each quadrant. If the there are fewer than three noisy pixels in the level2.evt file, extra rows are filled as -1
| Pixel properties | Quadrant properties | ||||||
|---|---|---|---|---|---|---|---|
| Quadrant | DetID | PixID | Counts | Sigma | Mean | Median | Sigma |
| A | 13 | 254 | 3448 | 52.35 | 292 | 284 | 60.4 |
| A | 3 | 137 | 2776 | 41.23 | 292 | 284 | 60.4 |
| A | 0 | 226 | 2468 | 36.13 | 292 | 284 | 60.4 |
| B | 12 | 111 | 6908 | 115.38 | 290 | 282 | 57.4 |
| B | 11 | 111 | 6294 | 104.69 | 290 | 282 | 57.4 |
| B | 14 | 111 | 5684 | 94.07 | 290 | 282 | 57.4 |
| C | 14 | 238 | 45288 | 652.99 | 288 | 288 | 68.9 |
| C | 8 | 128 | 5996 | 82.83 | 288 | 288 | 68.9 |
| C | 3 | 233 | 5827 | 80.38 | 288 | 288 | 68.9 |
| D | 2 | 234 | 9104 | 124.94 | 292 | 284 | 70.6 |
| D | 11 | 176 | 7080 | 96.27 | 292 | 284 | 70.6 |
| D | 13 | 243 | 2947 | 37.72 | 292 | 284 | 70.6 |
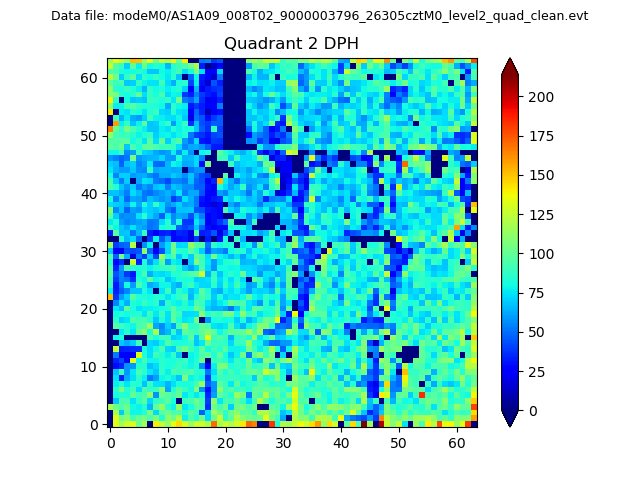
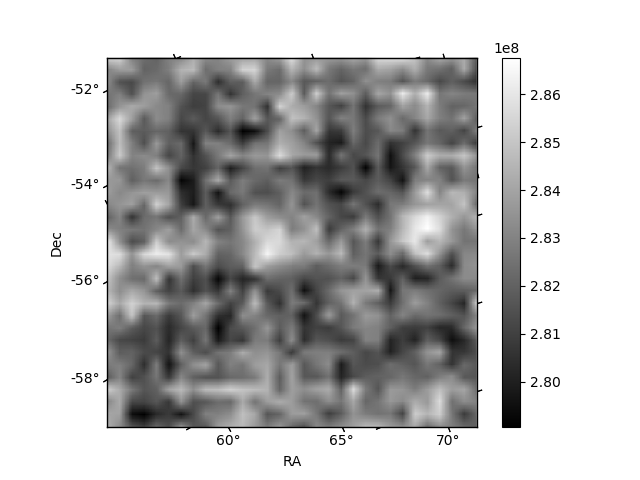
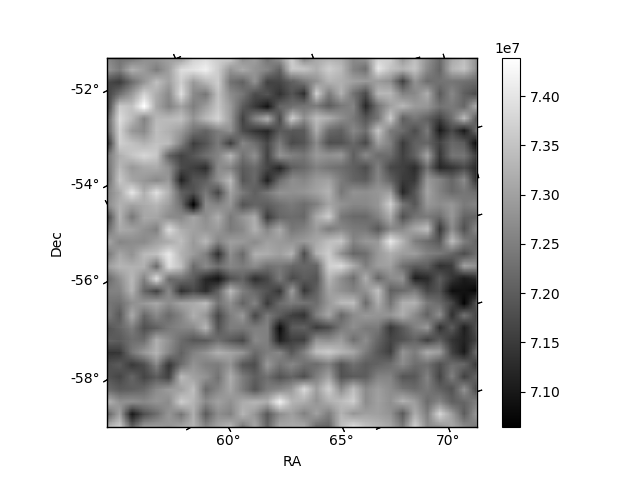
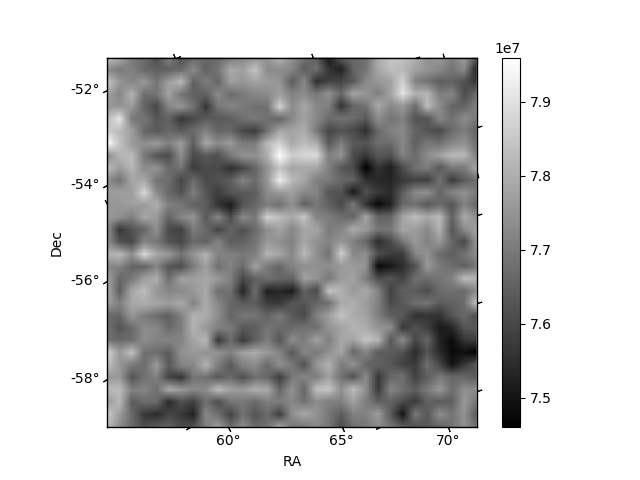
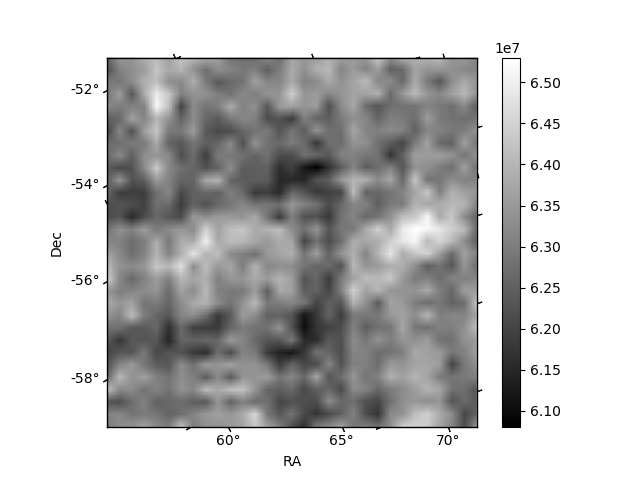
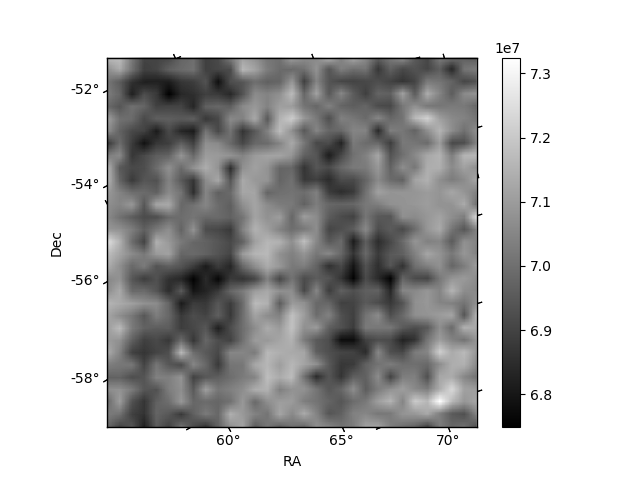
Histogram calculated using DETX and DETY for each event in the final _common_clean file
| Quadrant A | 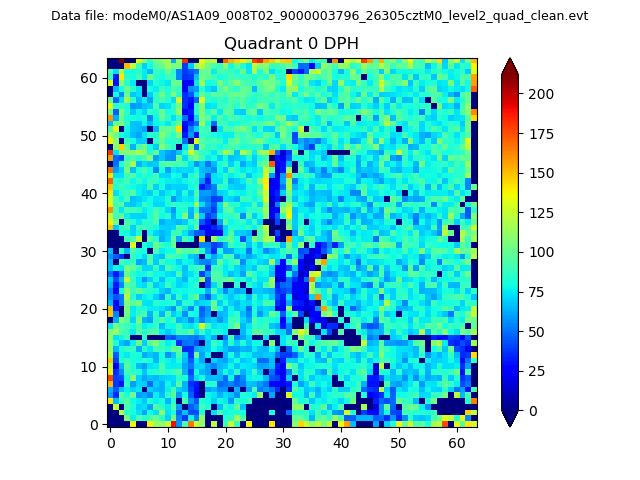 |
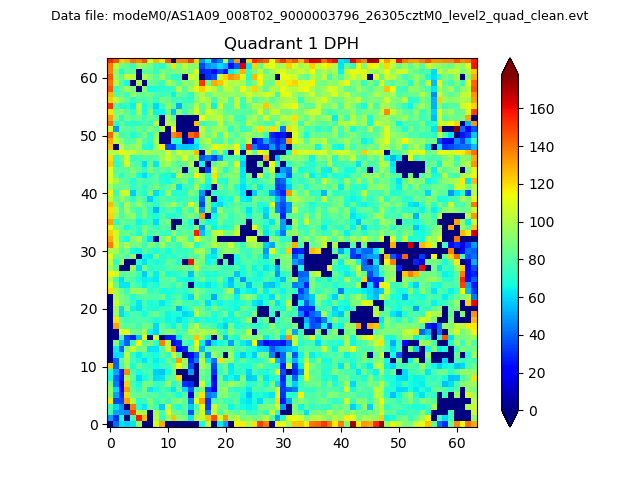 |
Quadrant B |
|---|---|---|---|
| Quadrant D | 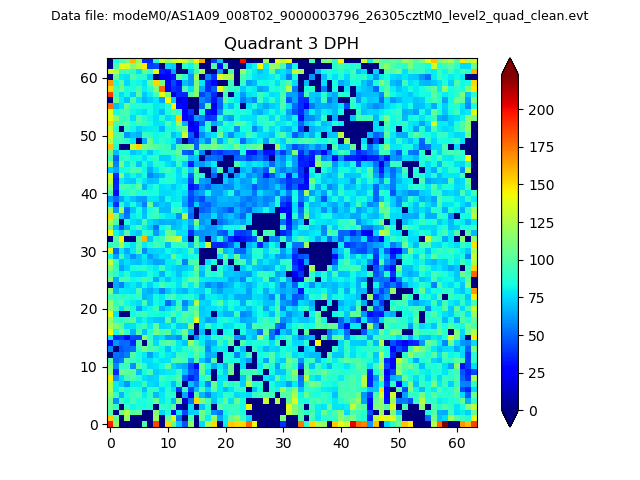 |
 |
Quadrant C |
| Plot type | Count rate plots | Images |
|---|---|---|
| Comparison with Poisson distribution Blue bars denote a histogram of data divided into 1 sec bins. Red curve is a Poisson curve with rate = median count rate of data. |
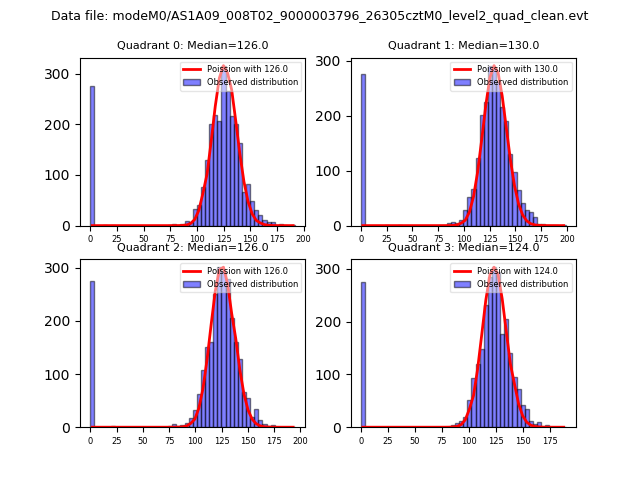 |
 |
| Quadrant-wise count rates Data is divided into 100 sec bins |
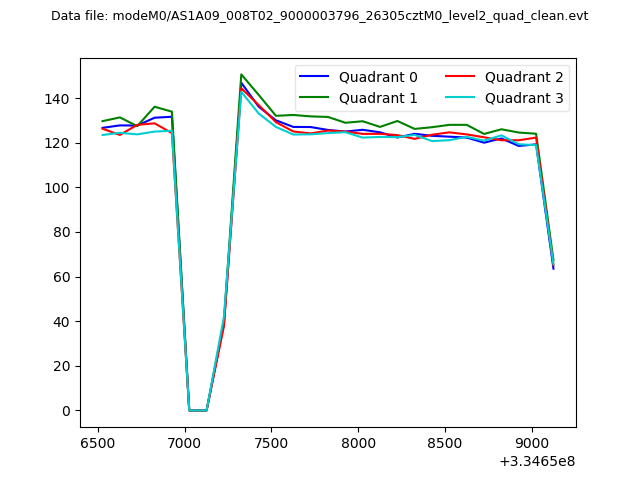 |
|
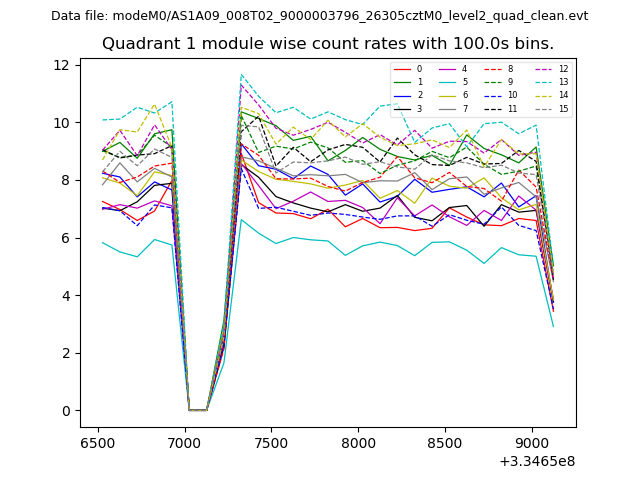
| Module-wise count rates for Quadrant A Data is divided into 100 sec bins |
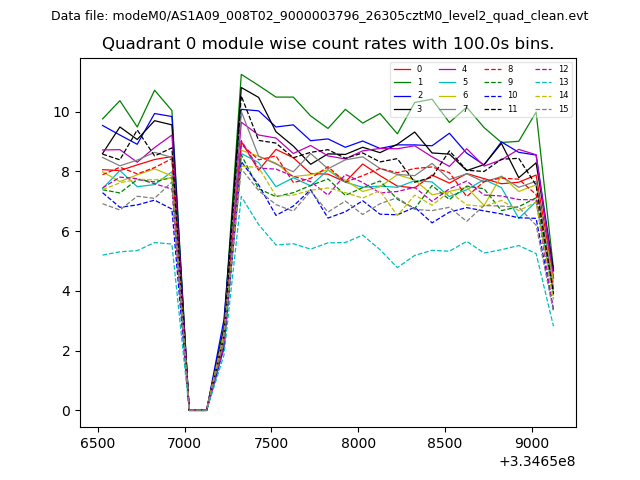 |
 |
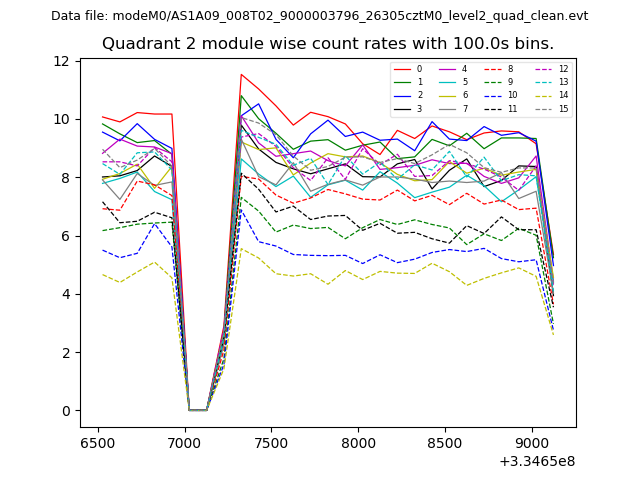
| Module-wise count rates for Quadrant B Data is divided into 100 sec bins |
 |
 |
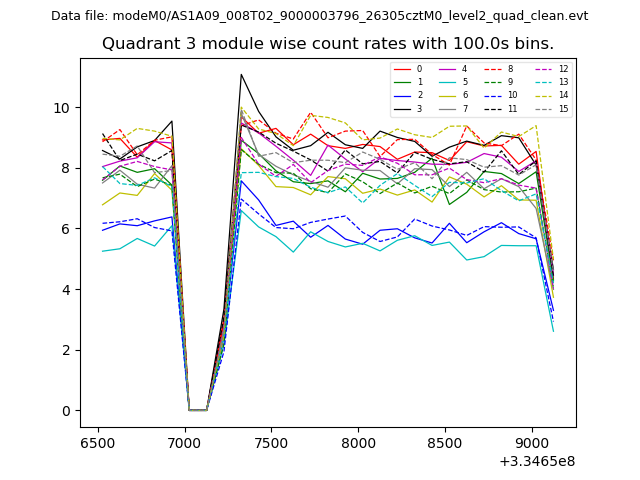
| Module-wise count rates for Quadrant C Data is divided into 100 sec bins |
 |
 |
| Module-wise count rates for Quadrant D Data is divided into 100 sec bins |
 |
 |
| Parameter | Plot |
|---|---|
| CZT HV Monitor | 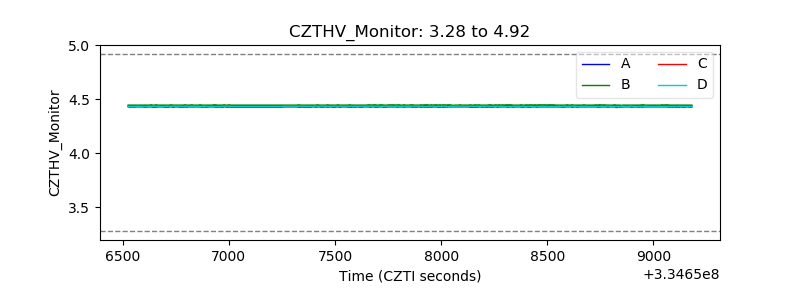 |
| D_VDD | 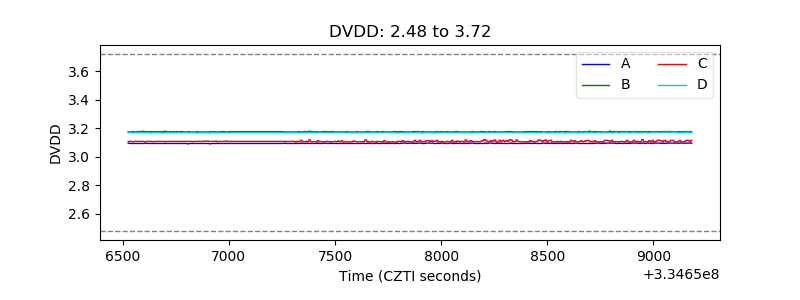 |
| Temperature 1 | 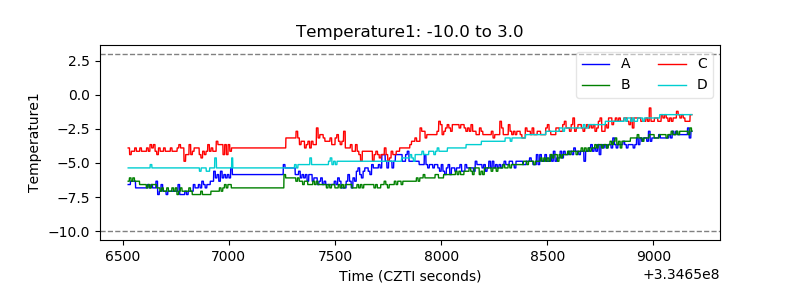 |
| Veto HV Monitor | 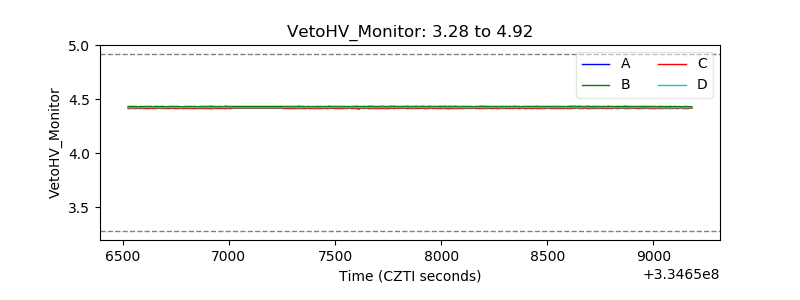 |
| Veto LLD | 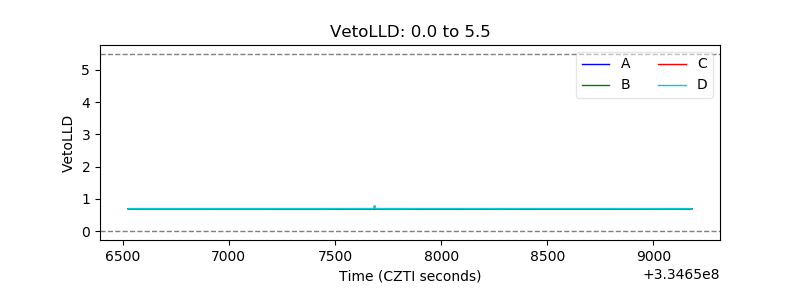 |
| Alpha Counter | 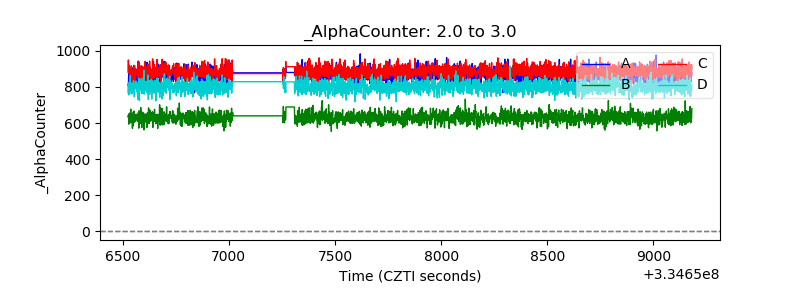 |
| _CPM_Rate | 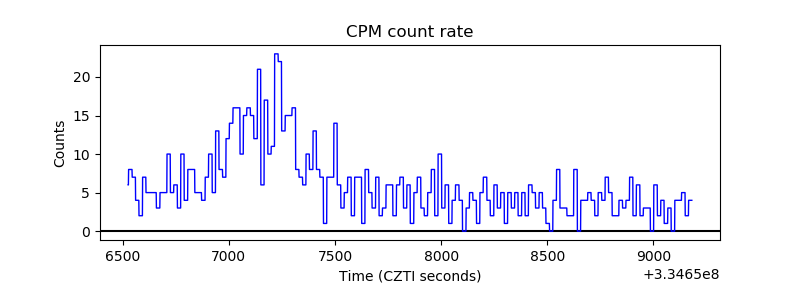 |
| CZT Counter | 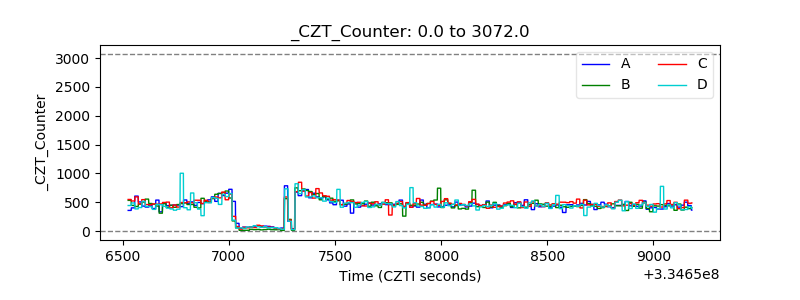 |
| +2.5 Volts monitor | 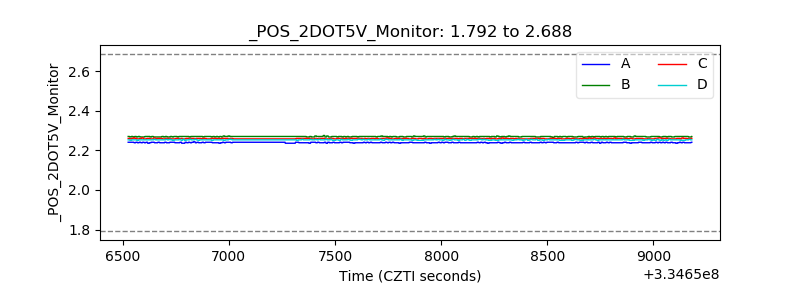 |
| +5 Volts monitor |  |
| _ROLL_ROT | 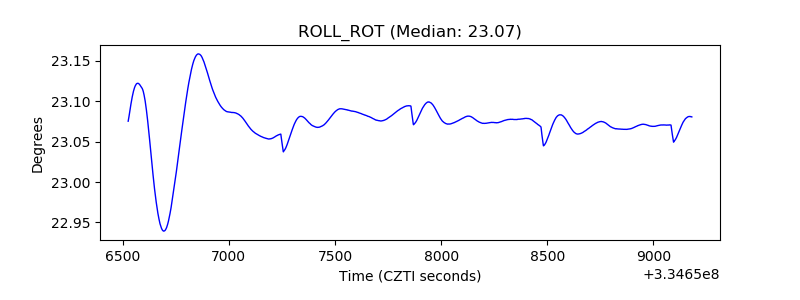 |
| _Roll_DEC | 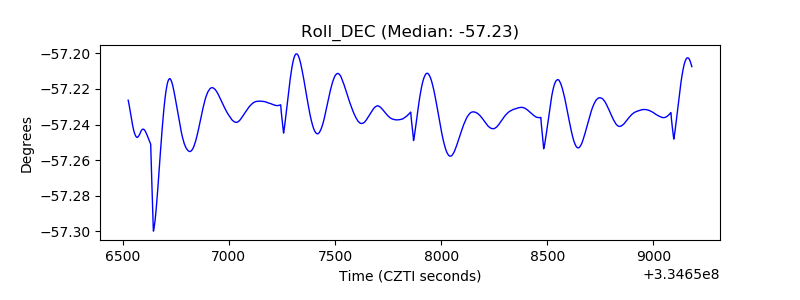 |
| _Roll_RA | 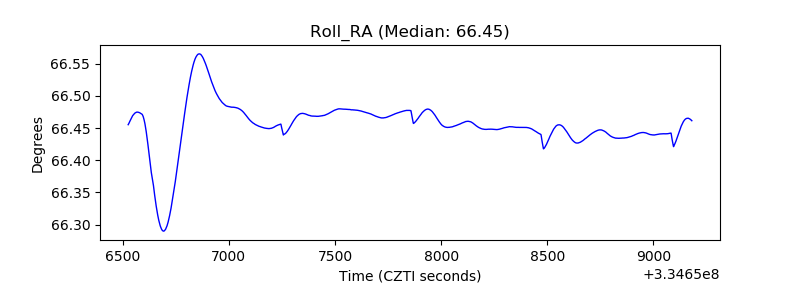 |
| Veto Counter | 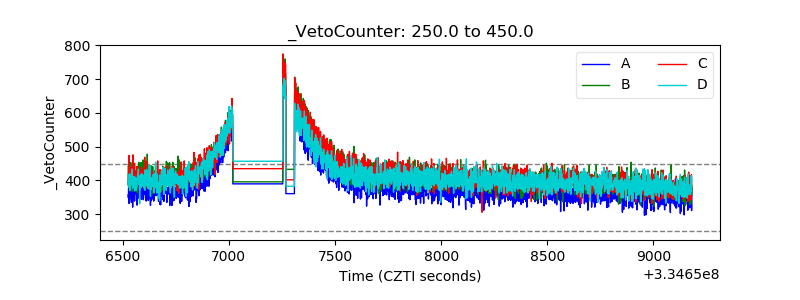 |